. 2021 Dec 24;14(1):90.
doi: 10.3390/cancers14010090.

Aging Aggravates Cachexia in Tumor-Bearing Mice

Affiliations

Aging Aggravates Cachexia in Tumor-Bearing Mice

Julia Geppert et al. Cancers (Basel). .

Abstract

Background: Cancer is primarily a disease of high age in humans, yet most mouse studies on cancer cachexia are conducted using young adolescent mice. Given that metabolism and muscle function change with age, we hypothesized that aging may affect cachexia progression in mouse models.

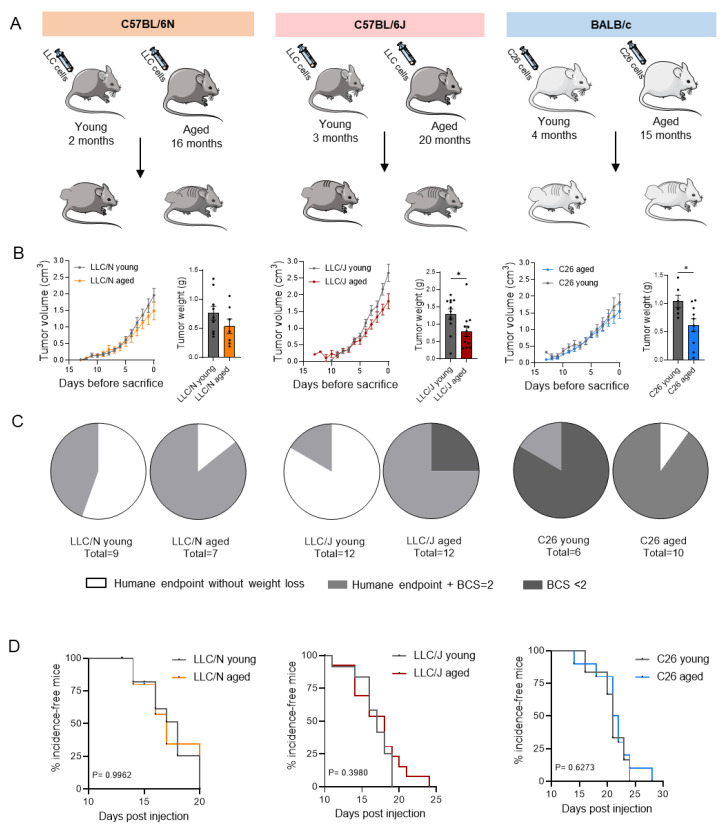
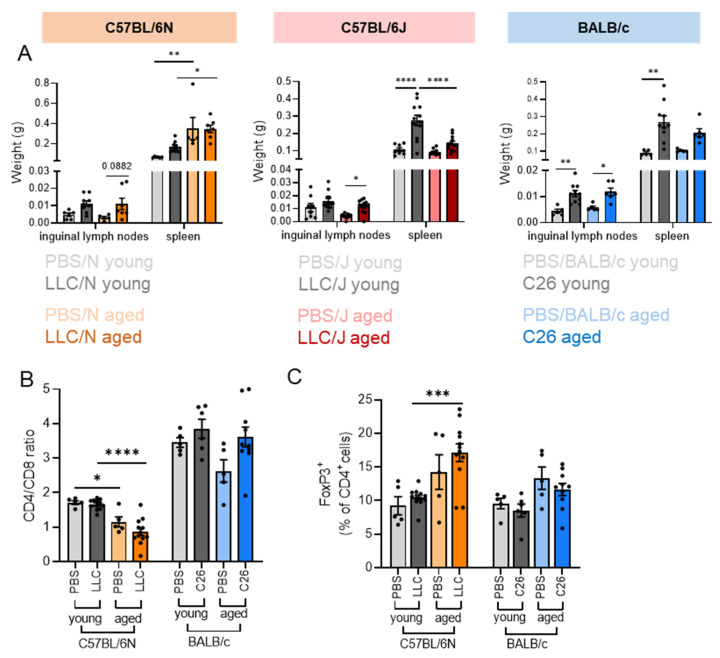
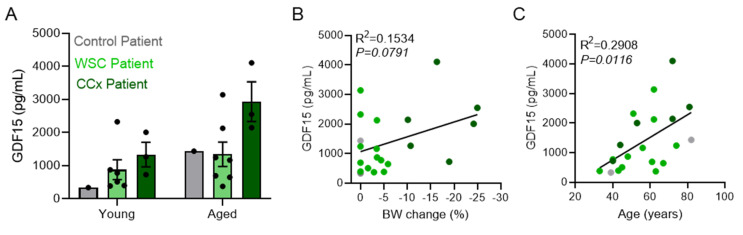
Methods: We compare tumor and cachexia development in young and old mice of three different strains (C57BL/6J, C57BL/6N, BALB/c) and with two different tumor cell lines (Lewis Lung Cancer, Colon26). Tumor size, body and organ weights, fiber cross-sectional area, circulating cachexia biomarkers, and molecular markers of muscle atrophy and adipose tissue wasting are shown. We correlate inflammatory markers and body weight dependent on age in patients with cancer.

Results: We note fundamental differences between mouse strains. Aging aggravates weight loss in LLC-injected C57BL/6J mice, drives it in C57BL/6N mice, and does not influence weight loss in C26-injected BALB/c mice. Glucose tolerance is unchanged in cachectic young and old mice. The stress marker GDF15 is elevated in cachectic BALB/c mice independent of age and increased in old C57BL/6N and J mice. Inflammatory markers correlate significantly with weight loss only in young mice and patients.

Conclusions: Aging affects cachexia development and progression in mice in a strain-dependent manner and influences the inflammatory profile in both mice and patients. Age is an important factor to consider for future cachexia studies.

Keywords: aging; cachexia; cancer; mouse models.


Conflict of interest statement

The authors declare no conflict of interest.

Figures

Figure 1
Figure 1
Tumor growth is largely unaffected by age in different mouse models with various tumor entities. (A) Diagram presenting three different cachexia mouse models including groups of several ages. Mice were injected with different tumor cell lines (LLC and C26). C57BL/6N (orange)—comparison of young adult (2 months, grey, n = 9) and aged (16 months, orange, n = 7) LLC-injected C57BL/6N mice. C57BL/6J (red—comparison of young adult (3 months, grey, n = 12) and aged (20 months, red, n = 12) LLC-injected C57BL/6J mice. BALB/c (blue)—comparison of young adult (4 months, grey, n = 6) and aged (15 months, blue, n = 10) C26-injected BALB/c mice. (B) Tumor growth over time and tumor weight at the end of the experiment in young and aged LLC/N, LLC/J, and C26-BALB/c mice. (C) Pie charts representing the primary termination criteria of tumor-bearing mice. We differentiated between animals that reached the humane endpoint but had a stable bodyweight (white) versus mice that reached the humane endpoint and simultaneously had already lost between 3–10 % of body weight (BCS = 2, light grey). Animals with a BCS < 2 were terminated due to cachexia. (D) Incidence-free time between young and aged tumor cell-injected LLC/N, LLC/J, and C26-BALB/c mice. Data are mean ± s.e.m. Statistical analyses were performed using unpaired t-test or Mann–Whitney test (B), and log-rank (Mantel–Cox) test (D). * p < 0.05.
Figure 2
Figure 2
Strain-dependent differences in cancer-induced weight loss development. (AC) Mice of different ages were injected with either PBS (control) or a tumor cell line (LLC or C26). Young adult mice (grey lines and bars) injected with PBS are depicted in light grey (PBS/N young n = 6, PBS/J young n = 8, PBS/BALB/c young n = 5), young mice injected with a tumor cell line are shown in dark grey (LLC/N young n = 9, LLC/J young n = 12, C26 young n = 6). Aged mice injected with PBS are depicted in light colors (PBS/N aged n = 5-light orange, PBS/J aged n = 10-light red, PBS/BALB/c aged n = 5-light blue), while aged mice injected with a tumor cell line are shown in dark colors (LLC/N aged n = 7-dark orange, LLC/J aged n = 12-dark red, C26 aged n = 10-dark blue). (A) Time course of body weight development (change in percentage compared to initial body weight before injection). (B) Change of body weight minus tumor compared to initial mass (expressed as percentage). (C) Tissue weights of inguinal white adipose tissue (iWAT), epididymal WAT (eWAT), and gastrocnemius skeletal muscle (GC). Data are mean ± s.e.m. Statistical analyses were performed using two-way analysis of variance (ANOVA) with Tukey’s multiple-comparison post hoc test. * p < 0.05, ** p < 0.01, *** p < 0.001, **** p < 0.0001.
Figure 3
Figure 3
Cachexia development in aged mice is not associated with alterations in immune cell subtype composition. (AC) Same mice as in Figure 2 were used for the analysis of immunologic changes upon aging. (A) Tissue weights of inguinal lymph nodes and spleen. (B) CD4/CD8 ratio of T cells isolated from blood. (C) Percentage of FoxP3-positive cells (% of CD4+ T cells). T cells isolated from blood. Data are mean ± s.e.m. Statistical analyses were performed using two-way ANOVA with Tukey’s multiple-comparison post hoc test. * p < 0.05, ** p < 0.01, *** p < 0.001, **** p < 0.0001.
Figure 4
Figure 4
Aging increases the tumor-induced expression of atrogenes in cachectic muscle. (A) Representative staining for wheat germ agglutinin (green) and nuclei (blue) showing morphological changes in gastrocnemius muscles of PBS, LLC, and C26-injected young and aged mice; 20x magnification, scale bar 100 µm. (B) Quantification of fiber cross-sectional area in gastrocnemius muscles (n = 4, >500 fibers/mouse). (CE) Expression of different cachexia-associated genes in gastrocnemius muscle (GC) of the same mice as in Figure 2. (C) mRNA expression of atrogenes in aged and young mice. (D) Cyclin-dependent kinase inhibitor 1A (Cdkn1a) mRNA levels. (E) Adipocyte triglyceride lipase (Atgl) and perilipin 4 (Plin4) gene expression. Data are mean ± s.e.m. Statistical analyses were performed using two-way ANOVA with Tukey’s multiple-comparison post hoc test. * p < 0.05, ** p < 0.01, *** p < 0.001, **** p < 0.0001.
Figure 5
Figure 5
Age-dependent mitochondrial stress and inflammation in adipose tissue. (A,B) Expression of genes involved in different inflammatory and stress-related pathways was analyzed in epididymal white adipose tissue (eWAT) of the same mice as in Figure 2. (A) Gene expression of individual markers of mitochondrial dysfunction. (B) Expression of inflammatory marker genes. Data are mean ± s.e.m. Statistical analyses were performed using two-way ANOVA with Tukey’s multiple-comparison post hoc test. * p < 0.05, ** p < 0.01, *** p < 0.001, **** p < 0.0001.
Figure 6
Figure 6
Circulating IL6 and GDF15 levels are cachexia markers in C26 mice. (AG) Same mice as in Figure 2. (A,B) Circulating levels of interleukin 6 (IL6) (A) and growth differentiation factor 15 (GDF15) (B) in young and aged mice. (C,D) Linear regression analyses comparing plasma IL6 (C) or GDF15 (D) levels and body weight change (final body weight minus tumor compared to initial body weight). (E) Gene expression of GDF15 in murine GC muscles. (F,G) Linear regression analyses of plasma IL6 (F) or GDF15 (G) levels and body weight change (final body weight minus tumor compared to initial body weight) in either young or aged mice across all mouse models. Data are mean ± s.e.m. Statistical analyses were performed using two-way ANOVA with Tukey’s multiple-comparison post hoc test (A,B,E), and simple linear regression (C,D,F,G). * p < 0.05, ** p < 0.01, *** p < 0.001, **** p < 0.0001.
Figure 7
Figure 7
GDF15 significantly correlates with age of patients, but not body weight (BW) change. We compared GDF15 levels of control patients without tumor, as well as patients with gastrointestinal cancer with or without BW loss. (A) Total plasma GDF15 levels. (B,C) Linear regression analysis comparing human plasma GDF15 levels and BW change in percentage (B) or age in years (C) of patients. Data are mean ± s.e.m. Statistical analyses were performed using two-way ANOVA with Tukey’s multiple-comparison post hoc test (A), and simple linear regression (B,C).

References

    1. Fearon K., Strasser F., Anker S.D., Bosaeus I., Bruera E., Fainsinger R.L., Jatoi A., Loprinzi C., MacDonald N., Mantovani G., et al. Definition and classification of cancer cachexia: An international consensus. Lancet Oncol. 2011;12:489–495. doi: 10.1016/S1470-2045(10)70218-7. - DOI - PubMed
    1. Berben L., Floris G., Wildiers H., Hatse S. Cancer and Aging: Two Tightly Interconnected Biological Processes. Cancers. 2021;13:1400. doi: 10.3390/cancers13061400. - DOI - PMC - PubMed
    1. Dunne R.F., Loh K.P., Williams G.R., Jatoi A., Mustian K.M., Mohile S.G. Cachexia and Sarcopenia in Older Adults with Cancer: A Comprehensive Review. Cancers. 2019;11:1861. doi: 10.3390/cancers11121861. - DOI - PMC - PubMed
    1. Kuraguchi M., Wang X.-P., Bronson R.T., Rothenberg R., Ohene-Baah N.Y., Lund J.J., Kucherlapati M., Maas R.L., Kucherlapati R. Adenomatous Polyposis Coli (APC) Is Required for Normal Development of Skin and Thymus. PLoS Genet. 2006;2:e146. doi: 10.1371/journal.pgen.0020146. - DOI - PMC - PubMed
    1. Hingorani S.R., Wang L., Multani A.S., Combs C., Deramaudt T.B., Hruban R.H., Rustgi A.K., Chang S., Tuveson D.A. Trp53R172H and KrasG12D cooperate to promote chromosomal instability and widely metastatic pancreatic ductal adenocarcinoma in mice. Cancer Cell. 2005;7:469–483. doi: 10.1016/j.ccr.2005.04.023. - DOI - PubMed

LinkOut - more resources