. 2021 Dec 31;14(1):192.
doi: 10.3390/cancers14010192.

A Shortcut from Metabolic-Associated Fatty Liver Disease (MAFLD) to Hepatocellular Carcinoma (HCC): c-MYC a Promising Target for Preventative Strategies and Individualized Therapy

Affiliations

A Shortcut from Metabolic-Associated Fatty Liver Disease (MAFLD) to Hepatocellular Carcinoma (HCC): c-MYC a Promising Target for Preventative Strategies and Individualized Therapy

Feifei Guo et al. Cancers (Basel). .

Abstract

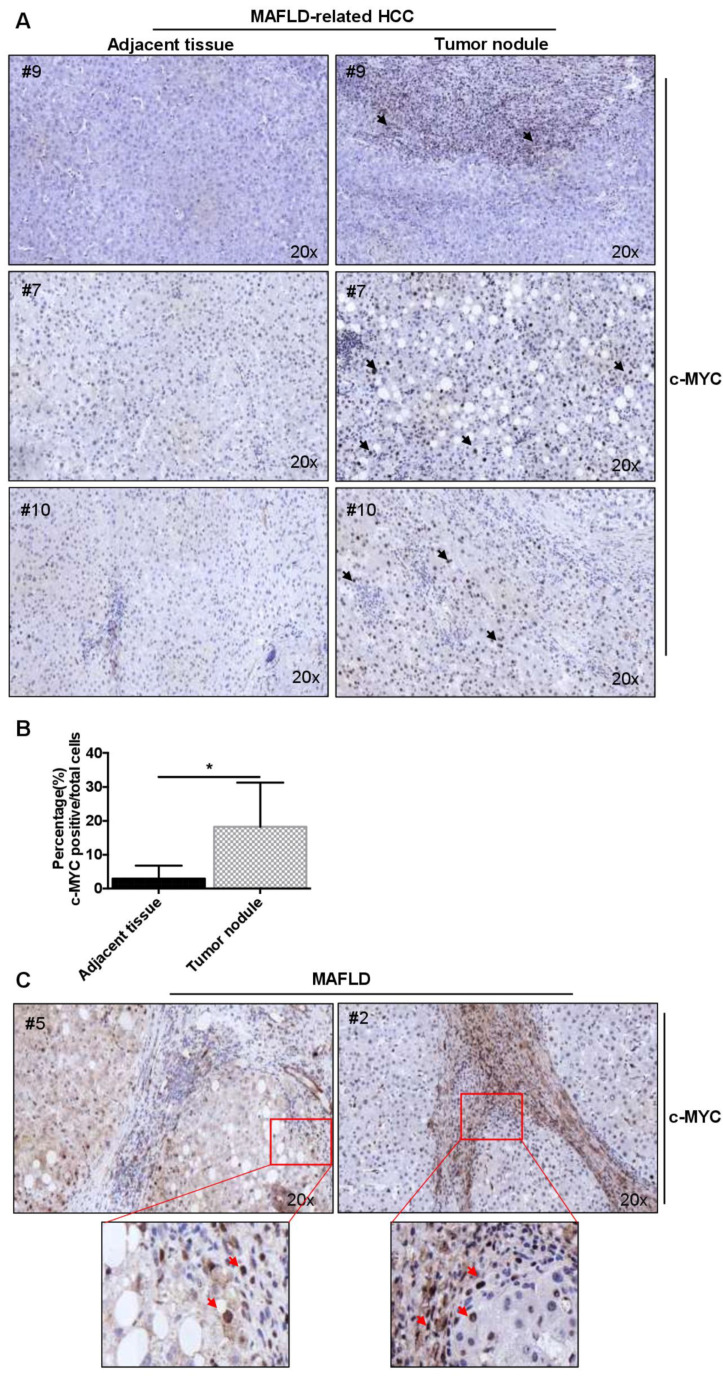
Background: Metabolic-associated fatty liver disease (MAFLD) has risen as one of the leading etiologies for hepatocellular carcinoma (HCC). Oncogenes have been suggested to be responsible for the high risk of MAFLD-related HCC. We analyzed the impact of the proto-oncogene c-MYC in the development of human and murine MAFLD and MAFLD-associated HCC.

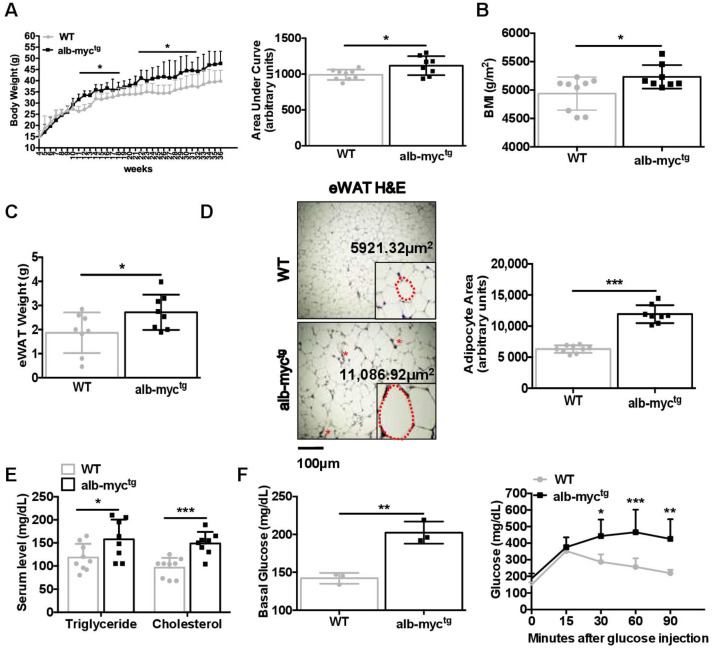
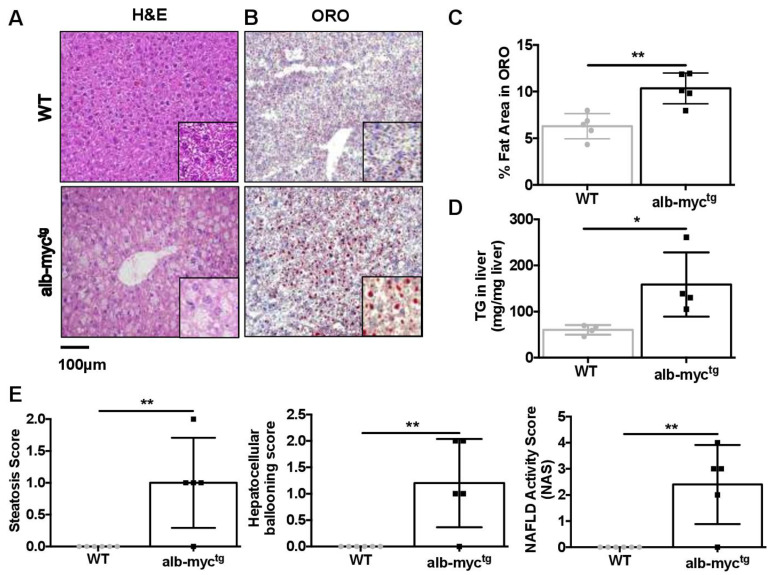
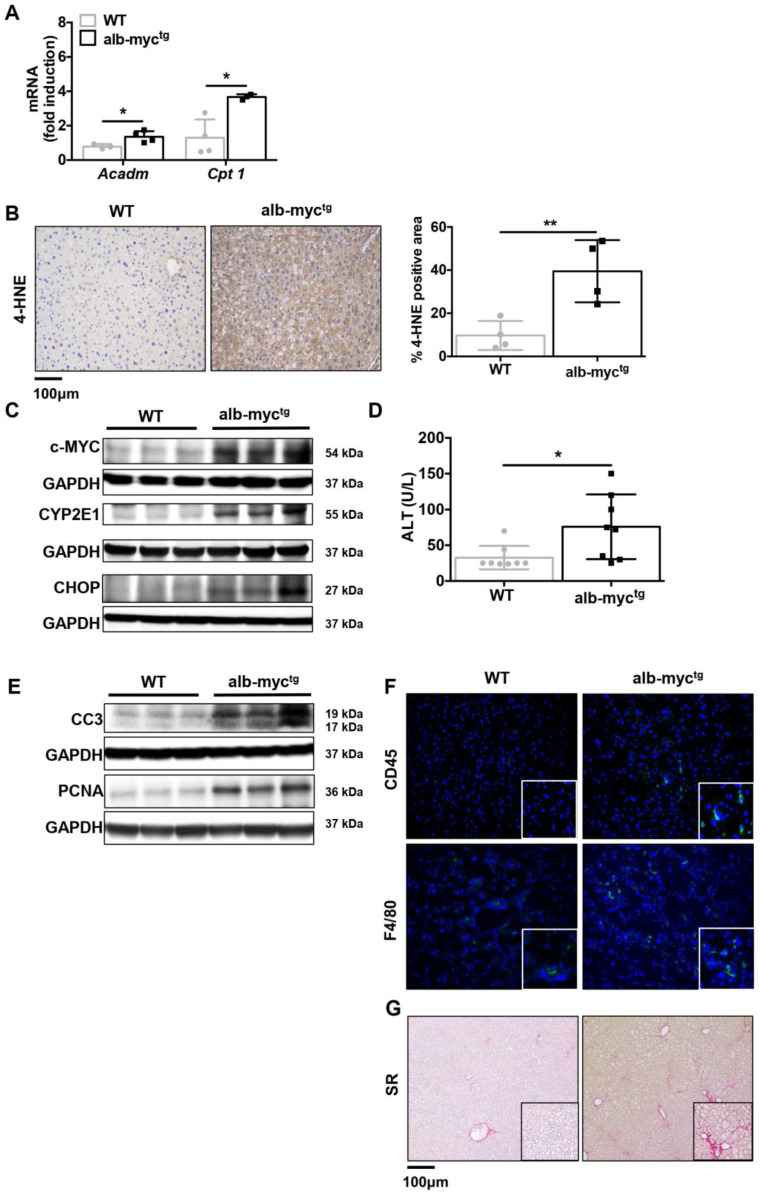
Methods: alb-myctg mice were studied at baseline conditions and after administration of Western diet (WD) in comparison to WT littermates. c-MYC expression was analyzed in biopsies of patients with MAFLD and MAFLD-associated HCC by immunohistochemistry.

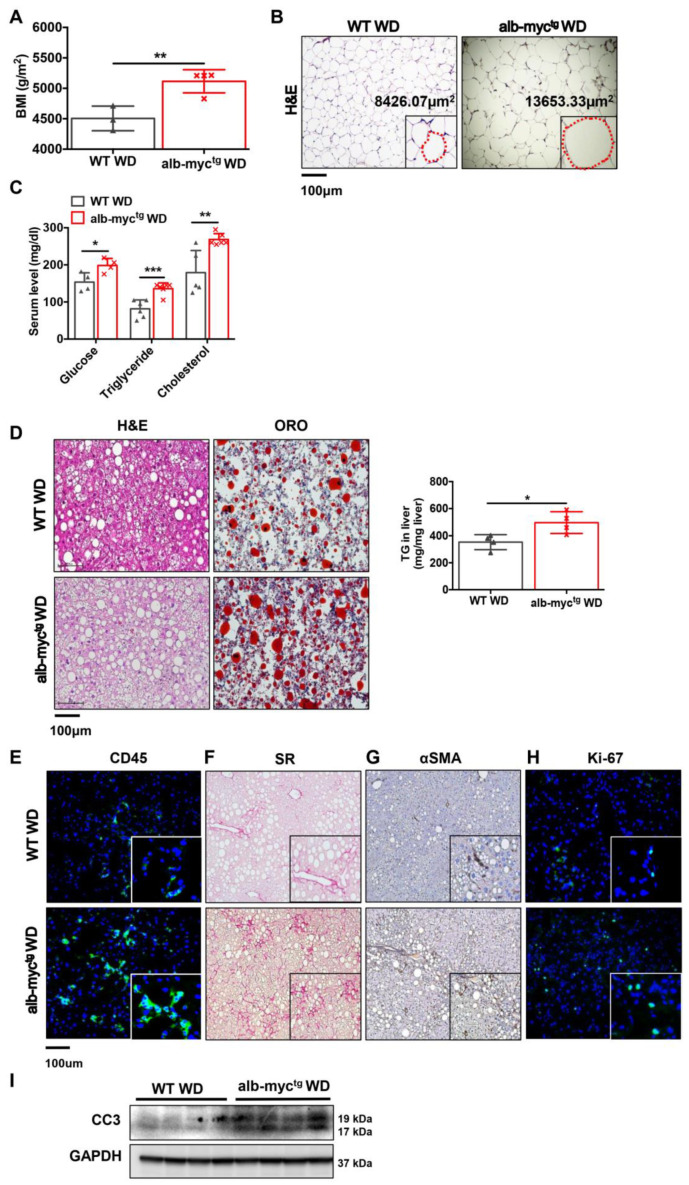
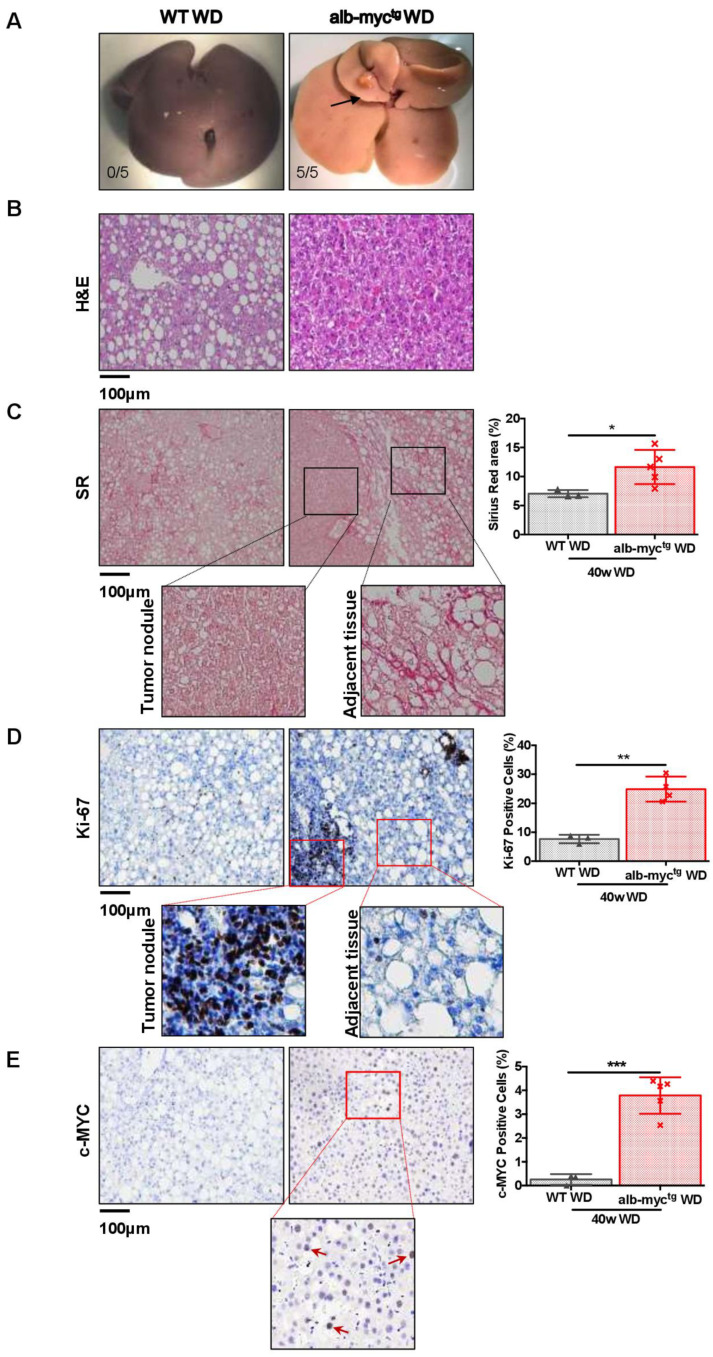
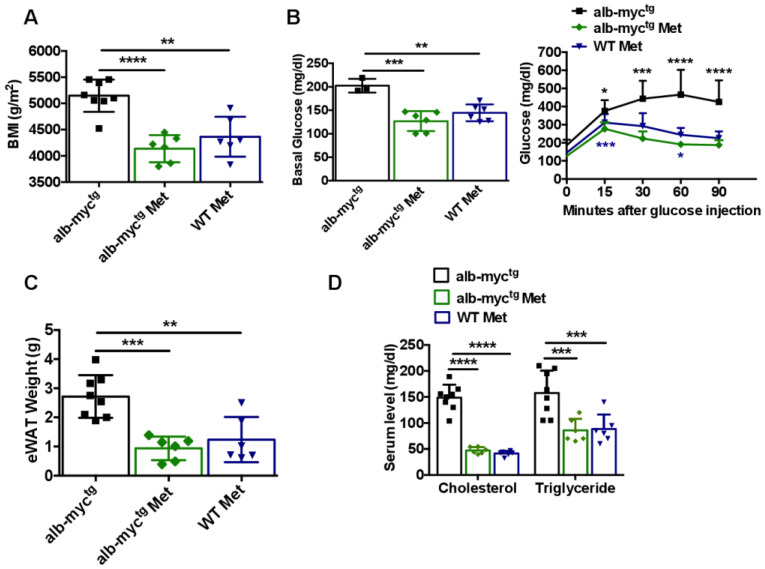
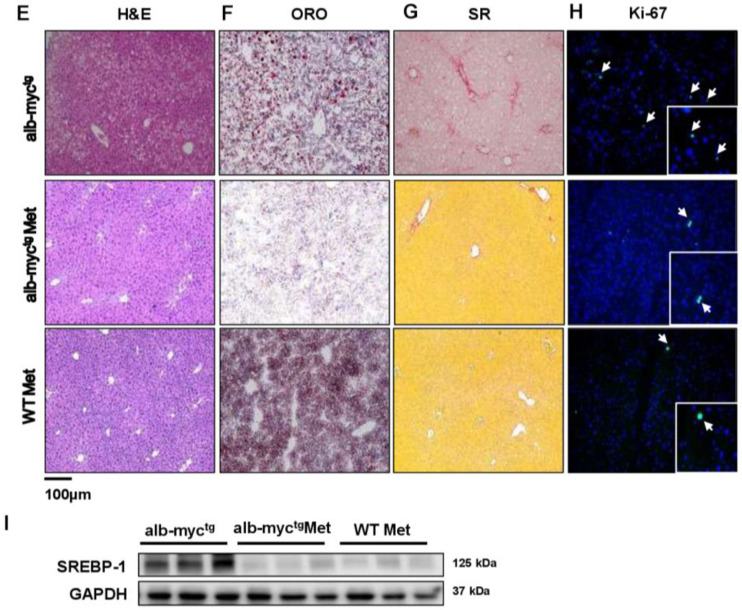
Results: Mild obesity, spontaneous hyperlipidaemia, glucose intolerance and insulin resistance were characteristic of 36-week-old alb-myctg mice. Middle-aged alb-myctg exhibited liver steatosis and increased triglyceride content. Liver injury and inflammation were associated with elevated ALT, an upregulation of ER-stress response and increased ROS production, collagen deposition and compensatory proliferation. At 52 weeks, 20% of transgenic mice developed HCC. WD feeding exacerbated metabolic abnormalities, steatohepatitis, fibrogenesis and tumor prevalence. Therapeutic use of metformin partly attenuated the spontaneous MAFLD phenotype of alb-myctg mice. Importantly, upregulation and nuclear localization of c-MYC were characteristic of patients with MAFLD and MAFLD-related HCC.

Conclusions: A novel function of c-MYC in MAFLD progression was identified opening new avenues for preventative strategies.

Keywords: c-myc; metabolic-associated fatty liver disease (MAFLD); metformin; oncogene; tumorigenesis.


Conflict of interest statement

The authors declare no conflict of interest.

Figures

Figure 1
Figure 1
High expression of c-MYC in patients with MAFLD and MAFLD-related HCC. (A) c-MYC nuclear expression inside tumor nodules and tumor-adjacent tissues in patients with MAFLD-related HCC (20× magnification). Black arrows indicate cells with positive nuclear c-MYC expression (B) Quantification of % c-MYC positive cells inside tumor nodules and tumor-adjacent tissues in patients with MAFLD-related HCC (n = 4). (C) c-MYC protein expression in MAFLD patients with advanced liver fibrosis (F3–F4), (20× magnification). Red arrows indicate cells with positive nuclear c-MYC expression. Data are expressed as the mean ± SD, * = p < 0.05, inside tumor nodules vs. tumor-adjacent tissues.
Figure 2
Figure 2
Metabolic profile of chow diet-fed alb-myctg mice at the age of 36 weeks. (A) Left: Growth curve demonstrating body weight gain, assessed at 7 days’ interval for each group. Right: The histogram represents the incremental area under the respective grow curve (n = 8–9). (B) Body mass index (BMI) (g/m2) (n = 8–9). (C) Weight of epididymal white adipose tissue (eWAT) (n = 8). (D) Size of eWAT cells by H&E staining. Scale bar = 100 µm. Size of individual cells from both groups was measured and average cell size (µm2) was quantified (n = 8–9). Asterisks indicate CLS. The dotted red line marks the individual adipocyte. (E) Levels of cholesterol and TG in serum (n = 8–9). (F) Basal glucose level in blood after 6 h fasting; Blood glucose concentration curve during intraperitoneal glucose tolerance test (n = 3). Data are expressed as the mean ± SD, * = p < 0.05; ** = p < 0.01, *** = p < 0.001, alb-myctg mice vs. WT controls.
Figure 3
Figure 3
Steatotic changes in the liver of transgenic mice. (A) Representative liver H&E staining demonstrating distended hepatocytes with foamy appearing cytoplasm and small lipid vesicles. Scale bar = 100 µm (n = 8–9). (B) Illustrative ORO staining. Scale bar = 100 µm. (C) Quantitative analysis of ORO-stained area (n = 5). (D) Direct TG quantification (n = 4). (E) Histology score for steatosis, hepatocyte ballooning, NAFLD activity score (NAS) (n = 5–6). Data are expressed as the mean ± SD, * = p < 0.05; ** = p < 0.01, alb-myctg mice vs. WT controls.
Figure 4
Figure 4
Transgenic overexpression of c-MYC in the livers leads to induction of ER stress, apoptosis, inflammation and fibrosis. (A) qPCR analysis of hepatic mRNA expression of Acadm and Cpt1 genes (n = 6). (B) 4-HNE expression (brown) of representative livers was evaluated by immunohistochemistry. Scale bar = 100 µm. The histogram represents the 4-HNE staining intensity (% square microns) (n = 4). (C) Immunoblot analysis of c-MYC, CYP2E1, CHOP (n = 3). Uncropped blots are presented in Figure S13. (D) Levels of ALT in serum (n = 8–9). (E) Protein expression of CC3 and PCNA (n = 3). GAPDH was used as a control for protein loading). Uncropped blots are presented in Figure S14. (F) Representative IF images of hepatic inflammation (CD45 and F4/80 positive cells are stained in green). (G) Sirius red (SR) staining of liver paraffin sections showing accelerated onset of fibrosis formation in alb-myctg. * = p < 0.05; ** = p < 0.01.
Figure 5
Figure 5
WD feeding accelerates liver injury in alb-myctg mice. WT (n = 6) and alb-myctg (n = 7) mice fed for 24 weeks with WD. (A) Body mass index (BMI) (g/m2) of mice was calculated at the age of 36 weeks (n = 3–4). (B) H&E staining of epididymal white adipose tissue (eWAT). The dotted red line marks the individual adipocyte. Scale bar = 100 µm. (C) Fasting blood glucose, levels of cholesterol and TG in serum (n = 6–8). (D) Representative liver sections stained with H&E and ORO are shown. Scale bar = 100 µm. Histogram showing TG quantification of mice fed WD (n = 4). (E) Representative images of hepatic inflammation (CD45 positive cells stained in green). (F,G) Liver fibrosis (SR and αSMA IHC staining). (H) Hepatic proliferation (Ki-67 positive cells in green). Scale bar = 100 µm. (I) Protein expression of cleaved caspase 3, GAPDH used as loading control (n = 3). Uncropped blots are presented in Figure S15. Data are expressed as the mean ± SD, * = p < 0.05, ** = p < 0.01, *** = p < 0.001, alb-myctg mice fed with WD compared to WT fed with WD.
Figure 6
Figure 6
WD feeding accelerates the initiation of MAFLD associated tumorigenesis in alb-myctg mice. WT (n = 3) and alb-myctg (n = 5) mice fed 40 weeks with WD. (A) Gross liver. Numbers represent tumor incidence. (B) Representative liver sections stained with H&E. (C) Representative liver sections stained with SR. Quantification of % SR positive area (n = 3–5) Scale bar = 100 µm. (D) Ki-67 immunostaining of paraffin sections showing increased cell proliferation (brown) of hepatocytes in alb-myctg mice liver. Quantification of Ki-67 positive cells (n = 3–5). Scale bar = 100 µm. (E) c-MYC IHC staining of paraffin sections. Quantification of c-MYC positive cells (n = 3–5). Scale bar = 100 µm. * = p < 0.05, ** = p < 0.01, *** = p < 0.001.
Figure 7
Figure 7
Improved hepatic phenotype in alb-myctg mice after metformin treatment. alb-myctg mice (n = 6) and WT mice (n = 6) fed 20 weeks received metformin enriched chow diet, alb-myctg (n = 8) received chow diet; all animals were sacrificed at the age of 36 weeks. (A) Body mass index (BMI) (g/m2) of mice at the age of 36 weeks (n = 3–6). (B) Basal glucose level after 6 h fasting. Blood glucose concentration curve during intraperitoneal GTT. (n = 3–6). (C) eWAT weight (n = 6–8). (D) Serum levels of cholesterol and TG in serum (n = 6–8). Representative liver sections stained with H&E (E), ORO (F), SR (G) and Ki-67 (H) stainings. Scale bar = 100 µm. (I) Protein expression of SREBP-1, GAPDH used as loading control (n = 3). Uncropped blots are presented in Figure S16. Data are expressed as the mean ± SD, * = p < 0.05, ** = p < 0.01, *** = p < 0.001, **** = p < 0.0001, alb-myctg mice fed metformin enriched chow diet vs. alb-myctg mice fed chow diet; ** = p < 0.01, *** = p < 0.001, **** = p < 0.0001, WT mice fed metformin enriched chow diet vs. alb-myctg mice fed chow diet.
Figure 7
Figure 7
Improved hepatic phenotype in alb-myctg mice after metformin treatment. alb-myctg mice (n = 6) and WT mice (n = 6) fed 20 weeks received metformin enriched chow diet, alb-myctg (n = 8) received chow diet; all animals were sacrificed at the age of 36 weeks. (A) Body mass index (BMI) (g/m2) of mice at the age of 36 weeks (n = 3–6). (B) Basal glucose level after 6 h fasting. Blood glucose concentration curve during intraperitoneal GTT. (n = 3–6). (C) eWAT weight (n = 6–8). (D) Serum levels of cholesterol and TG in serum (n = 6–8). Representative liver sections stained with H&E (E), ORO (F), SR (G) and Ki-67 (H) stainings. Scale bar = 100 µm. (I) Protein expression of SREBP-1, GAPDH used as loading control (n = 3). Uncropped blots are presented in Figure S16. Data are expressed as the mean ± SD, * = p < 0.05, ** = p < 0.01, *** = p < 0.001, **** = p < 0.0001, alb-myctg mice fed metformin enriched chow diet vs. alb-myctg mice fed chow diet; ** = p < 0.01, *** = p < 0.001, **** = p < 0.0001, WT mice fed metformin enriched chow diet vs. alb-myctg mice fed chow diet.

References

    1. Anstee Q.M., Reeves H.L., Kotsiliti E., Govaere O., Heikenwalder M. From nash to hcc: Current concepts and future challenges. Nat. Rev. Gastroenterol. Hepatol. 2019;16:411–428. doi: 10.1038/s41575-019-0145-7. - DOI - PubMed
    1. Pais R., Barritt A.S.t., Calmus Y., Scatton O., Runge T., Lebray P., Poynard T., Ratziu V., Conti F. Nafld and liver transplantation: Current burden and expected challenges. J. Hepatol. 2016;65:1245–1257. doi: 10.1016/j.jhep.2016.07.033. - DOI - PMC - PubMed
    1. Loomba R., Sanyal A.J. The global nafld epidemic. Nat. Rev. Gastroenterol. Hepatol. 2013;10:686–690. doi: 10.1038/nrgastro.2013.171. - DOI - PubMed
    1. Estes C., Razavi H., Loomba R., Younossi Z., Sanyal A.J. Modeling the epidemic of nonalcoholic fatty liver disease demonstrates an exponential increase in burden of disease. Hepatology. 2018;67:123–133. doi: 10.1002/hep.29466. - DOI - PMC - PubMed
    1. Estes C., Anstee Q.M., Arias-Loste M.T., Bantel H., Bellentani S., Caballeria J., Colombo M., Craxi A., Crespo J., Day C.P., et al. Modeling nafld disease burden in china, france, germany, italy, japan, spain, united kingdom, and united states for the period 2016–2030. J. Hepatol. 2018;69:896–904. doi: 10.1016/j.jhep.2018.05.036. - DOI - PubMed