Comparative Gene Expression Analysis Reveals Similarities and Differences of Chronic Myeloid Leukemia Phases
- PMID: 35008420
- PMCID: PMC8750437
- DOI: 10.3390/cancers14010256
Comparative Gene Expression Analysis Reveals Similarities and Differences of Chronic Myeloid Leukemia Phases
Abstract
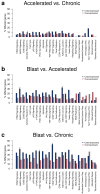
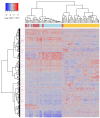
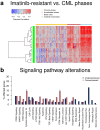
Chronic myeloid leukemia (CML) is a slowly progressing blood cancer that primarily affects elderly people. Without successful treatment, CML progressively develops from the chronic phase through the accelerated phase to the blast crisis, and ultimately to death. Nowadays, the availability of targeted tyrosine kinase inhibitor (TKI) therapies has led to long-term disease control for the vast majority of patients. Nevertheless, there are still patients that do not respond well enough to TKI therapies and available targeted therapies are also less efficient for patients in accelerated phase or blast crises. Thus, a more detailed characterization of molecular alterations that distinguish the different CML phases is still very important. We performed an in-depth bioinformatics analysis of publicly available gene expression profiles of the three CML phases. Pairwise comparisons revealed many differentially expressed genes that formed a characteristic gene expression signature, which clearly distinguished the three CML phases. Signaling pathway expression patterns were very similar between the three phases but differed strongly in the number of affected genes, which increased with the phase. Still, significant alterations of MAPK, VEGF, PI3K-Akt, adherens junction and cytokine receptor interaction signaling distinguished specific phases. Our study also suggests that one can consider the phase-wise CML development as a three rather than a two-step process. This is in accordance with the phase-specific expression behavior of 24 potential major regulators that we predicted by a network-based approach. Several of these genes are known to be involved in the accumulation of additional mutations, alterations of immune responses, deregulation of signaling pathways or may have an impact on treatment response and survival. Importantly, some of these genes have already been reported in relation to CML (e.g., AURKB, AZU1, HLA-B, HLA-DMB, PF4) and others have been found to play important roles in different leukemias (e.g., CDCA3, RPL18A, PRG3, TLX3). In addition, increased expression of BCL2 in the accelerated and blast phase indicates that venetoclax could be a potential treatment option. Moreover, a characteristic signaling pathway signature with increased expression of cytokine and ECM receptor interaction pathway genes distinguished imatinib-resistant patients from each individual CML phase. Overall, our comparative analysis contributes to an in-depth molecular characterization of similarities and differences of the CML phases and provides hints for the identification of patients that may not profit from an imatinib therapy, which could support the development of additional treatment strategies.
Keywords: accelerated phase; blast crisis; chronic myeloid leukemia (CML); chronic phase; comparative transcriptome analysis; computational cancer genomics.
Conflict of interest statement
The authors declare no conflict of interest.
Figures


Similar articles
-
Expression of LYN and PTEN genes in chronic myeloid leukemia and their importance in therapeutic strategy.Blood Cells Mol Dis. 2014 Feb-Mar;52(2-3):121-5. doi: 10.1016/j.bcmd.2013.09.002. Epub 2013 Oct 3. Blood Cells Mol Dis. 2014. PMID: 24091144
-
U.S. Food and Drug Administration Drug Approval Summary: conversion of imatinib mesylate (STI571; Gleevec) tablets from accelerated approval to full approval.Clin Cancer Res. 2005 Jan 1;11(1):12-9. Clin Cancer Res. 2005. PMID: 15671523 Clinical Trial.
-
Prognostic factors and survival outcomes in patients with chronic myeloid leukemia in blast phase in the tyrosine kinase inhibitor era: Cohort study of 477 patients.Cancer. 2017 Nov 15;123(22):4391-4402. doi: 10.1002/cncr.30864. Epub 2017 Jul 25. Cancer. 2017. PMID: 28743165 Free PMC article.
-
Molecular and cellular bases of chronic myeloid leukemia.Protein Cell. 2010 Feb;1(2):124-32. doi: 10.1007/s13238-010-0016-z. Epub 2010 Feb 6. Protein Cell. 2010. PMID: 21203982 Free PMC article. Review.
-
Imatinib: a review of its use in chronic myeloid leukaemia.Drugs. 2007;67(2):299-320. doi: 10.2165/00003495-200767020-00010. Drugs. 2007. PMID: 17284091 Review.
Cited by
-
MicroRNAs as prognostic and predictive biomarkers among chronic myeloid leukemia patients in Addis Ababa, Ethiopia.Sci Rep. 2025 Aug 29;15(1):31844. doi: 10.1038/s41598-025-17371-w. Sci Rep. 2025. PMID: 40883483
-
Defining Higher-Risk Chronic Myeloid Leukemia: Risk Scores, Genomic Landscape, and Prognostication.Curr Hematol Malig Rep. 2022 Dec;17(6):171-180. doi: 10.1007/s11899-022-00668-2. Epub 2022 Aug 6. Curr Hematol Malig Rep. 2022. PMID: 35932396 Free PMC article. Review.
-
Targeted Next-Generation Sequencing Identifies Additional Mutations Other than BCR∷ABL in Chronic Myeloid Leukemia Patients: A Chinese Monocentric Retrospective Study.Cancers (Basel). 2022 Nov 23;14(23):5752. doi: 10.3390/cancers14235752. Cancers (Basel). 2022. PMID: 36497234 Free PMC article.
-
Critical Requirement of SOS1 for Development of BCR/ABL-Driven Chronic Myelogenous Leukemia.Cancers (Basel). 2022 Aug 11;14(16):3893. doi: 10.3390/cancers14163893. Cancers (Basel). 2022. PMID: 36010887 Free PMC article.
-
Computational gene expression analysis reveals distinct molecular subgroups of T-cell prolymphocytic leukemia.PLoS One. 2022 Sep 21;17(9):e0274463. doi: 10.1371/journal.pone.0274463. eCollection 2022. PLoS One. 2022. PMID: 36129940 Free PMC article.
References
-
- Druker B.J., Talpaz M., Resta D.J., Peng B., Buchdunger E., Ford J.M., Lydon N.B., Kantarjian H., Capdeville R., Ohno-Jones S., et al. Efficacy and safety of a specific inhibitor of the BCR-ABL tyrosine kinase in chronic myeloid leukemia. N. Engl. J. Med. 2001;344:1031–1037. doi: 10.1056/NEJM200104053441401. - DOI - PubMed
-
- Kantarjian H., O’Brien S., Jabbour E., Garcia-Manero G., Quintas-Cardama A., Shan J., Rios M.B., Ravandi F., Faderl S., Kadia T., et al. Improved survival in chronic myeloid leukemia since the introduction of imatinib therapy: A single-institution historical experience. Blood. 2012;119:1981–1987. doi: 10.1182/blood-2011-08-358135. - DOI - PMC - PubMed
LinkOut - more resources
Full Text Sources
Research Materials
Miscellaneous

