. 2021 Dec 22;23(1):75.
doi: 10.3390/ijms23010075.

Reciprocal Homer1a and Homer2 Isoform Expression Is a Key Mechanism for Muscle Soleus Atrophy in Spaceflown Mice

Affiliations

Reciprocal Homer1a and Homer2 Isoform Expression Is a Key Mechanism for Muscle Soleus Atrophy in Spaceflown Mice

Dieter Blottner et al. Int J Mol Sci. .

Abstract

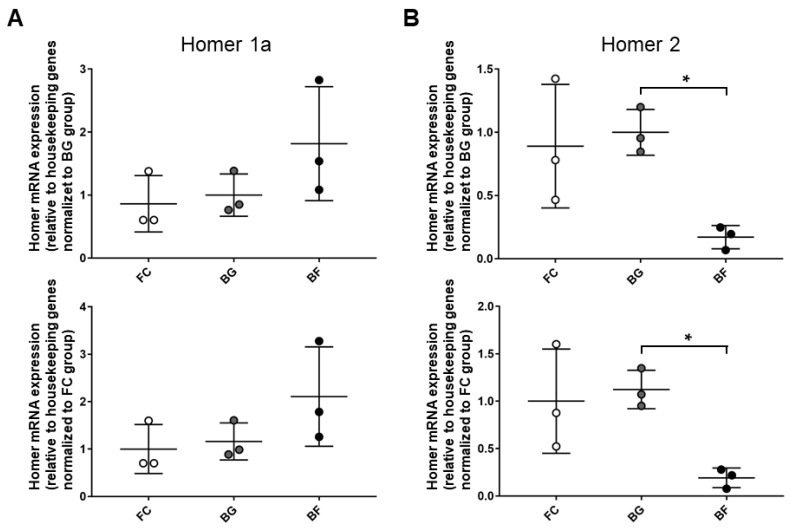
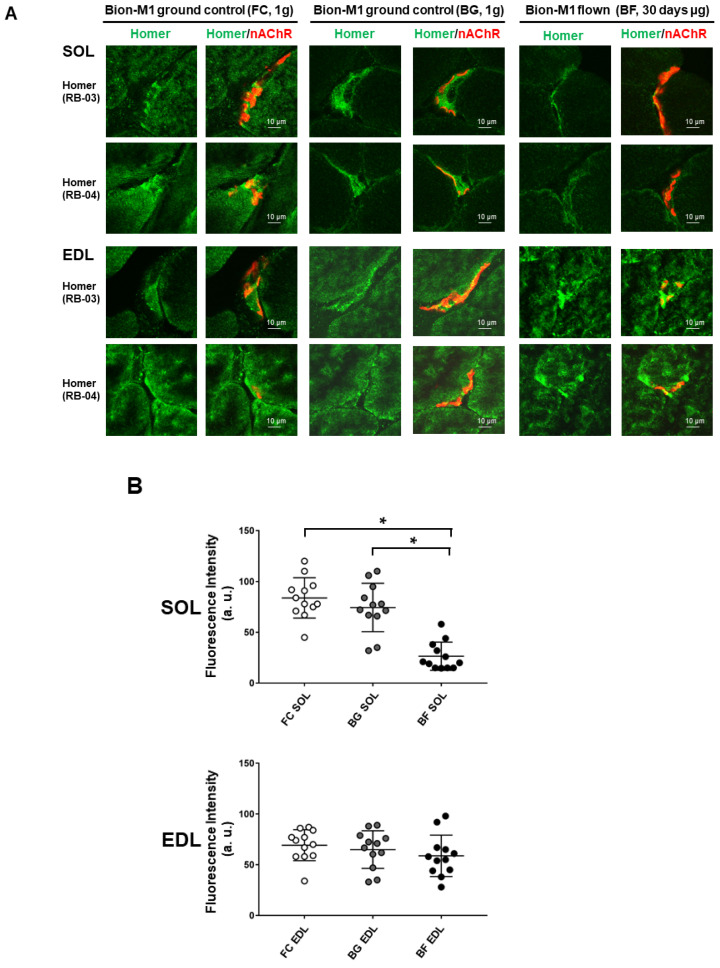
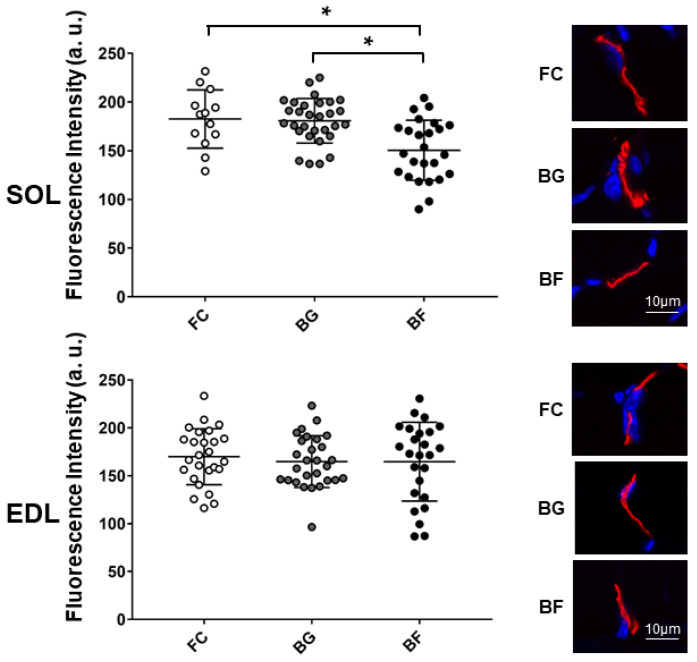
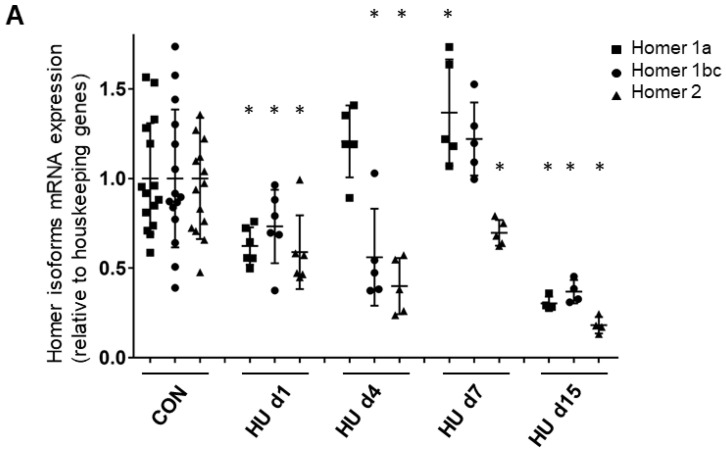
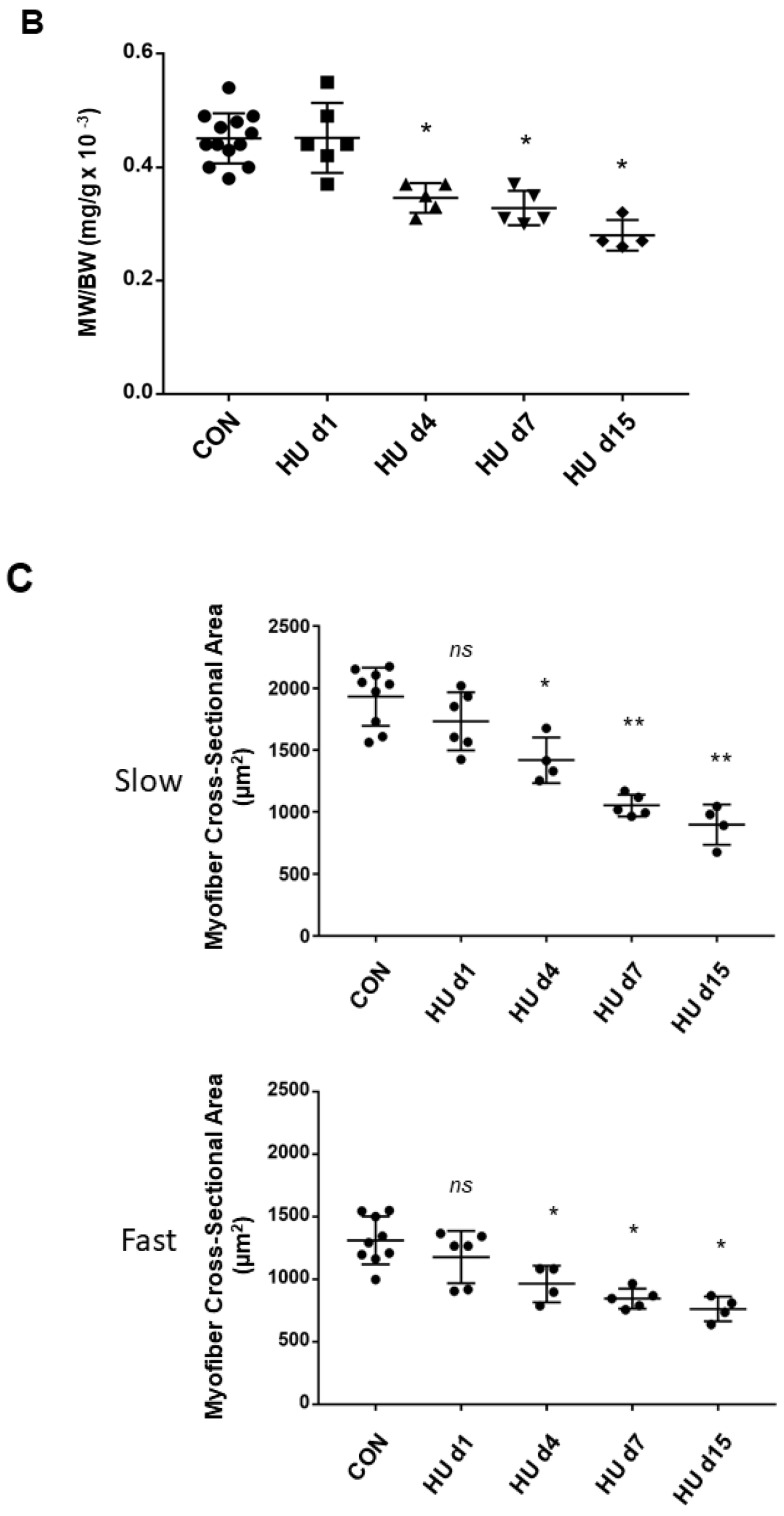
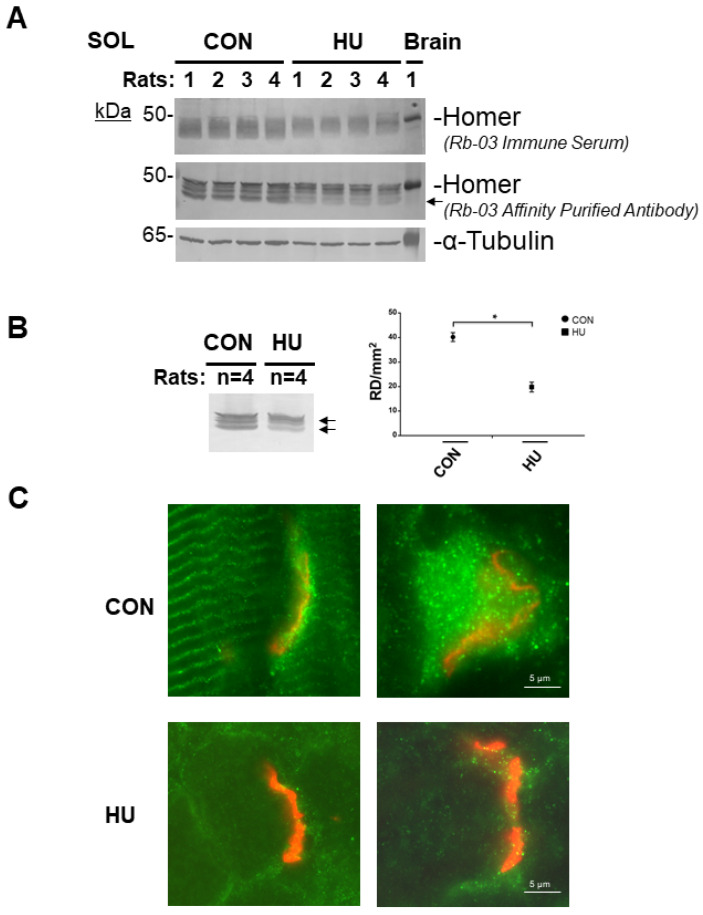
The molecular mechanisms of skeletal muscle atrophy under extended periods of either disuse or microgravity are not yet fully understood. The transition of Homer isoforms may play a key role during neuromuscular junction (NMJ) imbalance/plasticity in space. Here, we investigated the expression pattern of Homer short and long isoforms by gene array, qPCR, biochemistry, and laser confocal microscopy in skeletal muscles from male C57Bl/N6 mice (n = 5) housed for 30 days in space (Bion-flight = BF) compared to muscles from Bion biosatellite on the ground-housed animals (Bion ground = BG) and from standard cage housed animals (Flight control = FC). A comparison study was carried out with muscles of rats subjected to hindlimb unloading (HU). Gene array and qPCR results showed an increase in Homer1a transcripts, the short dominant negative isoform, in soleus (SOL) muscle after 30 days in microgravity, whereas it was only transiently increased after four days of HU. Conversely, Homer2 long-form was downregulated in SOL muscle in both models. Homer immunofluorescence intensity analysis at the NMJ of BF and HU animals showed comparable outcomes in SOL but not in the extensor digitorum longus (EDL) muscle. Reduced Homer crosslinking at the NMJ consequent to increased Homer1a and/or reduced Homer2 may contribute to muscle-type specific atrophy resulting from microgravity and HU disuse suggesting mutual mechanisms.

Keywords: Homer isoform switch; NMJ adaptation; hindlimb unloading; microgravity; muscle atrophy.


Conflict of interest statement

The authors declare no conflict of interest. The sponsors had no role in the design, execution, interpretation, or writing of the study.

Figures

Figure 1
Figure 1
Homer1a and Homer2 genes are differentially regulated in SOL muscle of Bion-M1 flown mice. Results qPCR data analysis. (A) An increased, albeit not statistically significant, value of Homer1a mRNA expression was observed in SOL muscle of BF vs. BG (61.5%; p ≤ 0.789) and BF vs. FC (110%; p ≤ 0.177). (B) A significant decrease in Homer2 mRNA expression was observed in SOL muscle of BF vs. BG (−84%; p ≤ 0.021) and BF vs. FC (−81%; p ≤ 0.0664). mRNA levels were normalized to housekeeping genes by the delta Ct method and then normalized to CON (BG upper panel and FC lower panel), which was arbitrarily set to 1. Data are expressed as means ± SE. For each experimental group, n = 3 male C57BL/N6 mice (19–20 weeks old). Statistical differences between groups were determined by an unpaired t-test. * = indicates significant difference vs. CON (ANOVA p < 0.001).
Figure 2
Figure 2
Confocal analysis of Homer immunostaining at the NMJ of SOL and EDL muscles in Bion-M1 flown mice (BF) vs. ground controls (FC and BG). (A) A reduction in Homer immunofluorescence signal adjacent to α-BTX stained nAChRs (NMJ postsynaptic microdomain) was observed in Bion-M1 flown mice compared to the Bion-M1 ground controls in SOL but not in EDL muscle. (B) Quantification of Homer immunofluorescence intensity at the NMJ of SOL (upper panel) and EDL (lower panel) muscles in Bion-M1 flown mice vs. ground controls. A significant decrease in Homer fluorescence intensity was detected in SOL of BF (p ≤ 0.001) but not in EDL muscle compared to ground controls BG and FC. Data are expressed as means ± SE. For each experimental group n = 2 male C57BL/N6 mice (19–20 weeks old). Statistical differences between groups were determined by an unpaired t-test. * = indicates significant difference vs. CON (ANOVA p < 0.001).
Figure 3
Figure 3
Confocal fluorescence intensity analysis of junctional nAChRs in SOL and EDL muscles of Bion-M1 flown (BF) vs. two Bion-M1 ground controls mice (FC, BG). A significant decrease in pixel fluorescence intensity was measured in SOL muscle (upper panel) of Bion-M1 flown mice (BF vs. BG, p ≤ 0.001; BF vs. FC, p ≤ 0.004) but not of EDL muscle (lower panel) (BF vs. BG, p ≤ 0.8929; BF vs. FC, p ≤ 0.6051) compared to the BG and FC muscle controls. Upper (SOL) and lower (EDL) graph, representative images of α-BTX stained nAChRs in BG, BF, and FC groups. No differences were observed between BG and FC control muscles. Data are expressed as means ± SE. For each experimental group n = 2 male C57BL/N6 mice (19–20 weeks old). Statistical differences between groups were determined by unpaired t-test. * = indicates significant difference vs. CON (ANOVA p < 0.001).
Figure 4
Figure 4
Time course of Homer 1a, 1b/c, and 2 isoform expression and morphometry analysis in rat SOL muscle. (A) Real-time qPCR analysis of ambulant CON vs. HU. A decrease in all Homer isoform transcripts was observed after 1 day of HU, which continued to decrease after 2 weeks: Homer1a −70% (p ≤ 0.0038), Homer1b,c −63,2% (p ≤ 0.0052), Homer2 −82% (p ≤ 0.0002). Only between day 4 and day 7, there was a transient increase in Homer1a isoform + 37% (p ≤ 0.032), but not of Homer1b,c + 22.1% (p ≤ 0.2417) compared to the CON group. mRNA levels were normalized to peptidylprolyl isomerase a (PPIA) gene (also known as cyclophilin A) by the delta Ct method and then normalized to CON samples, which were arbitrarily set to 1. The number of animals analyzed (6-week-old Wistar rats) was 15 for the ambulant group (CON) and 20 for the HU group. The HU animals analyzed for each experimental time point were 6 (day 1 HU, HU d1), 5 (day 4 HU, HU d4), 5 (day 7 HU, HU d7), 4 (day 15 HU, HU d15). (B) SOL muscle weight (MW)/body weight (BW) ratio. Compared to CON animals, there was a significant decrease of 25% after 4–7 days and 40% at day 15 of HU in female Wistar rats. These data showed that muscle mass decreased significantly from day 4 (ANOVA p < 0.001). A further significant reduction in SOL mass was observed between HU d7 and HU d15 groups (p = 0.04). The number of animals analyzed (6-week-old Wistar rats) was 13 for the ambulant group (CON) and 19 for the HU group. The HU animals analyzed for each experimental time point were 6 (day 1 HU, HU d1), 4 (day 4 HU, HU d4), 5 (day 7 HU, HU d7), 4 (day 15 HU, HU d15). (C) SOL slow (upper panel) and fast (lower panel) type myofiber CSA. Compared to CON animals, there was a significant decrease of −26.6% after 4 days, −45.55% after 7 days, and −53.53% after day 15 in slow, and a significant decrease of −26.5% after 4 days, −35.52% after 7 days, and −41.76% at day 15 in fast type myofibers of HU female Wistar rats. The number of animals analyzed (6-week-old Wistar rats) was 9 for the ambulant group (CON) and 19 for the HU group. The HU animals analyzed for each experimental time point were 6 (day 1 HU, HU d1), 4 (day 4 HU, HU d4), 5 (day 7 HU, HU d7), 4 (day 15 HU, HU d15). Each dot corresponds to the average CSA values calculated on 100 myofibers from two photographic fields for each muscle. * = indicates significant difference vs. CON (ANOVA p ≤ 0.001); ** = indicates significant difference vs. CON and HU day 1 and days 4 (ANOVA p ≤ 0.001).
Figure 4
Figure 4
Time course of Homer 1a, 1b/c, and 2 isoform expression and morphometry analysis in rat SOL muscle. (A) Real-time qPCR analysis of ambulant CON vs. HU. A decrease in all Homer isoform transcripts was observed after 1 day of HU, which continued to decrease after 2 weeks: Homer1a −70% (p ≤ 0.0038), Homer1b,c −63,2% (p ≤ 0.0052), Homer2 −82% (p ≤ 0.0002). Only between day 4 and day 7, there was a transient increase in Homer1a isoform + 37% (p ≤ 0.032), but not of Homer1b,c + 22.1% (p ≤ 0.2417) compared to the CON group. mRNA levels were normalized to peptidylprolyl isomerase a (PPIA) gene (also known as cyclophilin A) by the delta Ct method and then normalized to CON samples, which were arbitrarily set to 1. The number of animals analyzed (6-week-old Wistar rats) was 15 for the ambulant group (CON) and 20 for the HU group. The HU animals analyzed for each experimental time point were 6 (day 1 HU, HU d1), 5 (day 4 HU, HU d4), 5 (day 7 HU, HU d7), 4 (day 15 HU, HU d15). (B) SOL muscle weight (MW)/body weight (BW) ratio. Compared to CON animals, there was a significant decrease of 25% after 4–7 days and 40% at day 15 of HU in female Wistar rats. These data showed that muscle mass decreased significantly from day 4 (ANOVA p < 0.001). A further significant reduction in SOL mass was observed between HU d7 and HU d15 groups (p = 0.04). The number of animals analyzed (6-week-old Wistar rats) was 13 for the ambulant group (CON) and 19 for the HU group. The HU animals analyzed for each experimental time point were 6 (day 1 HU, HU d1), 4 (day 4 HU, HU d4), 5 (day 7 HU, HU d7), 4 (day 15 HU, HU d15). (C) SOL slow (upper panel) and fast (lower panel) type myofiber CSA. Compared to CON animals, there was a significant decrease of −26.6% after 4 days, −45.55% after 7 days, and −53.53% after day 15 in slow, and a significant decrease of −26.5% after 4 days, −35.52% after 7 days, and −41.76% at day 15 in fast type myofibers of HU female Wistar rats. The number of animals analyzed (6-week-old Wistar rats) was 9 for the ambulant group (CON) and 19 for the HU group. The HU animals analyzed for each experimental time point were 6 (day 1 HU, HU d1), 4 (day 4 HU, HU d4), 5 (day 7 HU, HU d7), 4 (day 15 HU, HU d15). Each dot corresponds to the average CSA values calculated on 100 myofibers from two photographic fields for each muscle. * = indicates significant difference vs. CON (ANOVA p ≤ 0.001); ** = indicates significant difference vs. CON and HU day 1 and days 4 (ANOVA p ≤ 0.001).
Figure 5
Figure 5
Homer protein expression analysis in rat SOL muscle after 3 weeks of HU. (A). Western blot analysis of individual SOL muscle from ambulant (CON, n = 4) and hind limb suspended 8-week-old female Sprague Dawley rats (HU, n = 4). In reducing experimental conditions, anti-Homer antibodies identified several immunoreactive bands with an apparent molecular weight of 45 to 48 kDa; Homer predicted molecular weight. Brain was used as Homer protein positive control. α-tubulin (lower panel) was used as protein loading control. (B). Left panel, Western blot analysis of pooled female Sprague Dawley rat SOL muscles from each experimental group. Right panel, Homer Densitometry (Reflexive Density, RD) analysis. Compared to CON, in HU group, after three weeks of unloading, there was approx. a 50% decrease in Homer total proteins (arrows). (C). Homer immuno-epifluorescence analysis of female Sprague Dawley rat SOL NMJ of CON vs. HU. Representative merged images double-staining experiments with anti-Homer antibodies (green) and α-BTX (red) on longitudinal sections. Homer fluorescence immunoreactivity observed surrounding α-BTX-positive areas (NMJ postsynaptic microdomain) was less evident in 3-weeks HU compared to CON. In B, data are expressed as means ± SE. Statistical differences between groups were determined by unpaired t-test. * = indicates significant difference vs. CON (ANOVA p < 0.001).
Figure 6
Figure 6
homer2−/− genotyping and Homer confocal analysis in SOL muscle of WT and Homer2−/− mice. (A). Agarose gel amplified cDNA fragment in WT and homer2−/− male C57BL/N6 mice (19–20-week-old). As expected, a band of 321bp was detected in wild-type mice using a combination of primers 147 and 148 (WT), and a band around 432bp was detected in homer2−/− mice using primers 147 and 149 (KO). (B). Representative merged images of double staining experiments carried out with anti-Homer antibodies (green) and α-BTX (red) on SOL muscle longitudinal sections of WT and homer2−/− male C57BL/N6 mice. Homer fluorescence immunoreactivity observed surrounding α-BTX-positive areas (NMJ postsynaptic microdomain) of WT mice was not detected in homer2−/−mice. No differences were observed at the Z-disc/costamere level (cross-striated immunofluorescence pattern) between WT and homer2−/− mice.

Similar articles

Cited by

References

    1. Parry S.M., Puthucheary Z.A. The impact of extended bed rest on the musculoskeletal system in the critical care environment. Extrem Physiol. Med. 2015;4:16. doi: 10.1186/s13728-015-0036-7. - DOI - PMC - PubMed
    1. Baehr L.M., West D.W., Marcotte G., Marshall A.G., De Sousa L.G., Baar K., Bodine S.C. Age-related deficits in skeletal muscle recovery following disuse are associated with neuromuscular junction instability and ER stress, not impaired protein synthesis. Aging. 2016;8:127–146. doi: 10.18632/aging.100879. - DOI - PMC - PubMed
    1. Gonzalez-Freire M., de Cabo R., Studenski S.A., Ferrucci L. The Neuromuscular Junction: Aging at the Crossroad between Nerves and Muscle. Front. Aging Neurosci. 2014;6:208. doi: 10.3389/fnagi.2014.00208. - DOI - PMC - PubMed
    1. Van der Pijl E.M., van Putten M., Niks E.H., Verschuuren J.J., Aartsma-Rus A., Plomp J.J. Characterization of neuromuscular synapse function abnormalities in multiple Duchenne muscular dystrophy mouse models. Eur. J. Neurosci. 2016;43:1623–1635. doi: 10.1111/ejn.13249. - DOI - PubMed
    1. Edgerton V.R., Roy R.R. Neuromuscular adaptation to actual and simulated weightlessness. Adv. Space Biol. Med. 1994;4:33–67. - PubMed