. 2021 Dec 27;23(1):246.
doi: 10.3390/ijms23010246.

Integration of Small RNA and Degradome Sequencing Reveals the Regulatory Network of Al-Induced Programmed Cell Death in Peanut

Affiliations

Integration of Small RNA and Degradome Sequencing Reveals the Regulatory Network of Al-Induced Programmed Cell Death in Peanut

Bin Tong et al. Int J Mol Sci. .

Abstract

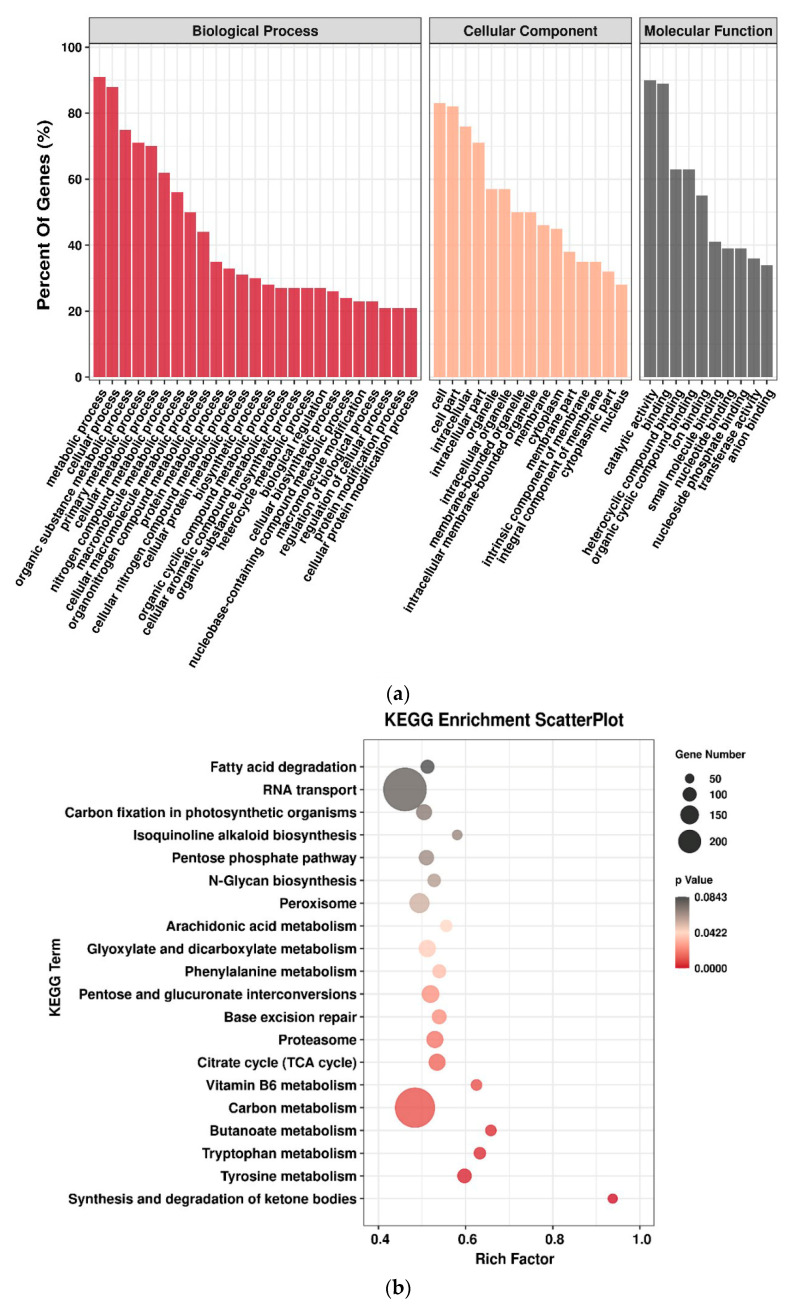
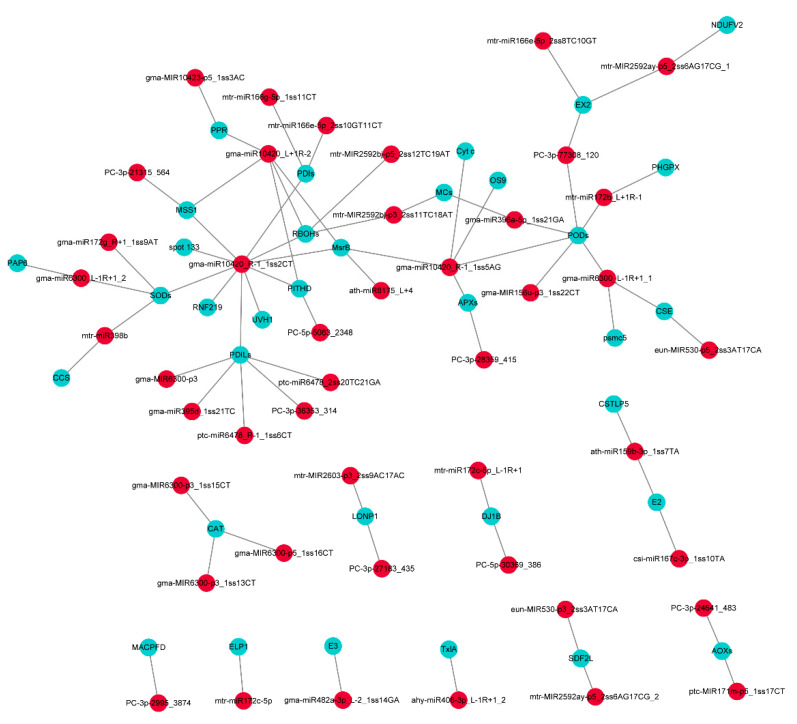
Peanut is one of the most important oil crops in the world. In China, the peanut is highly produced in its southern part, in which the arable land is dominated by acid soil. At present, miRNAs have been identified in stress response, but their roles and mechanisms are not clear, and no miRNA studies have been found related to aluminum (Al)-induced programmed cell death (PCD). In the present study, transcriptomics, sRNAs, and degradome analysis in the root tips of two peanut cultivars ZH2 (Al-sensitive, S) and 99-1507 (Al-tolerant, T) were carried out. Here, we generated a comprehensive resource focused on identifying key regulatory miRNA-target circuits that regulate PCD under Al stress. Through deep sequencing, 2284 miRNAs were identified and 147 miRNAs were differentially expressed under Al stress. Furthermore, 19237 target genes of 749 miRNAs were validated by degradome sequencing. GO and KEGG analyses of differential miRNA targets showed that the pathways of synthesis and degradation of ketone bodies, citrate cycle (TCA cycle), and peroxisome were responded to Al stress. The combined analysis of the degradome data sets revealed 89 miRNA-mRNA interactions that may regulate PCD under Al stress. Ubiquitination may be involved in Al-induced PCD in peanut. The regulatory networks were constructed based on the differentially expressed miRNAs and their targets related to PCD. Our results will provide a useful platform to research on PCD induced by Al and new insights into the genetic engineering for plant stress response.

Keywords: aluminum stress; degradome; microRNAs; peanut; programmed cell death; regulatory network.


Conflict of interest statement

The authors declare no conflict of interest.

Figures

Figure 1
Figure 1
Length distribution and abundance of the sequences.
Figure 2
Figure 2
The four indicated groups of miRNAs identified from an incompatible interaction. The miRNA counts, the counts of miRNAs from miRBase. Expression level, low indicates <10, middle indicates >10, but less than average, high indicates over average. Hairpin length, pre-miRNA length.
Figure 3
Figure 3
Al-responsive miRNAs in peanut. Upset of differentially expressed genes in response to 99-1507 (a) and ZH2 (b). UpSetR visualizes intersections of sets as a matrix, in which the rows represent the sets and the columns represent their intersections. Refer to Conway, J.R. et al. [25] for legend description. The element query (red) selects classified as deletions.
Figure 4
Figure 4
The numbers and expression profiling of differentially expressed miRNAs in root tips of peanut. Hierarchical clustering of differentially expressed miRNAs in 99-1507 (a) and ZH2 (b) at three different Al treatment periods (0, 8, and 24 h). Red indicates upregulated miRNAs, while purple indicates downregulated miRNAs. The original expression values of the miRNAs were normalized using Z-score normalization. The absolute signal intensity ranges from −6.0 to +4.0, with corresponding color changes from purple to red. (c) The number of differentially expressed miRNAs under Al stress compared with the control.
Figure 5
Figure 5
Gene ontology classification (a) and KEGG pathway enrichment (b) of target genes for different miRNAs.
Figure 6
Figure 6
The miRNA-mediated regulatory networks responses to Al stress in peanut. Red circles represent the differentially expressed miRNAs, and blue circles represent the target genes of differentially expressed miRNAs. Abbreviations for target genes are listed in Table S7.
Figure 7
Figure 7
Relative expression results of miRNAs and their targets via qRT-PCR. U6 and actin were used as the internal references for miRNAs and mRNAs, respectively. The normalized miRNA levels and the FPKM values represent the expression level in RNA-seq of each sample, respectively. The expression level at 0 h in each sample was used as a reference state, which was set to 1, and fold change values were shown here.
Figure 7
Figure 7
Relative expression results of miRNAs and their targets via qRT-PCR. U6 and actin were used as the internal references for miRNAs and mRNAs, respectively. The normalized miRNA levels and the FPKM values represent the expression level in RNA-seq of each sample, respectively. The expression level at 0 h in each sample was used as a reference state, which was set to 1, and fold change values were shown here.
Figure 8
Figure 8
Expression correlation between miRNAs and their targets at six different durations of Al treatment. The thin and thick lines indicate miRNAs and accordingly targets abundance, respectively. To standardize RNA quantity for evaluating relative expression levels, U6 and actin were used as the internal reference genes of miRNAs and their targets, respectively. The expression level at 0 h in each sample was used as reference state, which was set to 1, and fold change values were shown here.
Figure 8
Figure 8
Expression correlation between miRNAs and their targets at six different durations of Al treatment. The thin and thick lines indicate miRNAs and accordingly targets abundance, respectively. To standardize RNA quantity for evaluating relative expression levels, U6 and actin were used as the internal reference genes of miRNAs and their targets, respectively. The expression level at 0 h in each sample was used as reference state, which was set to 1, and fold change values were shown here.
Figure 9
Figure 9
Proposed working model for PCD induced by Al. The sharp head represents promotion, whereas the flat head represents suppression. ROS: Reactive oxygen species; MPTP: Mitochondrial permeability transition pore; Cyt c: Cytochrome C; Caspases: Cysteinyl aspartate specific proteinase; PCD: Programmed cell death; numbers enclosed in circles in the figure represent: ①, oxidative stress; ②, endoplasmic reticulum stress; ③, programmed cell death regulation. For detailed explanation, see Table S7 and Figure 6.

Similar articles

Cited by

References

    1. Inostroza-Blancheteau C., Rengel Z., Alberdi M., de la Luz M.M., Aquea F., Arce-Johnson P., Reyes-Diaz M. Molecular and physiological strategies to increase aluminum resistance in plants. Mol. Biol. Rep. 2012;39:2069–2079. doi: 10.1007/s11033-011-0954-4. - DOI - PubMed
    1. Ma J.F., Ryan P.R., Delhaize E. Aluminium tolerance in plants and the complexing role of organic acids. Trends Plant Sci. 2001;6:273–278. doi: 10.1016/S1360-1385(01)01961-6. - DOI - PubMed
    1. Degenhardt J., Larsen P.B., Howell S.H., Kochian L.V. Aluminum resistance in the Arabidopsis mutant alr-104 is caused by an aluminum-induced increase in rhizosphere pH. Plant Physiol. 1998;117:19–27. doi: 10.1104/pp.117.1.19. - DOI - PMC - PubMed
    1. Horst W.J., Wang Y., Eticha D. The role of the root apoplast in aluminium-induced inhibition of root elongation and in aluminium resistance of plants: A review. Ann. Bot. 2010;106:185–197. doi: 10.1093/aob/mcq053. - DOI - PMC - PubMed
    1. Kochian L.V., Hoekenga O.A., Pineros M.A. How do crop plants tolerate acid soils? Mechanisms of aluminum tolerance and phosphorous efficiency. Annu. Rev. Plant Biol. 2004;55:459–493. doi: 10.1146/annurev.arplant.55.031903.141655. - DOI - PubMed

MeSH terms

LinkOut - more resources