. 2021 Dec 28;23(1):276.
doi: 10.3390/ijms23010276.

Genome-Wide Identification and Characterization of the Trehalose-6-phosphate Synthetase (TPS) Gene Family in Watermelon (Citrullus lanatus) and Their Transcriptional Responses to Salt Stress

Affiliations

Genome-Wide Identification and Characterization of the Trehalose-6-phosphate Synthetase (TPS) Gene Family in Watermelon (Citrullus lanatus) and Their Transcriptional Responses to Salt Stress

Gaopeng Yuan et al. Int J Mol Sci. .

Abstract

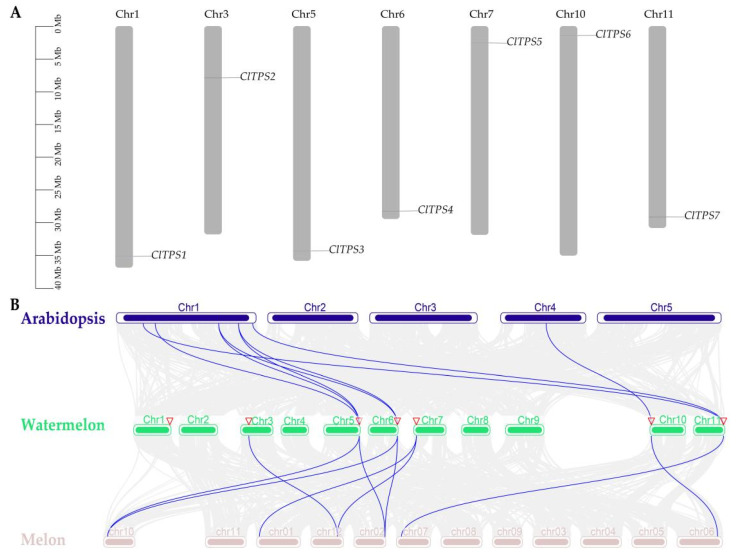
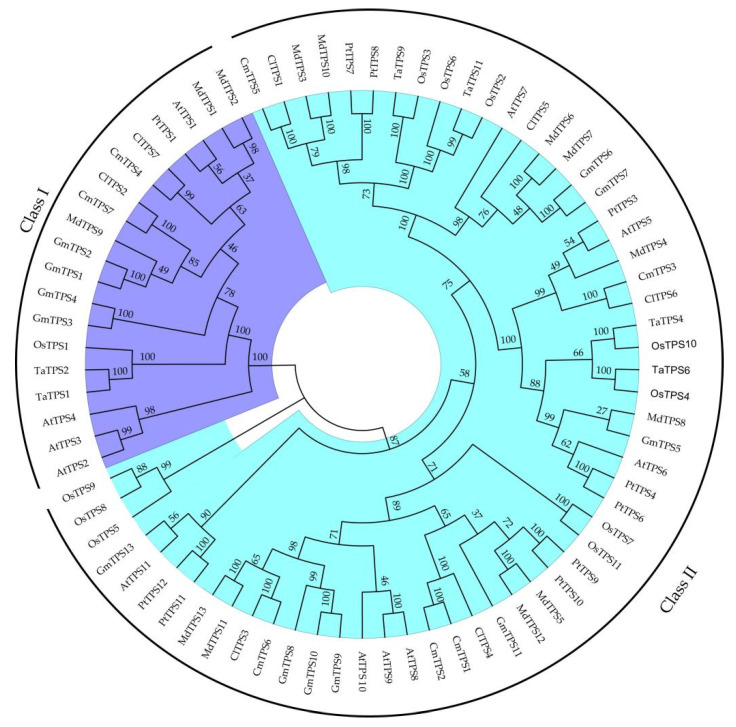
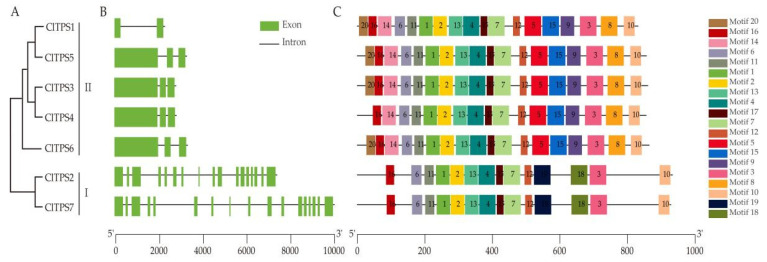
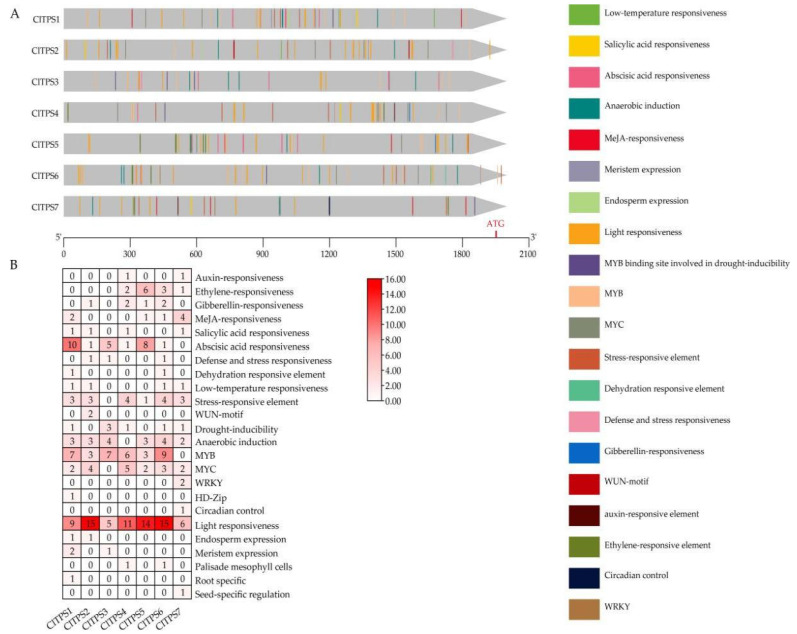
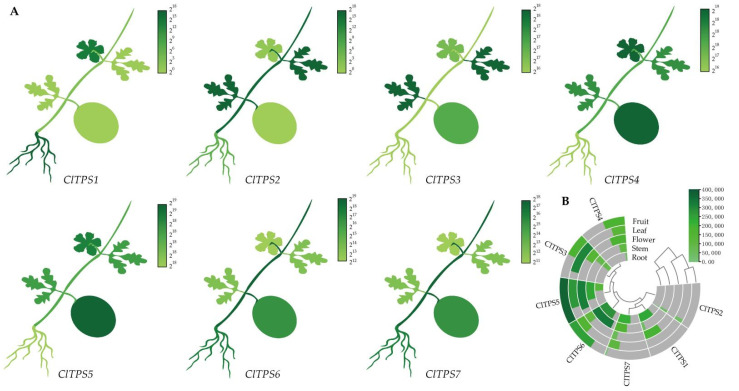
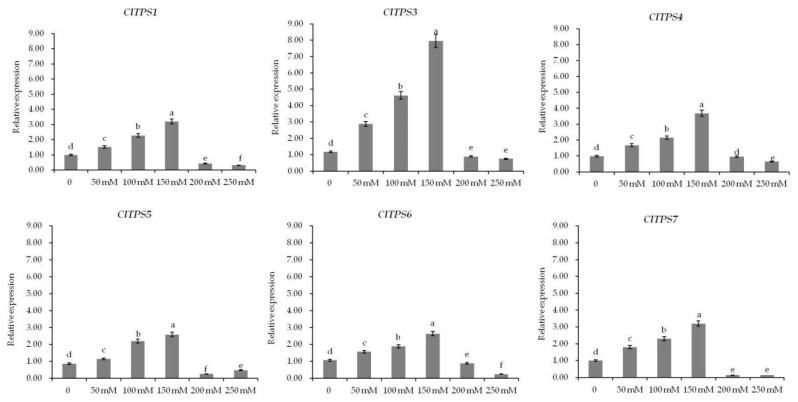
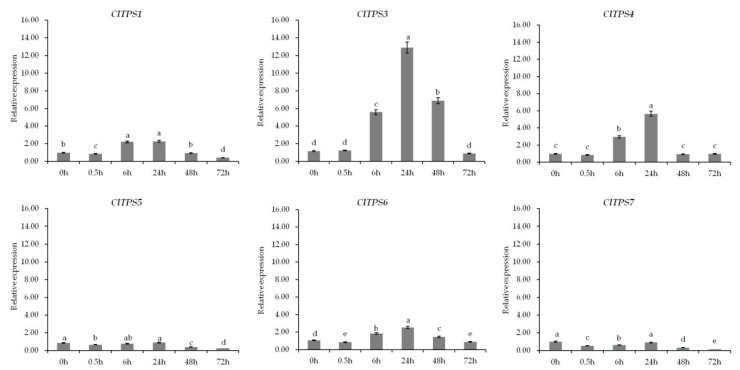
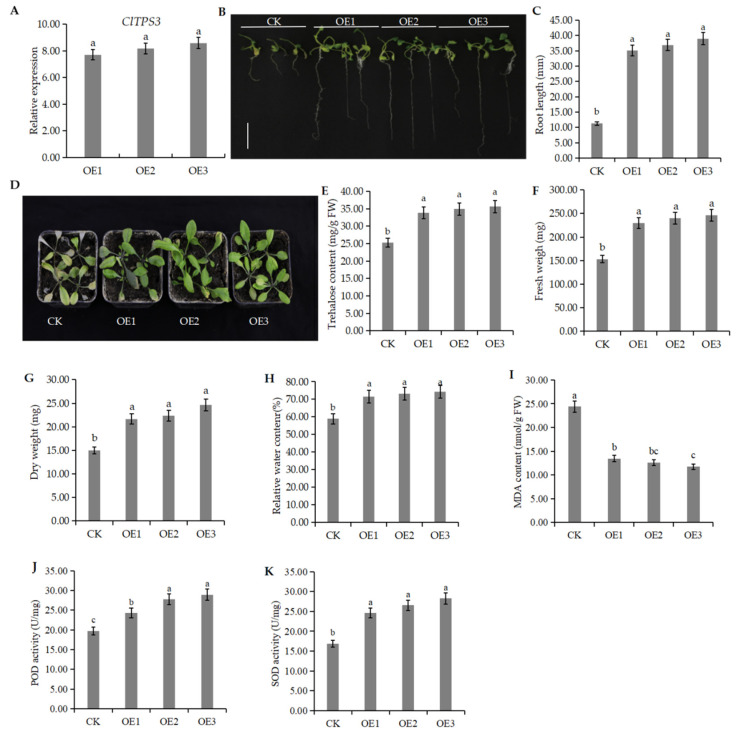
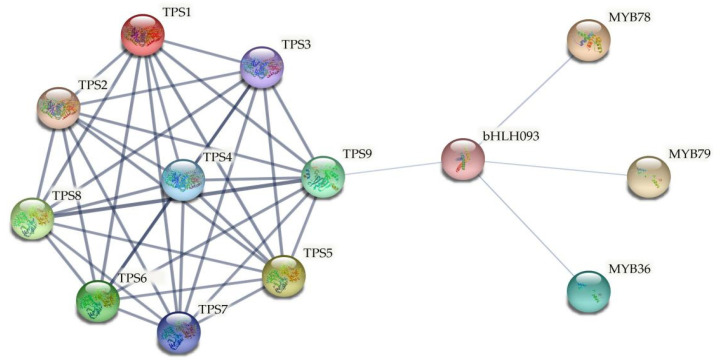
With the increase in watermelon cultivation area, there is an urgent need to explore enzymatic and genetic resources for the sustainable development of watermelon, especially under salt stress. Among the various compounds known, trehalose plays an important role in regulating abiotic stress tolerances in diverse organisms, including plants. Therefore, the present study comprehensively analyzed the trehalose-6-phosphate synthase (TPS) gene family in watermelon. The study analyzed the functional classification, evolutionary characteristics, and expression patterns of the watermelon TPS genes family. Seven ClTPSs were identified and classified into two distinct classes according to gene structure and phylogeny. Evolutionary analysis suggested the role of purifying selection in the evolution of the TPS family members. Further, cis-acting elements related to plant hormones and abiotic stress were identified in the promoter region of the TPS genes. The tissue-specific expression analysis showed that ClTPS genes were widely expressed in roots, stems, leaves, flowers, and fruits, while ClTPS3 was significantly induced under salt stress. The overexpression of ClTPS3 in Arabidopsis thaliana significantly improved salt tolerance. Finally, the STRING functional protein association networks suggested that the transcription factor ClMYB and ClbHLH regulate ClTPS3. Thus, the study indicates the critical role of ClTPS3 in watermelon response to salt stress.

Keywords: gene family; salt stress; trehalose-6-phosphate synthetase; watermelon.


Conflict of interest statement

The authors declare no conflict of interest.

Figures

Figure 1
Figure 1
Chromosomal location of ClTPS genes and collinearity analysis of A. thaliana, watermelon and melon. (A) Chromosomal location of ClTPS genes; (B) collinearity analysis of A. thaliana, watermelon and melon.
Figure 2
Figure 2
Phylogenetic relationship of TPS proteins among watermelon and other seven species. All TPS proteins were divided into two subgroups, represented by two colors. The green color represents Class I protein, and the blue color represents Class II protein. The phylogenetic tree was constructed by MEGA7 software with 1000 bootstrap replicates, following the neighbor-joining method.
Figure 3
Figure 3
Phylogenetic analysis, gene structure, and conserved motifs of ClTPSs. (A) Phylogenetic analysis of seven ClTPSs. (B) Exon/intron organization of ClTPSs. (C) Conserved motifs of ClTPSs.
Figure 4
Figure 4
Cis-acting elements of ClTPSs. (A) Kind, quantity and position of cis-acting elements in ClTPSs; (B) numbers of cis-acting elements.
Figure 5
Figure 5
Tissue-specific expression of ClTPSs. (A) The heatmap shown in the form of the whole plant. (B) The heatmap and cluster analysis of tissue-specific expression. The expression levels were derived from NCBI and visualized by TBtools; the dark green represents high expression level, and the light green represents low expression level.
Figure 6
Figure 6
Expression analysis of ClTPSs under different NaCl concentrations. ClTPS2 expression was not detected. Error bars indicate the SD of three biological replicates. Different letters indicate significant differences within treatments by ANOVA (p < 0.05).
Figure 7
Figure 7
Expression analysis of ClTPSs at different time points under 200 mM NaCl stress. ClTPS2 expression was not detected. Error bars indicate the SD of three biological replicates. Different letters indicated significant differences within treatments by ANOVA (p < 0.05).
Figure 8
Figure 8
Phenotypic analysis of ClTPS3 overexpressed A.thaliana plants. (A) The expression level of ClTPS3 in different A.thaliana lines. (B) The growth status of wild type and transgenic seedlings under 200 mM NaCl stress, the white scale range represents 1 cm. (C) The root length of different A.thaliana lines under 200 mM NaCl stress. (D) The growth status of different A.thaliana lines adult plant under 200 mM NaCl stress. (E) Trehalose content of different A.thaliana lines. (F) Fresh weight, (G) dry weight, (H) relative water content, (I) MDA content, (J) POD activity and (K) SOD activity of different A.thaliana lines under 200 mM NaCl stress. CK represents wild-type A. thaliana plants, and OE1, OE2, and OE3 are transgenic A. thaliana plants. Error bars indicate the SD of three biological replicates. Different letters indicate significant differences within treatments by ANOVA (p < 0.05).
Figure 9
Figure 9
Functional protein association networks using the TAIR accessions of MYB36 (At5g57620.1, ClMYB9, Cla97C01G017110.1); MYB78 (At5g49620.2, ClMYB69, Cla97C09G167270.1); MYB79 (At4g13480.1, ClMYB51, Cla97C05G084530.1); bHLH093 (At5g65640.1, ClbHLH93, Cla97C11G220830.1); AtTPS1 (At1g78580.1, ClTPS1, Cla97C11G223240.1); AtTPS2 (At1g16980.1, ClTPS7, Cla97C11G223240.1); AtTPS3 (At1g17000.1, ClTPS7, Cla97C11G223240.1); AtTPS4 (At4g27550.1, ClTPS7, Cla97C11G223240.1); AtTPS5 (At4g17770.1, ClTPS6, Cla97C10G186050.1); AtTPS6 (At1g68020.1, ClTPS6, Cla97C10G186050.1); AtTPS7 (At1g06410.1, ClTPS5, Cla97C07G130930.1); AtTPS8 (At1g70290.1, ClTPS3, Cla97C05G107320.1); AtTPS9 (At1g23870.1, ClTPS3, Cla97C05G107320.1). Blue lines represent gene interaction confidence (0 to 1); thick lines indicate confidence score higher than 0.85, while thin lines indicate confidence score between 0.26 and 0.84.

References

    1. Elbein A.D. New insights on trehalose: A multifunctional molecule. Glycobiology. 2003;13:17–27. doi: 10.1093/glycob/cwg047. - DOI - PubMed
    1. Feofilova E.P., Usov A.I., Mysyakina I.S., Kochkina G.A. Trehalose: Chemical structure, biological functions, and practical application. Microbiology. 2014;83:184–194. doi: 10.1134/S0026261714020064. - DOI - PubMed
    1. Wang Y.W., Quan S.J., Ma H., Liu D.H., Xie F.H. Review on the mechanism of trehalose protecting plant tissues and animal cells. Jiangsu Agric. Sci. 2019;47:14–18.
    1. Park M., Mitchell W.J., Rafii F. Effect of trehalose and trehalose transport on the tolerance of Clostridium perfringens to environmental stress in a wild type strain and its fluoroquinolone-resistant mutant. Int. J. Microbiol. 2016;48:29716. - PMC - PubMed
    1. Tian T., Gang Z., Dan H., Zhu K., Chen D., Zhang Z., Wei Z., Cao Y., Zhou P. Effects of vitrification cryopreservation on follicular morphology and stress relaxation behaviors of human ovarian tissues: Sucrose versus trehalose as the non-permeable protective agent. Hum. Reprod. 2015;30:877–883. doi: 10.1093/humrep/dev012. - DOI - PubMed

MeSH terms

LinkOut - more resources