. 2021 Dec 28;23(1):282.
doi: 10.3390/ijms23010282.

CRISPR/Cas9 Genome Editing vs. Over-Expression for Fluorescent Extracellular Vesicle-Labeling: A Quantitative Analysis

Affiliations

CRISPR/Cas9 Genome Editing vs. Over-Expression for Fluorescent Extracellular Vesicle-Labeling: A Quantitative Analysis

Karin Strohmeier et al. Int J Mol Sci. .

Abstract

Over-expression of fluorescently-labeled markers for extracellular vesicles is frequently used to visualize vesicle up-take and transport. EVs that are labeled by over-expression show considerable heterogeneity regarding the number of fluorophores on single particles, which could potentially bias tracking and up-take studies in favor of more strongly-labeled particles. To avoid the potential artefacts that are caused by over-expression, we developed a genome editing approach for the fluorescent labeling of the extracellular vesicle marker CD63 with green fluorescent protein using the CRISPR/Cas9 technology. Using single-molecule sensitive fluorescence microscopy, we quantitatively compared the degree of labeling of secreted small extracellular vesicles from conventional over-expression and the CRISPR/Cas9 approach with true single-particle measurements. With our analysis, we can demonstrate a larger fraction of single-GFP-labeled EVs in the EVs that were isolated from CRISPR/Cas9-modified cells (83%) compared to EVs that were isolated from GFP-CD63 over-expressing cells (36%). Despite only single-GFP-labeling, CRISPR-EVs can be detected and discriminated from auto-fluorescence after their up-take into cells. To demonstrate the flexibility of the CRISPR/Cas9 genome editing method, we fluorescently labeled EVs using the HaloTag® with lipid membrane permeable dye, JaneliaFluor® 646, which allowed us to perform 3D-localization microscopy of single EVs taken up by the cultured cells.

Keywords: CD63; CRISPR/Cas9; atomic force microscopy; extracellular vesicles; genome editing; single-molecule fluorescence microscopy; single-molecule labeling stoichiometry.


Conflict of interest statement

The authors declare no conflict of interest. The funders had no role in the design of the study; in the collection, analyses, or interpretation of data; in the writing of the manuscript; or in the decision to publish the results.

Figures
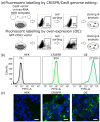
Figure 1
Figure 1
CRISPR/Cas9 approach and over-expression approach for fluorescent labeling of the EV marker CD63. (a) A schematic representation of the HEK293T cell transfections. The cells were either transfected with a Cas9 expression vector together with a guideRNA targeting exon 2 of CD63 and a homology-dependent repair (HDR) template encoding GFP in-frame with the CD63 coding sequence (upper panel) or with a vector encoding a GFP-CD63 fusion under the control of the CMV promoter (lower panel). After transfection, GFP fluorescence was detected in a subset of the cells, which were enriched by FACS sorting. In the next step, single-cell-derived clones were isolated and characterized by flow cytometry and immunofluorescence. (b) Flow cytometry analysis shows median fluorescence intensity (MFI) of GFP expression that was acquired in FITC-A channel. The parental HEK293T cells (HEK) are included as a negative control compared to the CRISPR/Cas9-edited GFP-CD63 HEK293T cells (CRISPR) and cells over-expressing GFP-CD63 (OE). (c) Untransfected HEK cells, CRISPR-, and OE-clones were seeded onto glass slides, fixed, counter-stained with DAPI, and analyzed with an Olympus FV10i confocal microscope. The CRISPR clone displays perinuclear GFP fluorescence, as expected for CD63, with minimal plasma membrane localization. In the OE clone, the plasma membrane localization of GFP-CD63 is clearly detected in a large fraction of the cells. The scale bar is 10 µm.
Figure 2
Figure 2
The characterization of extracellular vesicles and the expression of GFP-CD63. The EVs were enriched from either parental HEK293T cells or cells that were stably expressing GFP-CD63—achieved either by CRISPR/Cas9 (CRISPR-EV) or a conventional over-expression system (OE-EV). (a) Small EVs that were isolated from CRISPR GFP-CD63 stable cell lines were compared to total cell lysates by Western blotting of positive marker proteins for EVs (CD81, Alix, TSG101) and the negative marker GM130. (b) Comparison of EVs from parental HEK293T cells, CRISPR-EVs, and OE-EVs. Equal amounts (5 µg) of total protein were loaded and the membrane was probed either with an anti-CD63 antibody or an anti-GFP antibody. The bands for endogenous CD63 (arrowheads, left side) and for the GFP-CD63 fusion proteins (arrows, right side) are indicated. A 15-s short-time exposure of the OE-samples was added to enable a comparison of the band sizes to the other samples. (c) Recombinant GFP protein, CRISPR-EVs, and OE-EVs were immobilized on Poly-D-Lysine (PDL)-coated glass cover slips. The intensity profiles of the fluorescent spots were fit with a Gaussian function and the corresponding distribution fits of the integrated intensities are shown as box plots. (d) HS-AFM image of isolated EVs, exemplarily shown for CRISPR-EVs. The color bar expresses the height of the vesicles in nm. (e) HS-AFM analysis EVs of parental HEK293T, CRISPR-EVs, and OE-EVs. The particle height was measured as described in the Materials & Methods. Approximately 70 measurements per sample are depicted in the box plot, the median is indicated by the red line.
Figure 3
Figure 3
Fluorescence signals of single (a) GFPs, (b) CRISPR-EVs, and (c) OE-EVs that were immobilized on Poly-D-Lysine (PDL)-coated glass cover slips. The spots on the fluorescence image (left column) were fitted with a gaussian and then the integrated intensity for each spot were determined. The middle column shows histograms and the probability density function (PDF) as a black solid line for each population, respectively. The probability densities of GFP-labeled CRISPR-EVs and OE-EVs were convoluted with multiple GFP PDFs (right column). The probability density function convolution of GFP intensities with CRISPR-EVs (83%—DOL = 1, 11%—DOL = 2, 4%—DOL = 3, 2%—DOL ≥ 4) and OE-EVs (36%—DOL = 1, 19%—DOL = 2, 3%—DOL = 3, 42%—DOL ≥ 4), respectively, show that over-expression introduces a higher number of CD63-GFP constructs into the EV membrane. (DOL = degree of labeling). Black arrows indicate typical signals for a single GFP, the green arrow indicates an EV assigned with two GFP labels and the yellow arrow indicates an EV with multiple GFP labels.
Figure 4
Figure 4
Intracellular imaging of GFP-labeled EVs. The HeLa cells were incubated with (a) PBS (CTRL), (b) recombinant GFP-protein (GFP), (c) CRISPR-EVs, or (d) OE-EVs for 1.5 h. The fluorescence images of one z-level (cross-section through the middle of the cell) are shown in the middle panel and the z-projections are shown in the lower panel. The arrows indicate the typical fluorescence signals of EVs. The scale bar is 10 µm.
Figure 5
Figure 5
An overlay of EV localizations and brightfield image of the HeLa cells that were incubated with EVs. The colored dots represent the 3D localized position of EVs inside the cells. The diameter corresponds to the lateral position accuracy (multiplied by three for better visibility) of the localized EVs, the color corresponds to their z-position. (a) shows the 3D localizations of OE GFP-CD63 EV. (b) shows the 3D localizations of the CRISPR/Cas9-modified HaloTag® EVs that were labeled with JF646.

References

    1. Van Niel G., D’Angelo G., Raposo G. Shedding light on the cell biology of extracellular vesicles. Nat. Rev. Mol. Cell Biol. 2018;19:213–228. doi: 10.1038/nrm.2017.125. - DOI - PubMed
    1. Yáñez-Mó M., Siljander P.R.-M., Andreu Z., Bedina Zavec A., Borràs F.E., Buzas E.I., Buzas K., Casal E., Cappello F., Carvalho J., et al. Biological properties of extracellular vesicles and their physiological functions. J. Extracell. Vesicles. 2015;4:27066. doi: 10.3402/jev.v4.27066. - DOI - PMC - PubMed
    1. György B., Szabó T.G., Pásztói M., Pál Z., Misják P., Aradi B., László V., Pállinger É., Pap E., Kittel Á., et al. Membrane vesicles, current state-of-the-art: Emerging role of extracellular vesicles. Cell. Mol. Life Sci. 2011;68:2667–2688. doi: 10.1007/s00018-011-0689-3. - DOI - PMC - PubMed
    1. Valcz G., Buzás E.I., Sebestyén A., Krenács T., Szállási Z., Igaz P., Molnár B. Extracellular Vesicle-Based Communication May Contribute to the Co-Evolution of Cancer Stem Cells and Cancer-Associated Fibroblasts in Anti-Cancer Therapy. Cancers. 2020;12:2324. doi: 10.3390/cancers12082324. - DOI - PMC - PubMed
    1. Thery C., Boussac M., Veron P., Ricciardi-Castagnoli P., Raposo G., Garin J., Amigorena S. Proteomic analysis of dendritic cell-derived exosomes: A secreted subcellular compartment distinct from apoptotic vesicles. J. Immunol. 2001;166:7309–7318. doi: 10.4049/jimmunol.166.12.7309. - DOI - PubMed

Substances

LinkOut - more resources