

The Protective Effects of Lactoferrin on Aflatoxin M1-Induced Compromised Intestinal Integrity
- PMID: 35008712
- PMCID: PMC8745159
- DOI: 10.3390/ijms23010289
The Protective Effects of Lactoferrin on Aflatoxin M1-Induced Compromised Intestinal Integrity
Abstract
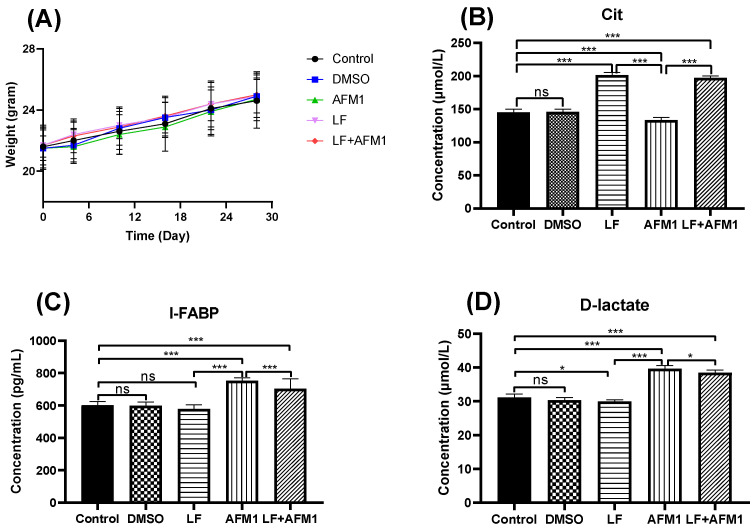
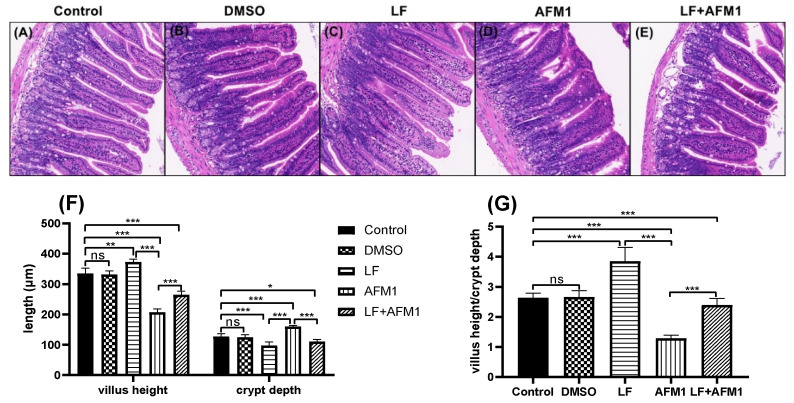
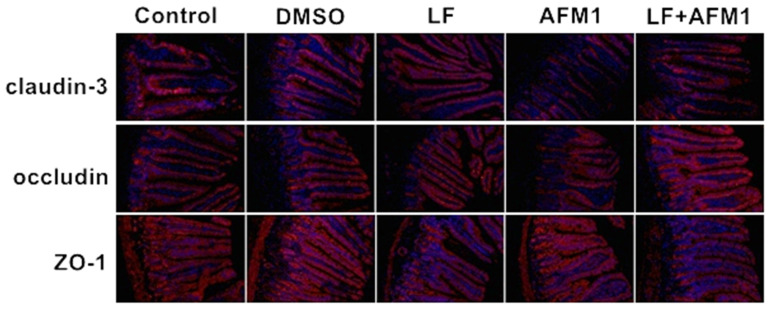
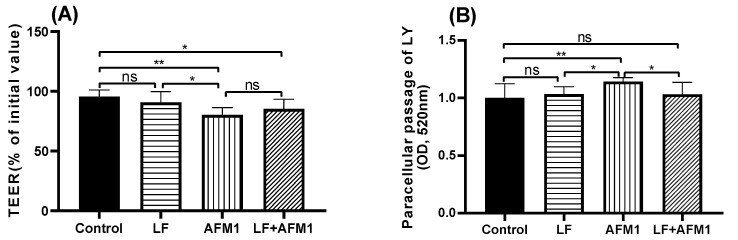
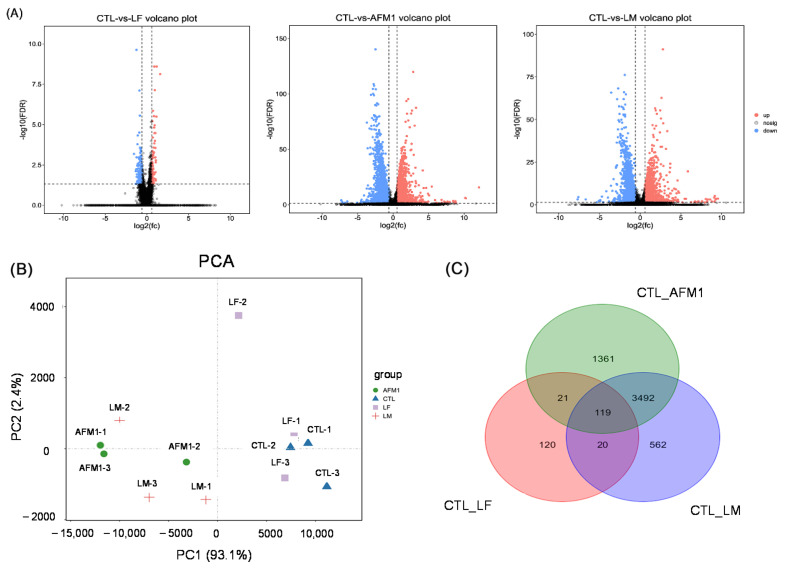
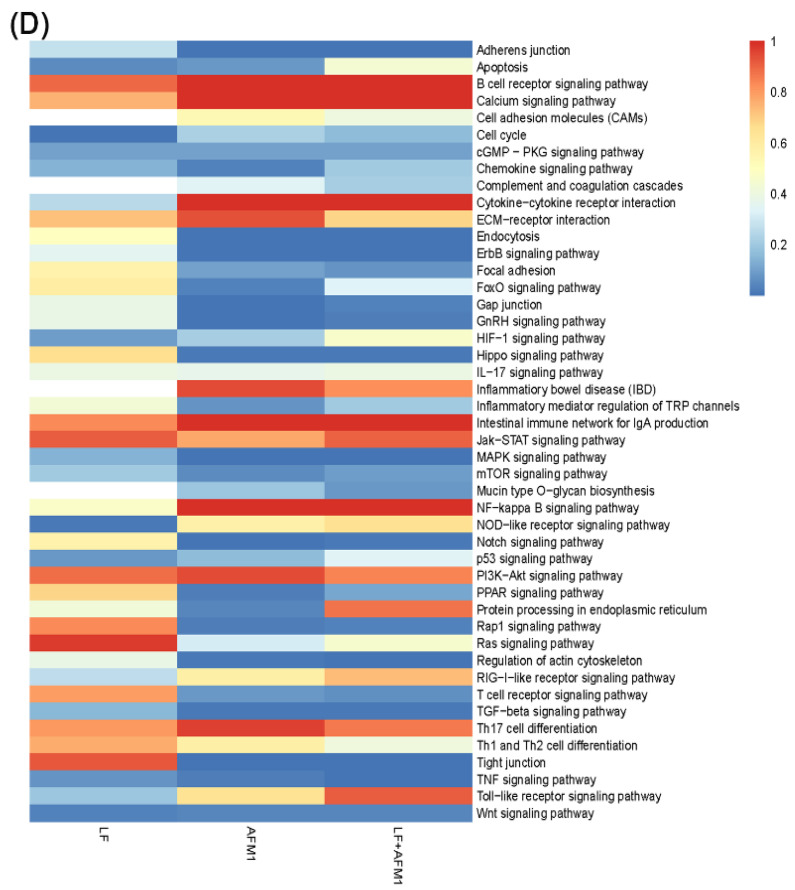
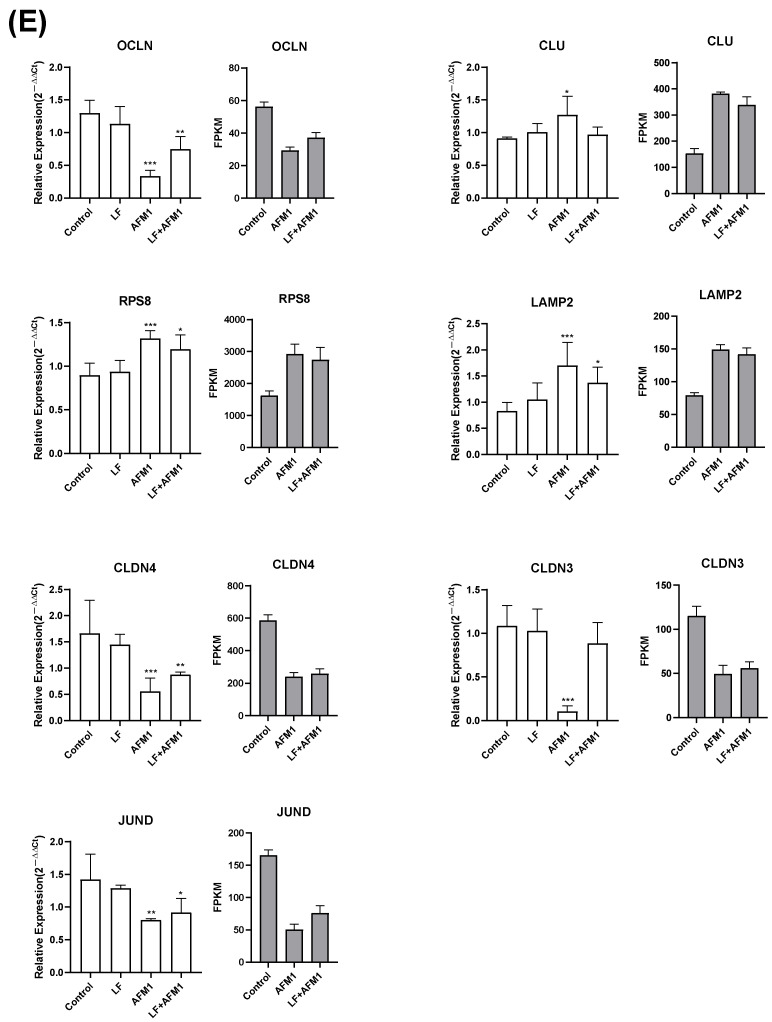
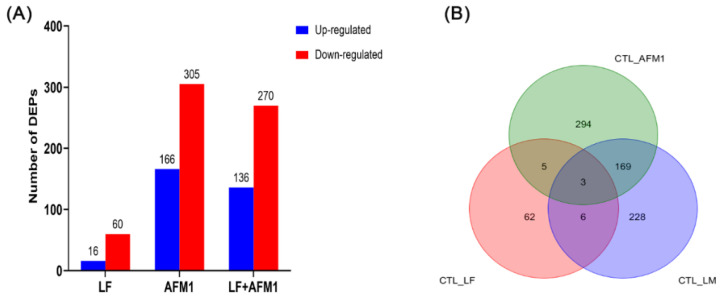
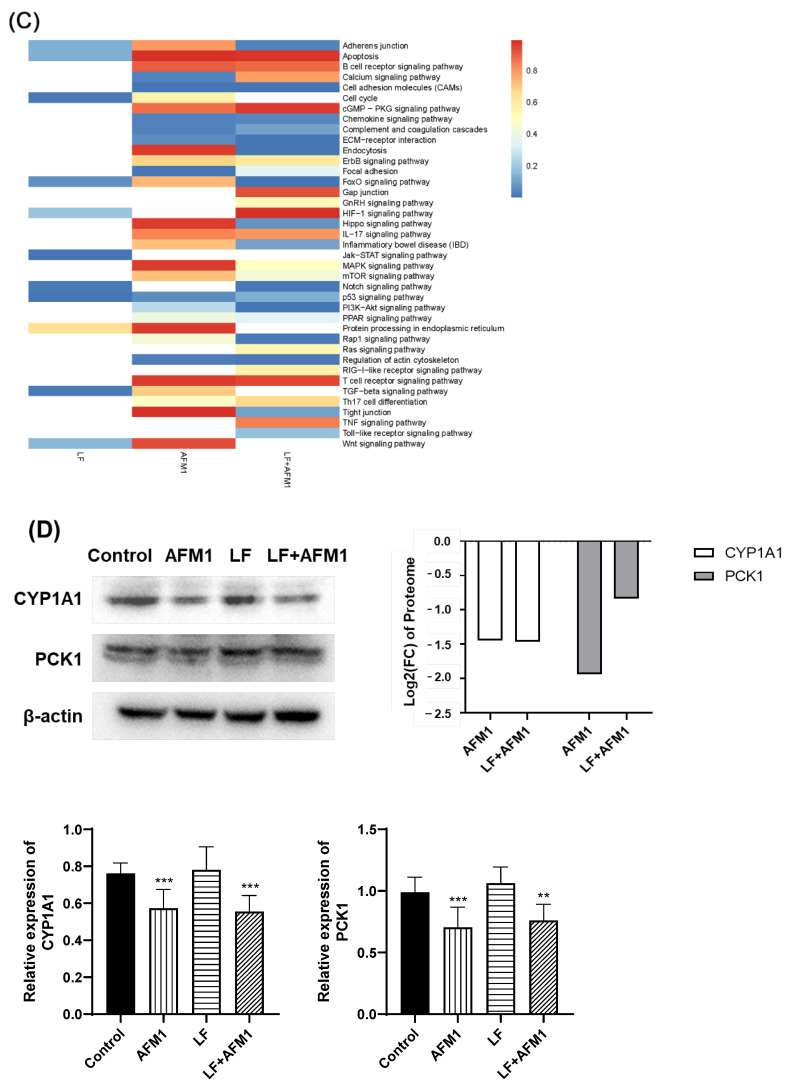
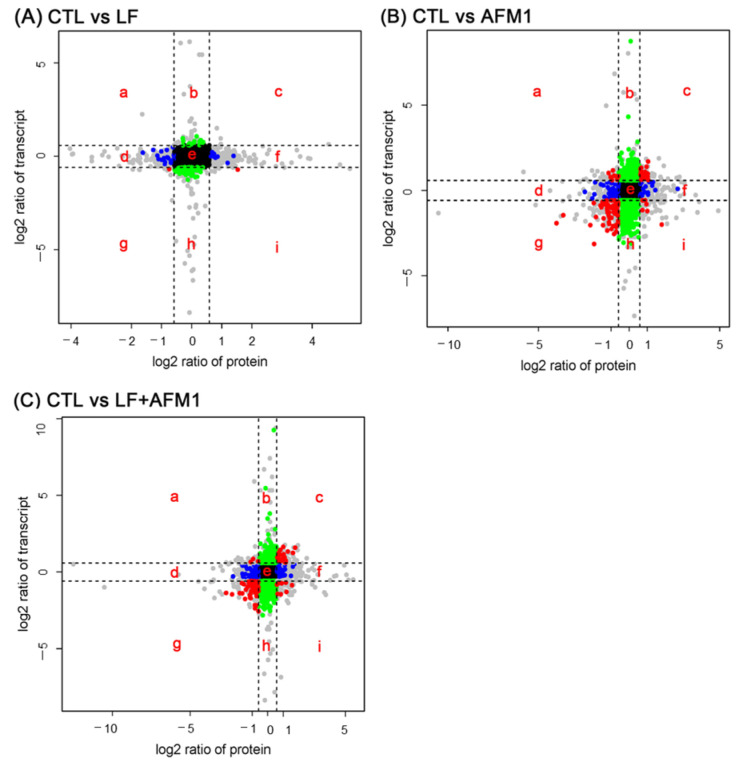
Aflatoxin M1 (AFM1), the only toxin with maximum residue levels in milk, has adverse effects on the intestinal barrier, resulting in intestinal inflammatory disease. Lactoferrin (LF), one of the important bioactive proteins in milk, performs multiple biological functions, but knowledge of the protective effects of LF on the compromised intestinal barrier induced by AFM1 has not been investigated. In the present study, results using Balb/C mice and differentiated Caco-2 cells showed that LF intervention decreased AFM1-induced increased intestinal permeability, improved the protein expression of claudin-3, occludin and ZO-1, and repaired the injured intestinal barrier. The transcriptome and proteome were used to clarify the underlying mechanisms. It was found that LF reduced the intestinal barrier dysfunction caused by AFM1 and was associated with intestinal cell survival related pathways, such as cell cycle, apoptosis and MAPK signaling pathway and intestinal integrity related pathways including endocytosis, tight junction, adherens junction and gap junction. The cross-omics analysis suggested that insulin receptor (INSR), cytoplasmic FMR1 interacting protein 2 (CYFIP2), dedicator of cytokinesis 1 (DOCK1) and ribonucleotide reductase regulatory subunit M2 (RRM2) were the potential key regulators as LF repaired the compromised intestinal barrier. These findings indicated that LF may be an alternative treatment for the compromised intestinal barrier induced by AFM1.
Keywords: aflatoxin M1; intestinal barrier; lactoferrin; proteome; tight junction; transcriptome.
Conflict of interest statement
The authors declare no conflict of interest.
Figures
Similar articles
-
Transcriptional and Proteomic Analysis Revealed a Synergistic Effect of Aflatoxin M1 and Ochratoxin A Mycotoxins on the Intestinal Epithelial Integrity of Differentiated Human Caco-2 Cells.J Proteome Res. 2018 Sep 7;17(9):3128-3142. doi: 10.1021/acs.jproteome.8b00241. Epub 2018 Aug 20. J Proteome Res. 2018. PMID: 30079738
-
Aflatoxin B1 and Aflatoxin M1 Induce Compromised Intestinal Integrity through Clathrin-Mediated Endocytosis.Toxins (Basel). 2021 Mar 2;13(3):184. doi: 10.3390/toxins13030184. Toxins (Basel). 2021. PMID: 33801329 Free PMC article.
-
The coexistence of aflatoxin M1 and ochratoxin A induced intestinal barrier disruption via the regulation of key differentially expressed microRNAs and long non-coding RNAs in BALB/c mice.Ecotoxicol Environ Saf. 2023 Oct 1;264:115428. doi: 10.1016/j.ecoenv.2023.115428. Epub 2023 Sep 7. Ecotoxicol Environ Saf. 2023. PMID: 37688864
-
Lactoferrin, Osteopontin and Lactoferrin-Osteopontin Complex: A Critical Look on Their Role in Perinatal Period and Cardiometabolic Disorders.Nutrients. 2023 Mar 14;15(6):1394. doi: 10.3390/nu15061394. Nutrients. 2023. PMID: 36986124 Free PMC article. Review.
-
The effect of lactoferrin in aging: role and potential.Food Funct. 2022 Jan 24;13(2):501-513. doi: 10.1039/d1fo02750f. Food Funct. 2022. PMID: 34928288 Review.
Cited by
-
Lactoferrin Alleviates Inflammation and Regulates Gut Microbiota Composition in H5N1-Infected Mice.Nutrients. 2023 Jul 28;15(15):3362. doi: 10.3390/nu15153362. Nutrients. 2023. PMID: 37571299 Free PMC article.
-
NR1H4-mediated circRHOBTB3 modulates the proliferation, metastasis, and Warburg effects of cervical cancer through interacting with IGF2BP3.Mol Cell Biochem. 2023 Dec;478(12):2671-2681. doi: 10.1007/s11010-023-04692-5. Epub 2023 Mar 20. Mol Cell Biochem. 2023. PMID: 36939994
-
Lactoferrin Restores the Deoxynivalenol-Impaired Spermatogenesis and Blood-Testis Barrier Integrity via Improving the Antioxidant Capacity and Modifying the Cell Adhesion and Inflammatory Response.Antioxidants (Basel). 2023 Jan 9;12(1):152. doi: 10.3390/antiox12010152. Antioxidants (Basel). 2023. PMID: 36671014 Free PMC article.
-
Bovine lactoferrin alleviates aflatoxin B1 induced hepatic and renal injury in broilers by mediating Nrf2 signaling pathway.Poult Sci. 2024 Dec;103(12):104316. doi: 10.1016/j.psj.2024.104316. Epub 2024 Sep 19. Poult Sci. 2024. PMID: 39383667 Free PMC article.
-
The Role of Lactoferrin in Intestinal Health.Pharmaceutics. 2023 May 23;15(6):1569. doi: 10.3390/pharmaceutics15061569. Pharmaceutics. 2023. PMID: 37376017 Free PMC article. Review.
References
-
- Nongonierma A.B., FitzGerald R.J. The scientific evidence for the role of milk protein-derived bioactive peptides in humans: A Review. J. Funct. Foods. 2015;17:640–656. doi: 10.1016/j.jff.2015.06.021. - DOI
-
- Iqbal S.Z., Jinap S., Pirouz A.A., Ahmad Faizal A.R. Aflatoxin M1 in milk and dairy products, occurrence and recent challenges: A review. Trends Food Sci. Technol. 2015;46:110–119. doi: 10.1016/j.tifs.2015.08.005. - DOI
-
- Zulueta A., Maurizi A., Frígola A., Esteve M.J., Coli R., Burini G. Antioxidant capacity of cow milk, whey and deproteinized milk. Int. Dairy J. 2009;19:380–385. doi: 10.1016/j.idairyj.2009.02.003. - DOI
-
- Min L., Li D., Tong X., Sun H., Chen W., Wang G., Zheng N., Wang J. The challenges of global occurrence of aflatoxin M1 contamination and the reduction of aflatoxin M1 in milk over the past decade. Food Control. 2020;117:107352. doi: 10.1016/j.foodcont.2020.107352. - DOI
MeSH terms
Substances
Grants and funding
- 31801666/National Natural Science Foundation of China
- China Agriculture Research System of MOF and MARA/China Agriculture Research System of MOF and MARA
- ASTIP-IAS12/the Agricultural Science and Technology Innovation Program
- CAAS-ZDXT2019004/the Scientific Research Project for Major Achievements of Agricultural Science and Technology Innovation Program
LinkOut - more resources
Full Text Sources
Other Literature Sources
Miscellaneous
