. 2021 Dec 28;23(1):301.
doi: 10.3390/ijms23010301.

Biochemical and Cellular Characterization of New Radio-Resistant Cell Lines Reveals a Role of Natural Flavonoids to Bypass Senescence

Affiliations

Biochemical and Cellular Characterization of New Radio-Resistant Cell Lines Reveals a Role of Natural Flavonoids to Bypass Senescence

Maria Russo et al. Int J Mol Sci. .

Abstract

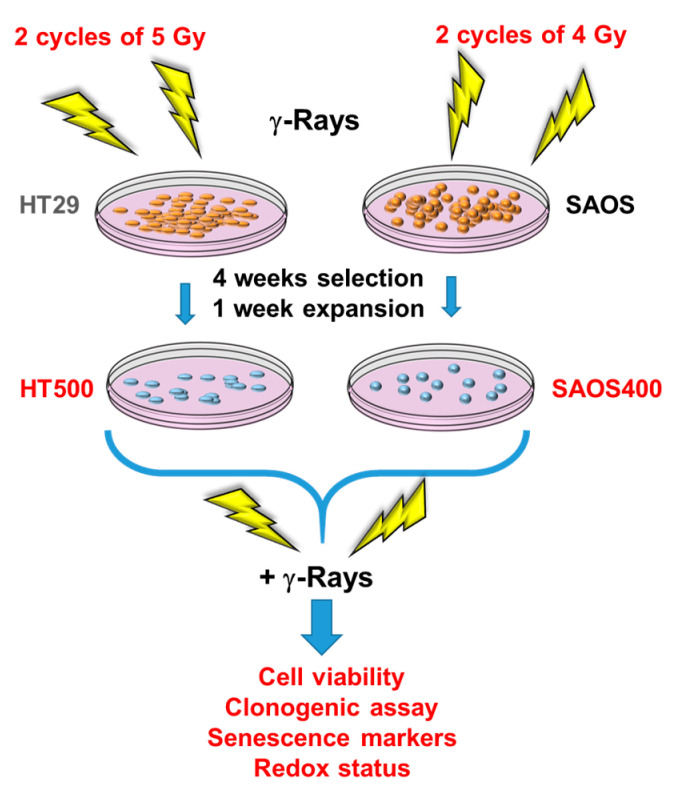
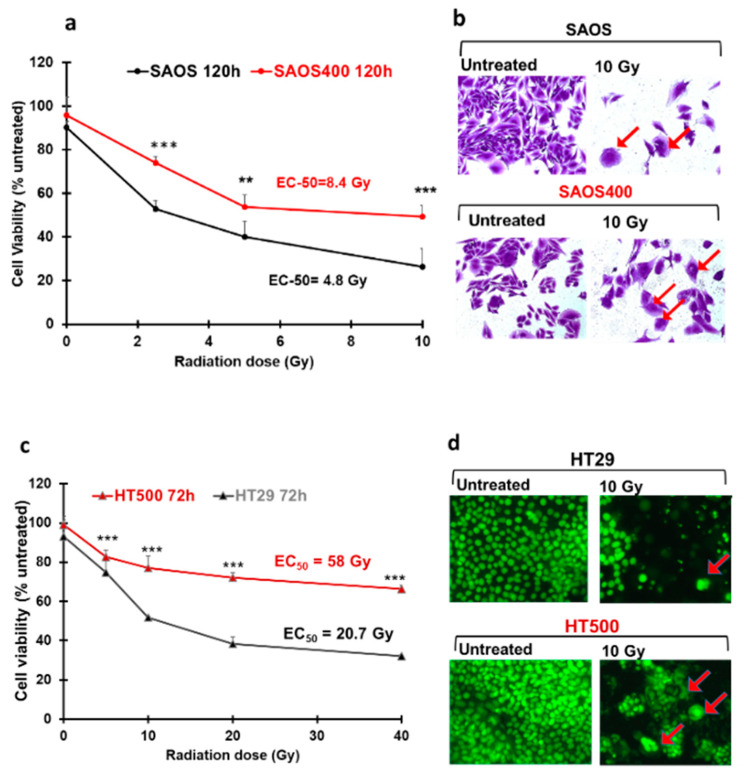
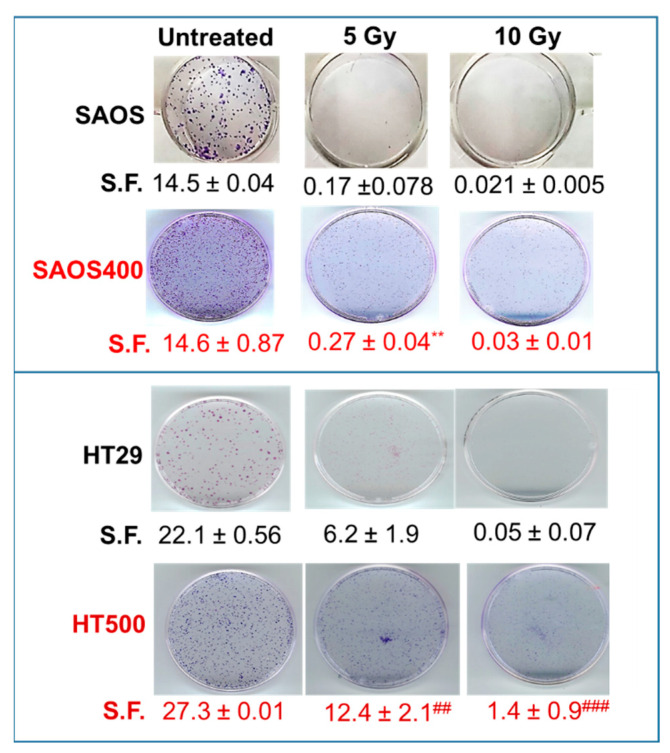
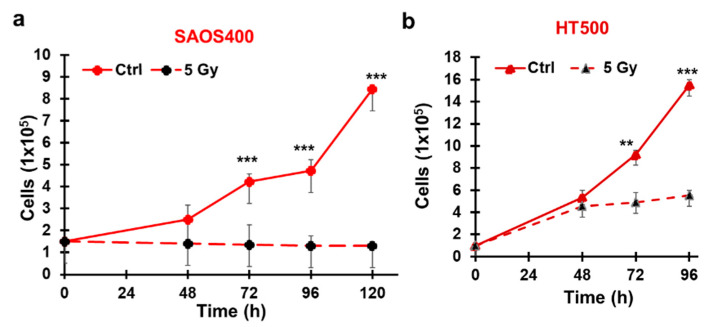
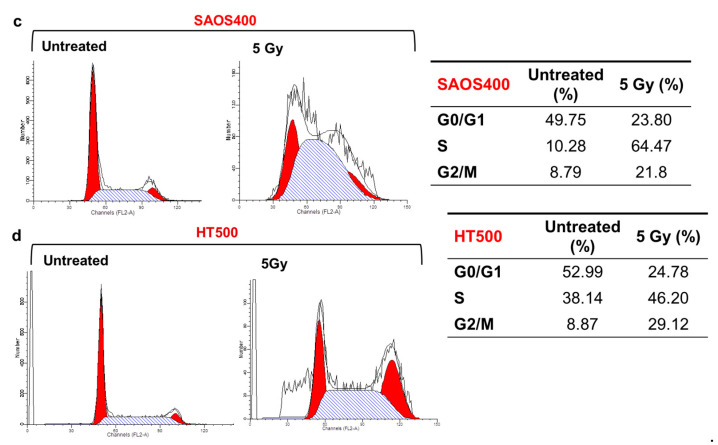
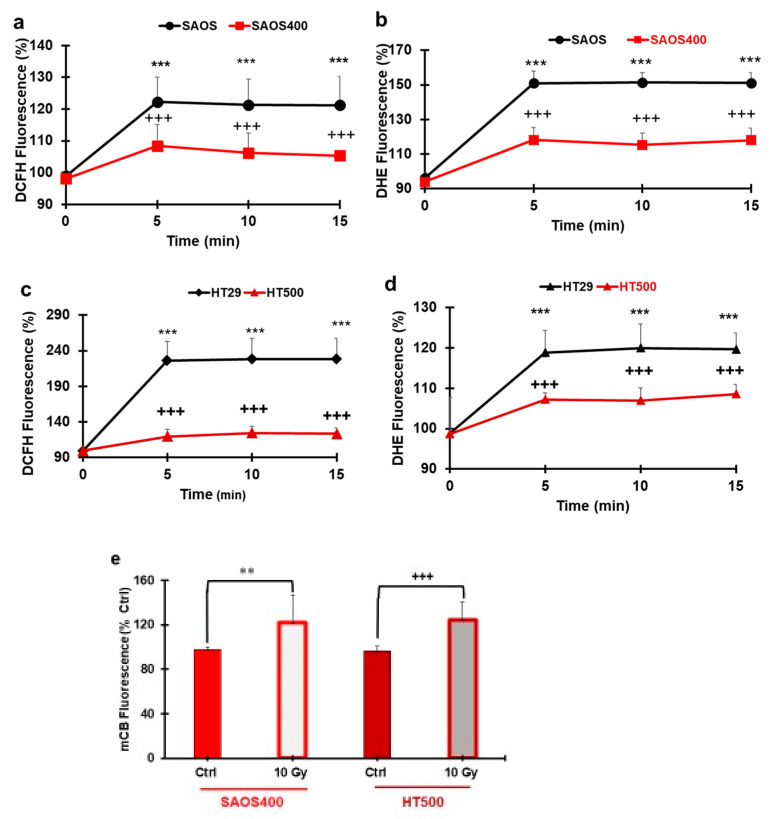
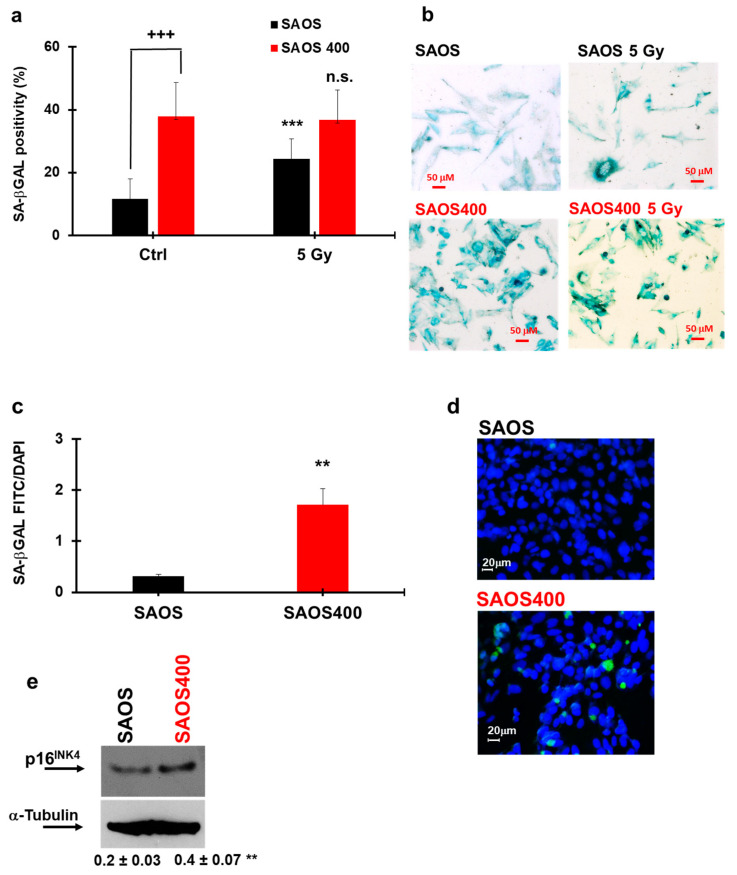
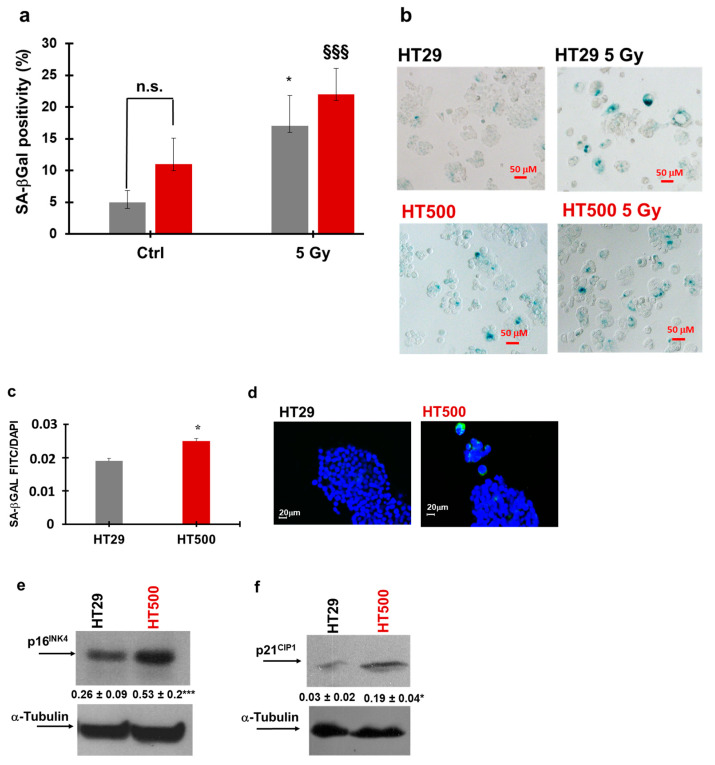
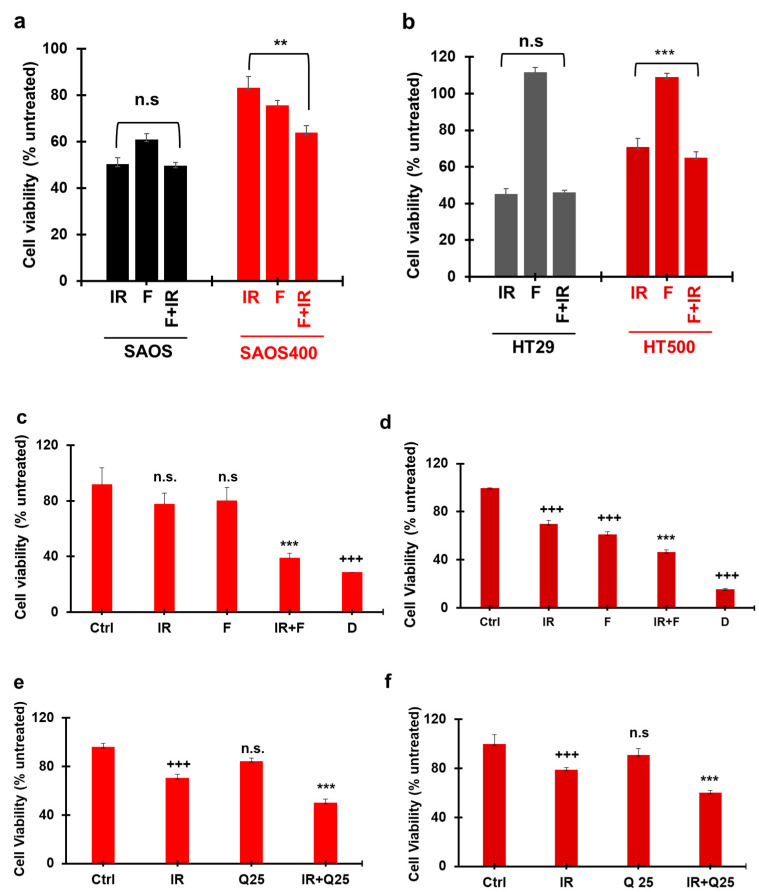
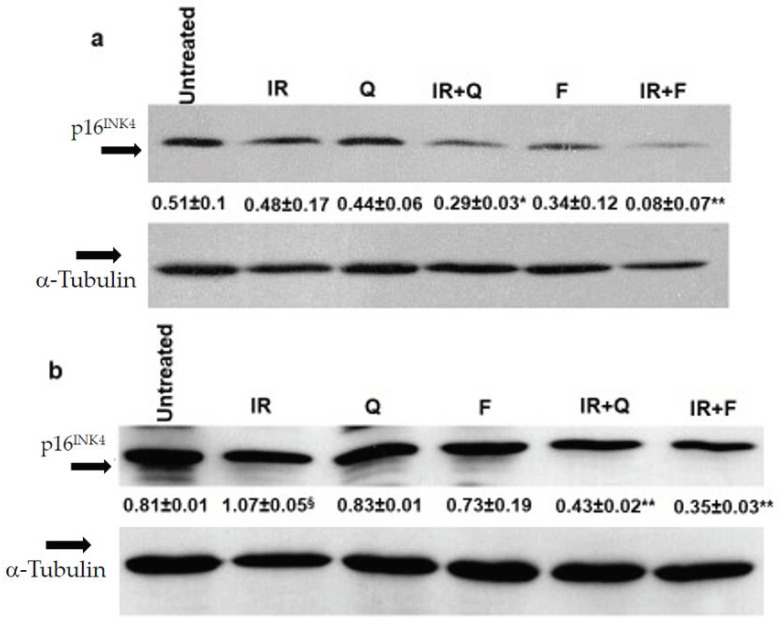
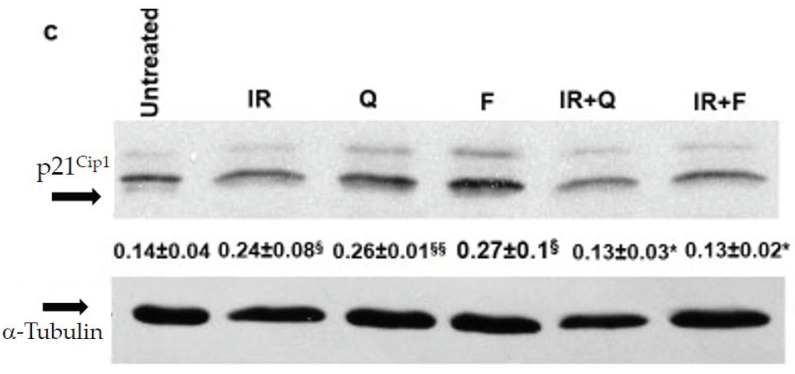
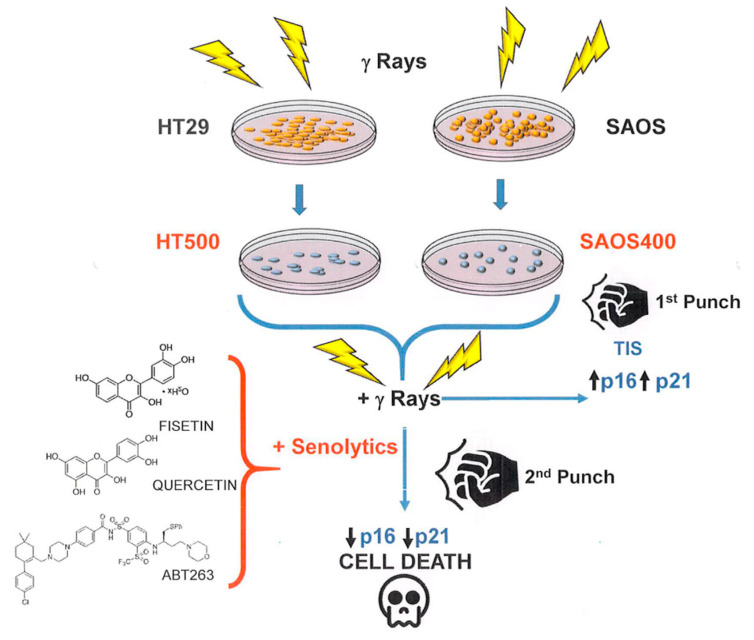
Cancer is one of the main causes of death worldwide, and, among the most frequent cancer types, osteosarcoma accounts for 56% of bone neoplasms observed in children and colorectal cancer for 10.2% of tumors diagnosed in the adult population. A common and frequent hurdle in cancer treatment is the emergence of resistance to chemo- and radiotherapy whose biological causes are largely unknown. In the present work, human osteosarcoma (SAOS) and colorectal adenocarcinoma (HT29) cell lines were γ-irradiated at doses mimicking the sub-lethal irradiation in clinical settings to obtain two radio-resistant cellular sub-populations named SAOS400 and HT500, respectively. Since "therapy-induced senescence" (TIS) is often associated with tumor response to radiotherapy in cancer cells, we measured specific cellular and biochemical markers of senescence in SAOS400 and HT500 cells. In detail, both cell lines were characterized by a higher level of expression of cyclin-dependent kinase inhibitors p16INK4 and p21CIP1 and increased positivity to SAβ-gal (senescence-associated β-galactosidase) with respect to parental cells. Moreover, the intracellular levels of reactive oxygen species in the resistant cells were significantly lower compared to the parental counterparts. Subsequently, we demonstrated that senolytic agents were able to sensitize SAOS400 and HT500 to cell death induced by γ-irradiation. Employing two natural flavonoids, fisetin and quercetin, and a BH3-mimetic, ABT-263/navitoclax, we observed that their association with γ-irradiation significantly reduced the expression of p16INK4, p21CIP1 and synergistically (combination index < 1) increased cell death compared to radiation mono-alone treatments. The present results reinforce the potential role of senolytics as adjuvant agents in cancer therapy.

Keywords: BH3 mimetics; cancer therapy; flavonoids; senolytics; therapy-induced senescence; γ radiation resistance.


Conflict of interest statement

The authors declare no conflict of interest.

Figures

Figure 1
Figure 1
Scheme summarizing the procedures applied to obtain radio-resistant HT500 and SAOS400 cell lines from their parental HT29 and SAOS cells, respectively.
Figure 2
Figure 2
Radio-resistance of SAOS400 and HT500 cells compared to their parental cell lines. Changes in cell viability after increasing doses of γ-rays in SAOS vs. SAOS400 (panel a) and HT29 vs. HT500 cells (panel c). Data represent the mean of three independent experiments (±SD). Symbols indicate significance: ** p < 0.01 or *** p < 0.001 of the parental cells compared to the radio-resistant sub-population (Student’s t-test). The calculated EC50s are reported as inserts within the graphs. Photographs (400x magnification) show representative fields of untreated and SAOS or SAOS400 cells after IR (10 Gy), stained with Crystal Violet dye (panel b) or untreated and IR-treated (10 Gy) HT29 or HT500 cells stained with CyQuant dye (panel d).
Figure 3
Figure 3
Colony-forming assay. Representative images are reported comparing SAOS and HT29 cells with their respective radio-resistant counterparts, SAOS400 and HT500 cells. Numbers below each row of panels indicate the means of counted colonies ± SD expressed as S.F (Surviving Fractions) from two independent experiments. Symbols indicate significance with ** p < 0.01 with respect to SAOS cells and ## p < 0.01 and ### p < 0.001 with respect to HT29 cells (Student’s t-test).
Figure 4
Figure 4
Effect on cell growth after irradiation in SAOS400 and HT500 cell lines. The number of viable cells after 5 Gy irradiation in SAOS400 (panel a) and HT500 (panel b) cells was evaluated at the indicated time using Trypan blue exclusion dye. Data reported indicate the mean ± SD of two independent experiments; symbols indicate significance: ** p < 0.01 and *** p < 0.001 with respect to IR cells. (Panels c,d) report the cell cycle analyses of SAOS400 and HT500 cells, respectively after γ−rays irradiation (5 Gy). Cells were irradiated, harvested after 96 h, fixed, stained with propidium iodide, and analysed by flow cytometry as described in the Methods section. The left panels report representative histograms of cell cycle distribution obtained using ModFit software, while in the insert tables on the right, the percentages of diploid cells in the different phases of the cell cycle are indicated.
Figure 4
Figure 4
Effect on cell growth after irradiation in SAOS400 and HT500 cell lines. The number of viable cells after 5 Gy irradiation in SAOS400 (panel a) and HT500 (panel b) cells was evaluated at the indicated time using Trypan blue exclusion dye. Data reported indicate the mean ± SD of two independent experiments; symbols indicate significance: ** p < 0.01 and *** p < 0.001 with respect to IR cells. (Panels c,d) report the cell cycle analyses of SAOS400 and HT500 cells, respectively after γ−rays irradiation (5 Gy). Cells were irradiated, harvested after 96 h, fixed, stained with propidium iodide, and analysed by flow cytometry as described in the Methods section. The left panels report representative histograms of cell cycle distribution obtained using ModFit software, while in the insert tables on the right, the percentages of diploid cells in the different phases of the cell cycle are indicated.
Figure 5
Figure 5
ROS and GSH production in SAOS400 and HT500 cells. SAOS/SAOS400 and HT29/HT500 (panels a and c) cells were pre-incubated with H2O2 probe (CM-DCFDA) or O2 probe (DHE) (panels b and d), washed, and irradiated (10 Gy). Fluorescence was measured in the 5–15 min time range. Data reported are the mean ± SD of three independent experiments in quadruplicate. Symbols indicate significance after ANOVA analysis for multiple comparisons at different time points: *** p ≤ 0.001 of SAOS400 and HT500 cells vs. their parental cell lines; +++ p ≤ 0.001, indicate significance of SAOS400 and HT500 cells at times 5–15 min vs. time 0 min. In panel (e), the GSH levels in SAOS400 and HT500 cells after 10 Gy for 2 h are reported. Cells were incubated with a GSH intracellular probe (mCB), as described in the Methods section. Bar graphs represent the mean ± SD of three independent experiments in quadruplicate. Symbols indicate significance: ** p < 0.01 untreated SAOS400 cells vs. irradiated; +++ p < 0.001 untreated HT500 vs. irradiated.
Figure 6
Figure 6
Senescence measurements in SAOS and SAOS400 cell lines. SA-βGal staining in SAOS and SAOS400 cells before and after irradiation (5 Gy) were quantified (panel a) and microscopically visualized (panel b). The results of a different protocol that employed C12FDG staining were also quantified (panel c), and representative images were reproduced (d). Bar graphs represent the mean ± SD of two independent experiments. Symbols indicate significance: +++ p < 0.001 for untreated SAOS vs. untreated SAOS400 cells; *** p < 0.001 for untreated SAOS vs. irradiated SAOS (black bars); n.s. not significant in SAOS400 before and after irradiation (red bars) One-way ANOVA with Bonferroni’s multiple comparisons test was used. Panel (e) reports the immunoblot showing the basal expression of p16INK4 in SAOS and SAOS400 cells. Numbers between panels indicate the densitometric analysis ± SD of three independent experiments. Symbols indicate significance: ** p < 0.01 vs. SAOS (T-Test Student).
Figure 7
Figure 7
Senescence measurements in HT29 and HT500 cell lines. SA-βGal staining in HT29 and HT500 cells before and after irradiation (5 Gy) were quantified (panel a) and microscopically visualized (panel b). The results of a different protocol that employed C12FDG staining were also quantified (panel c), and representative images were reproduced (d). Bar graphs represent the mean ± SD of two independent experiments. Symbols indicate significance: * p < 0.05 for untreated HT29 vs. irradiated HT29 (grey bars); §§§ p ≤ 0.001 for HT500 before and after irradiation (dark red bars) One-way ANOVA with Bonferroni’s multiple comparisons test was used. The immunoblots report the basal expression of p16INK4 (panel e) and p21CIP1 (panel f) in HT29 and HT500 cells. Numbers between panels indicate densitometric analysis ± SD of two independent experiments. Symbols indicate significance with * p < 0.05 and *** p < 0.001 (t-test Student).
Figure 8
Figure 8
Senolytic effects of fisetin and quercetin in irradiated SAOS400 and HT500 cell lines. SAOS and SAOS400 cells (panel a) and HT29 and HT500 cells (panel b) were pre-irradiated (10 Gy), cultured for 72 h, and subsequently were incubated for an additional 72 h in the presence of 20 μM F. CyQuant assay was used to quantify cell viability expressed as a percentage of untreated cells. Bar graphs represent mean ± S.D of two independent experiments. Symbols indicate significance: p ≤ 0.01 ** p ≤ 0.001 *** with respect to F and IR cells. n.s. = no statistical significance between the combined treatment, F + IR, vs. IR mono-treatment in both SAOS and HT29 parental cell lines. Radio-resistant SAOS400 (panel c) and HT500 (panel d) cells were pre-irradiated and then directly treated for 96 h with 40 μM F. CyQuant assay was used to quantify cell viability expressed as a percentage of untreated cells. Bar graphs represent mean ± S.D of two independent experiments. Symbols indicate significance: +++ p ≤ 0.001 vs. untreated (Ctrl); *** p ≤ 0.001 vs. F and IR; n.s. not significant vs. untreated (Ctrl). Daunorubicin (D; 0.04 mg/mL) was used as positive control. In panel (e) and (f), SAOS400 and HT500 cells were pre-irradiated (5 Gy) and cultured for 72 h; subsequently, they were incubated for an additional 48 h with 25 μM Q or vehicle DMSO (0.1%). Crystal Violet assay was used to quantify cell viability that was expressed as a percentage of DMSO-treated cells. The bar graph represents mean ± S.D. Symbols indicate significance: +++ p ≤ 0.01 vs. untreated, *** p < 0.001 vs. Q/IR; n.s. not significant vs. untreated (Ctrl). One-way ANOVA with Bonferroni’s multiple comparisons test was used in these experiments.
Figure 9
Figure 9
Changes in senescence markers following senolytic treatments in SAOS400 and HT500 cell lines. Immunoblot analysis of p16INK4 expression in SAOS400 cells (panel a) pre-irradiated (10 Gy) and treated with F (40 μM) or Q (40 μM) for 48 h. Densitometric analysis (numbers between panels) was obtained normalizing the expression of p16INK4 with α−tubulin and quantified as described in the Methods section. * p < 0.05 vs. Q and IR; ** p < 0.01 vs. F and IR. Immunoblots of p16INK4 (panel b) and p21CIP1 (panel c) expressions in HT500 cells pre-irradiated (10 Gy) and treated with 40 μM F or 40 μM Q for 72 h. Densitometric analyses (numbers between panels) were obtained normalizing the expressions of p21CIP1 and p16INK4 with α-tubulin and quantified as described Methods section. § p < 0.05 vs. untreated; §§ p < 0.01 vs. untreated; * p < 0.05, ** p < 0.01 vs. F plus Q and IR.
Figure 9
Figure 9
Changes in senescence markers following senolytic treatments in SAOS400 and HT500 cell lines. Immunoblot analysis of p16INK4 expression in SAOS400 cells (panel a) pre-irradiated (10 Gy) and treated with F (40 μM) or Q (40 μM) for 48 h. Densitometric analysis (numbers between panels) was obtained normalizing the expression of p16INK4 with α−tubulin and quantified as described in the Methods section. * p < 0.05 vs. Q and IR; ** p < 0.01 vs. F and IR. Immunoblots of p16INK4 (panel b) and p21CIP1 (panel c) expressions in HT500 cells pre-irradiated (10 Gy) and treated with 40 μM F or 40 μM Q for 72 h. Densitometric analyses (numbers between panels) were obtained normalizing the expressions of p21CIP1 and p16INK4 with α-tubulin and quantified as described Methods section. § p < 0.05 vs. untreated; §§ p < 0.01 vs. untreated; * p < 0.05, ** p < 0.01 vs. F plus Q and IR.
Figure 10
Figure 10
General cartoon showing how TIS can play the double role of a form of resistance to cell death but also as a process of “therapeutic vulnerability” for senolytic drugs.

Similar articles

Cited by

References

    1. Atun R., Cavalli F. The global fight against cancer: Challenges and opportunities. Lancet. 2018;391:412–413. doi: 10.1016/S0140-6736(18)30156-9. - DOI - PubMed
    1. Perego M., Tyurin V.A., Tyurina Y.Y., Yellets J., Nacarelli T., Lin C., Nefedova Y., Kossenkov A., Liu Q., Sreedhar S., et al. Reactivation of dormant tumor cells by modified lipids derived from stress-activated neutrophils. Sci. Transl. Med. 2020;12 doi: 10.1126/scitranslmed.abb5817. - DOI - PMC - PubMed
    1. Kreso A., O’Brien C.A., van Galen P., Gan O.I., Notta F., Brown A.M., Ng K., Ma J., Wienholds E., Dunant C., et al. Variable clonal repopulation dynamics influence chemotherapy response in colorectal cancer. Science. 2013;339:543–548. doi: 10.1126/science.1227670. - DOI - PMC - PubMed
    1. Haro K.J., Scott A.C., Scheinberg D.A. Mechanisms of resistance to high and low linear energy transfer radiation in myeloid leukemia cells. Blood. 2012;120:2087–2097. doi: 10.1182/blood-2012-01-404509. - DOI - PMC - PubMed
    1. Kim E.H., Kim M.S., Lee K.H., Sai S., Jeong Y.K., Koh J.S., Kong C.B. Effect of low- and high-linear energy transfer radiation on in vitro and orthotopic in vivo models of osteosarcoma by activation of caspase-3 and -9. Int. J. Oncol. 2017;51:1124–1134. doi: 10.3892/ijo.2017.4102. - DOI - PMC - PubMed

MeSH terms

LinkOut - more resources