. 2021 Dec 29;23(1):339.
doi: 10.3390/ijms23010339.

Dietary Interventions Ameliorate Infectious Colitis by Restoring the Microbiome and Promoting Stem Cell Proliferation in Mice

Affiliations

Dietary Interventions Ameliorate Infectious Colitis by Restoring the Microbiome and Promoting Stem Cell Proliferation in Mice

Ishfaq Ahmed et al. Int J Mol Sci. .

Abstract

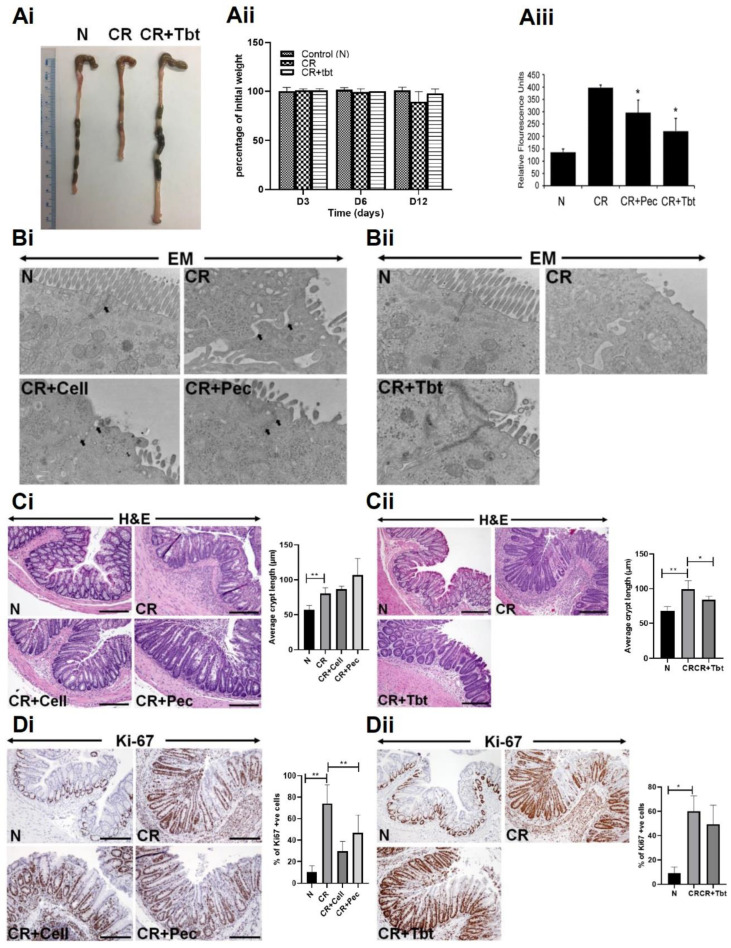
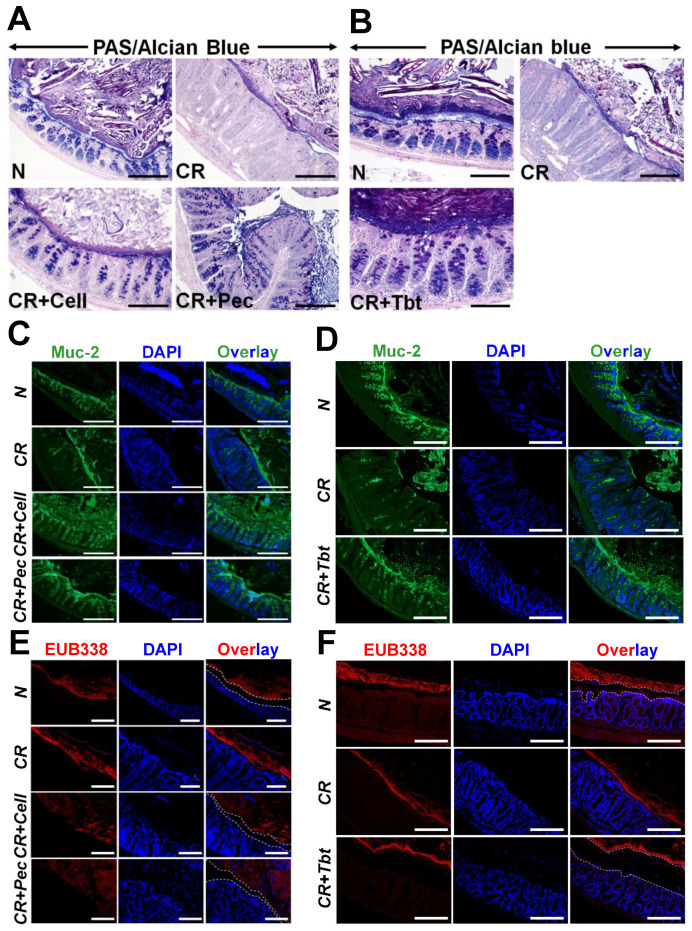
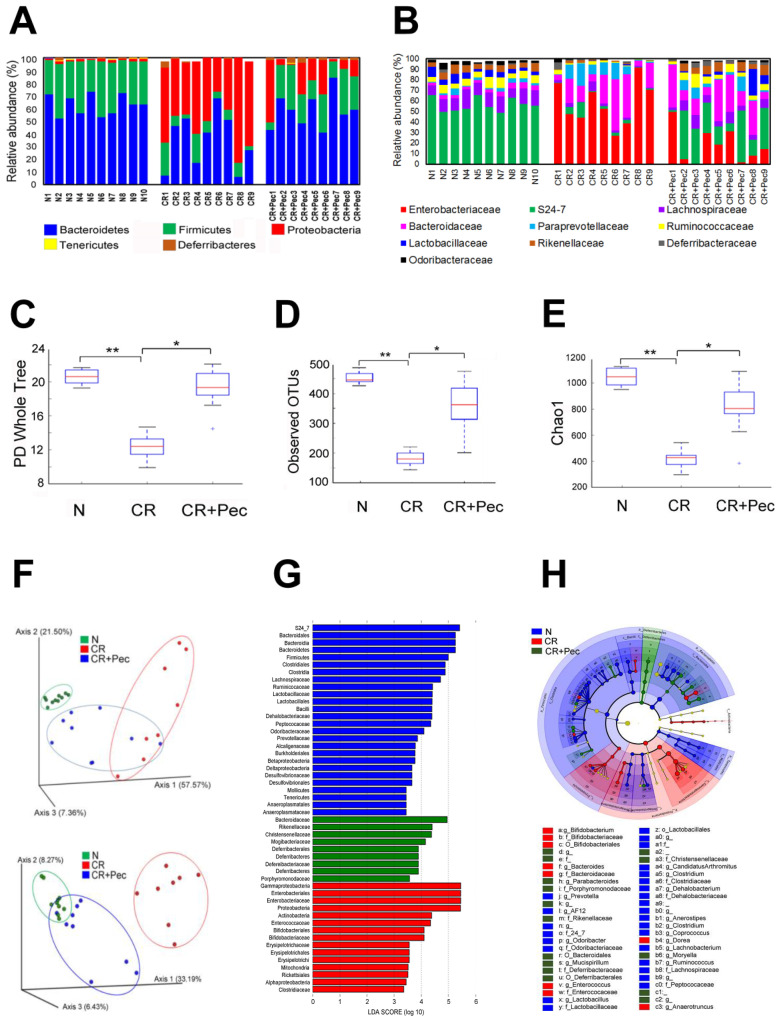
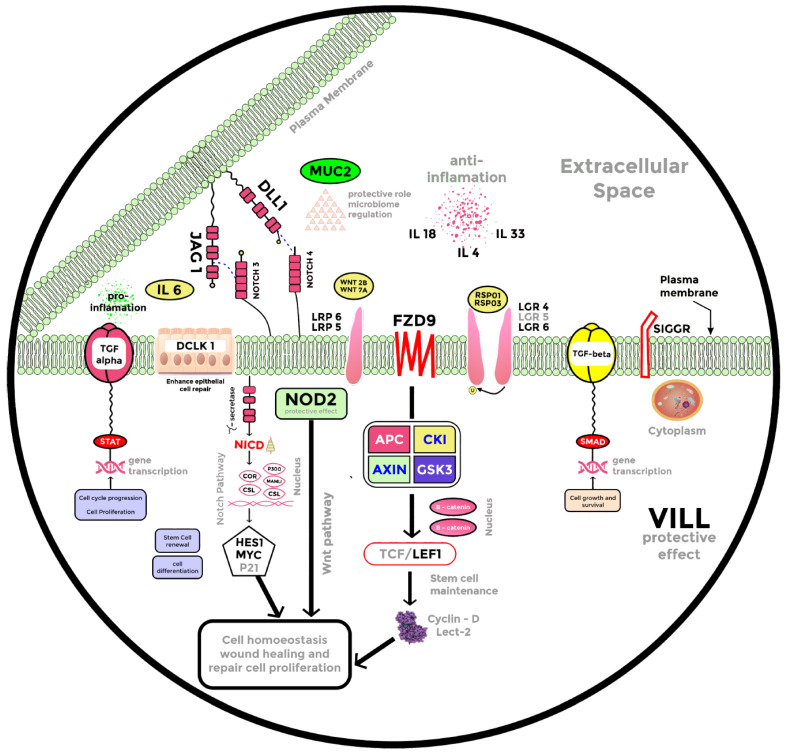
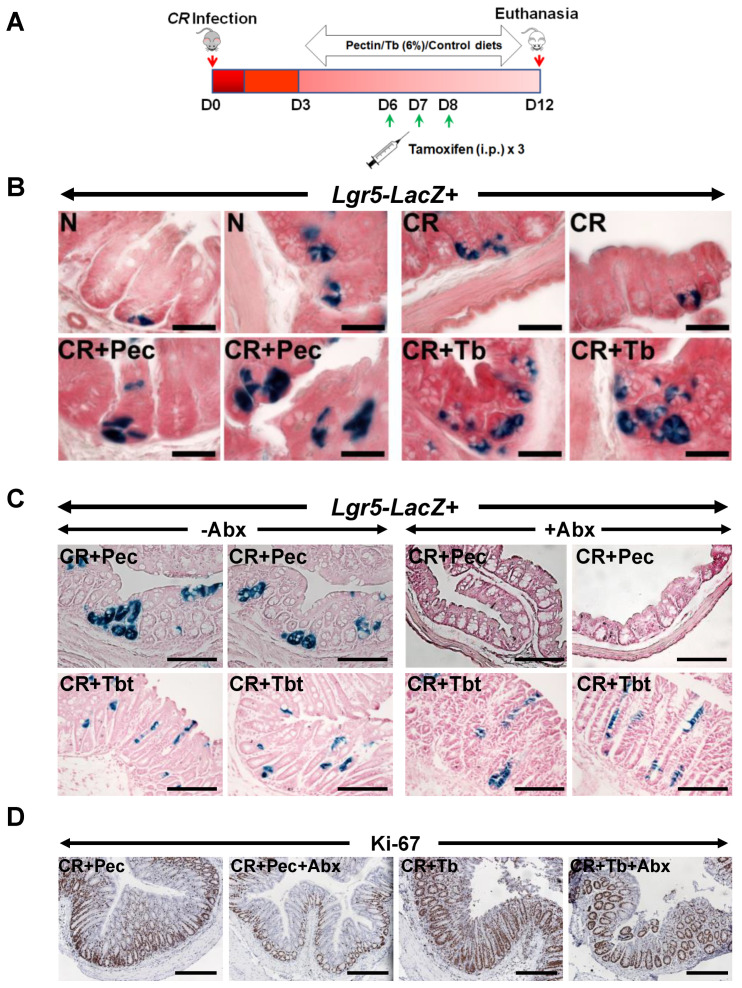
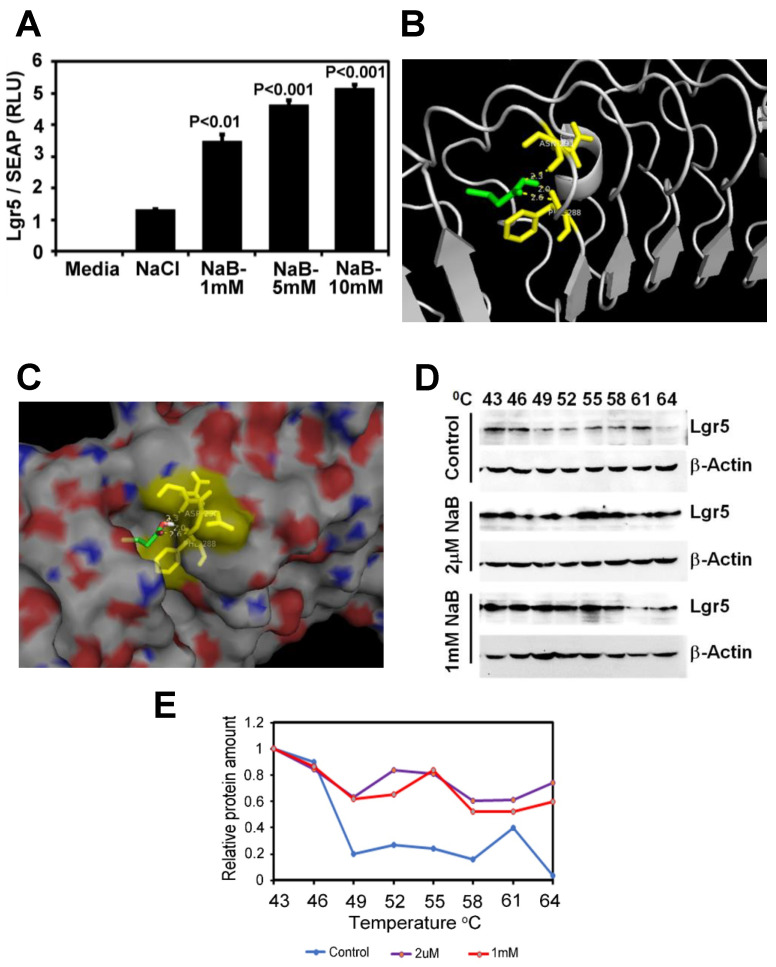
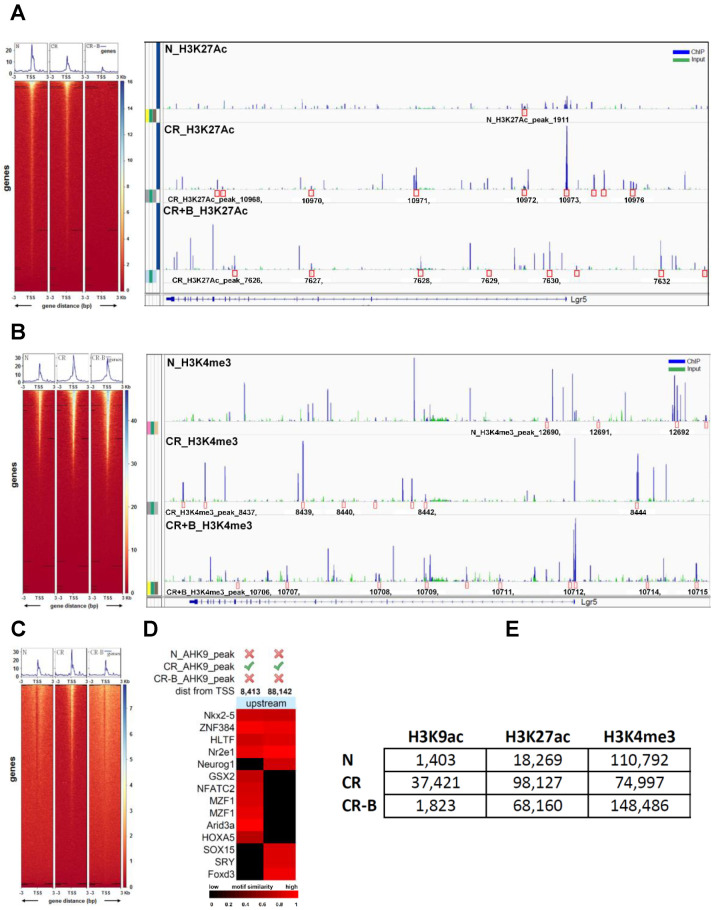
Decreases in short-chain-fatty-acids (SCFAs) are linked to inflammatory bowel disease (IBD). Yet, the mechanisms through which SCFAs promote wound healing, orchestrated by intestinal stem cells, are poorly understood. We discovered that, in mice with Citrobacter rodentium (CR)-induced infectious colitis, treatment with Pectin and Tributyrin diets reduced the severity of colitis by restoring Firmicutes and Bacteroidetes and by increasing mucus production. RNA-seq in young adult mouse colon (YAMC) cells identified higher expression of Lgr4, Lgr6, DCLK1, Muc2, and SIGGIR after Butyrate treatment. Lineage tracing in CR-infected Lgr5-EGFP-IRES-CreERT2/ROSA26-LacZ (Lgr5-R) mice also revealed an expansion of LacZ-labeled Lgr5(+) stem cells in the colons of both Pectin and Tributyrin-treated mice compared to control. Interestingly, gut microbiota was required for Pectin but not Tributyrin-induced Lgr5(+) stem cell expansion. YAMC cells treated with sodium butyrate exhibited increased Lgr5 promoter reporter activity due to direct Butyrate binding with Lgr5 at -4.0 Kcal/mol, leading to thermal stabilization. Upon ChIP-seq, H3K4me3 increased near Lgr5 transcription start site that contained the consensus binding motif for a transcriptional activator of Lgr5 (SPIB). Thus, a multitude of effects on gut microbiome, differential gene expression, and/or expansion of Lgr5(+) stem cells seem to underlie amelioration of colitis following dietary intervention.

Keywords: Citrobacter rodentium; Pectin; Tributyrin; bacterial infection; colitis; dietary intervention; gut microbiome; intestinal stem cells; lgr5; short-chain-fatty-acids (SCFAs).


Conflict of interest statement

The authors declare no conflict of interest.

Figures

Figure 1
Figure 1
Pectin and Tributyrin diets ameliorate infectious colitis: (Ai). Representative images of colons from uninfected normal mice (N), C. rodentium-infected (CR) and CR-infected, and Tributyrin diet-treated mice (CR+Tbt) (results represent 3 independent experiments). (Aii). Average weight measurement of mice in various treatment groups from D0 to D12 post-infection (n = 5 per group). (Aiii). Normal, CR, CR, and Pectin-treated (CR+Pec), and CR and Tributyrin-treated (CR+Tbt) mice were subjected to gavage with FITC-D, and their serum concentrations were measured after four hours (results represent 3 independent experiments; p < 0.05 compared to CR; Mean+SD) (Bi,Bii). Electron microscopy (EM) of the mice is described in Panel A. Arrows represent tight junctions (Pec, Pectin; Cell, Cellulose; Tbt, Tributyrin). (Ci,Cii). H&E staining in the colon sections prepared from the indicated groups in C3H mice. Arrows indicate immune cell infiltration in the CR group. Bar graphs represent average crypt length (* p < 0.05; ** p < 0.01 compared to N; Mean+SD; two-tailed Student’s t-test). (Di,Dii). Representative staining for Ki-67 in the colon sections prepared from the indicated groups in C3H mice. Scale bar = 100 μm; Bar graphs represent percent of Ki-67 positive cells; (* p < 0.05; ** p ≤ 0.01); two-tailed Student’s t-test; results represent 3 independent experiments.
Figure 2
Figure 2
Pectin and Tributyrin diets restore mucus layers and restrict bacterial invasion: (A,B). PAS/Alcian blue staining in the colon sections prepared from the indicated groups in C3H mice. (C), (D). Representative immuno-staining for Muc2 in the colon sections prepared from the indicated groups in C3H mice. Bar = 100 μm; n = 5 mice/group. (E). Representative EUB338 staining for bacteria in the Carnoy-fixed colonic tissues of N, CR, CR+Cell, CR+Pec mice (C3H) via FISH (TexasRed-EUB338; Scale bar = 75 μm; n = 5 mice/group). DAPI was used as a counterstain. (F). Representative EUB338 staining for bacteria in the Carnoy-fixed colonic tissues of N, CR, CR+Tbt mice (C3H) via FISH (TexasRed-EUB338; Scale bar = 100 μm; n = 5 mice/group). DAPI was used as a counterstain. Please note how both Pectin and Tributyrin diets restrict bacterial movement near the mucosa, marked by dashed lines. N= normal mice/control; C. rodentium-infected (CR); mice infected with CR and fed a cellulose diet (CR+Cell); mice infected with CR and fed a Pectin diet (CR+Pectin); mice infected with CR and fed with Tributyrin diet (CR+Tributyrin).
Figure 3
Figure 3
Dietary intervention ameliorates infection-induced microbial dysbiosis: (A). The relative abundance of OTUs at the phylum level in fecal samples of control (N), CR (C. rodentium-infected), and mice infected with CR and fed a Pectin diet (CR+Pectin). (B). The relative abundance of OTUs at the family level in control, CR, and CR+Pectin fecal samples. The data are based on 16S rRNA and show the most abundant OTUs in 9 samples. (CE). Box plots of N, CR, and CR+Pectin fecal samples showing Alpha diversity indices (Chao1, observed OTUs, and PD whole tree; * p < 0.05, ** p < 0.01; one-way ANOVA followed by Tukey’s test). F. Principal component analysis (PCoA) based on the bacterial community structure using weighted and unweighted UniFrac distance in fecal samples from N, CR, and CR+Pectin mice. (G). Linear discriminant analysis (LDA) identifies the most differentially abundant taxa among N, CR, and CR+Pectin samples. (H). Linear discriminant analysis Effect Size (LEfSe) cladogram demonstrating taxonomic differences in N, CR, and CR+Pectin microbiota.
Figure 4
Figure 4
RNA-seq in young adult mouse colon (YAMC) cells.
Figure 5
Figure 5
Requirement of microbiota for Lgr5 expression: (A). Experimental approach to perform lineage tracing in Lgr5-EGFP-IRES-CreERT2/Rosa26LacZ reporter (Lgr5-R) mice following CR infection and dietary and/or tamoxifen treatment. (B). Representative images of Xgal stained crypt sections from N, CR, CR+Pec, and CR+Tbt-treated Lgr5-R mice (Scale bar = 75 μm; results represent 3 independent experiments). (C). Representative images of Xgal-stained crypt sections from either CR+Pec and CR+Pec+Abx or CR+Tbt and CR+Tbt+Abx-treated Lgr5-R mice (Scale bar = 150 μm; results represent 3 independent experiments). (D). Representative staining for Ki-67 in the colon sections of Lgr5-R mice treated with either Pectin and Pectin+Abx or Tributyrin and Tributyrin+Abx (results represent 3 independent experiments). N = normal mice/control; C. rodentium-infected (CR); mice infected with CR and fed a Cellulose diet (CR+Cell); mice infected with CR and fed a Pectin diet (CR+Pectin); mice infected with CR and fed with Tributyrin diet (CR+Tributyrin); Abx (antibiotics); Lgr5-Lacz+ (mice with positive staining for LacZ+ve progeny of the Lgr5+ve stem cells were visualized in the colon by β-galactosidase staining). Scale bar = 120 μm; results represent 3 independent experiments.
Figure 6
Figure 6
Butyrate directly binds and regulates thermal stability of Lgr5: (A). Lgr5 promoter reporter activity assay in HEK293 cells treated with different concentrations of sodium butyrate (P values compared to NaCl; results represent 3 independent experiments). (B,C). Ribbon (B) or space-filled (C) models of molecular docking revealed that Butyrate binds within the protein cavity of Lgr5 (binding energy = −4.0 Kcal/mol) and forms hydrogen bonds with Asp290 (2.3 Å) and Phe288 (2.0 and 2.6 Å). Green: Butyrate; Yellow: Interacting amino acids; Red–White–Blue: Lgr5 protein surface view. (D). Western blot of HEK293 cells treated with different concentrations of sodium butyrate for two hours and then subjected to thermal denaturation at different temperatures for 3 min. Cell lysates were prepared and following SDS-PAGE membranes were probed with Lgr5 antibody. Please note Lgr5 stabilization at higher temperatures when incubated with different concentrations of Butyrate compared to control. (E). Results from the densitometric evaluation of CETSA assays. CETSA: Cellular Thermal Shift Assay, Secreted Alkaline Phosphatase (SEAP); NaB: Sodium Butyrate; NaCl: Sodium Chloride.
Figure 7
Figure 7
Chromatin immunoprecipitation and sequencing (ChIP-seq) analysis in YAMC cells showing the number of significantly enriched regions detected for each histone modification marker: (A). Heatmap of H3K27Ac sequencing-depth-normalized read coverage around 3 kb upstream and downstream from the transcription start site (TSS) of Lgr5 (top panel); sites enriched for the H3K27Ac marker around a 100 kb region from the TSS of the Lgr5 gene in N, CR, and CR+Butyrate (bottom panel). (B). Heatmap of H3K4me3 sequencing-depth-normalized read coverage around 3 kb upstream and downstream from the transcription start site (TSS) of Lgr5 (top panel); sites enriched for the H3K4me3 marker around a 100 kb region from the TSS of the Lgr5 gene in N, CR, and CR+Butyrate (bottom panel); (C). Heatmap of H3K9Ac sequencing-depth-normalized read coverage around 3 kb upstream and downstream from the transcription start site (TSS) of Lgr5. (D). Two upstream sites (8413 bp and 88,142 bp) enriched for H3K9ac in CR that contained conserved binding motifs for several known TFs. (E). The number of significantly enriched regions detected for each histone modification marker in several groups.

Similar articles

Cited by

References

    1. Sommer F., Bäckhed F. The gut microbiota—Masters of host development and physiology. Nat. Rev. Microbiol. 2013;11:227–238. doi: 10.1038/nrmicro2974. - DOI - PubMed
    1. Khor B., Gardet A., Xavier R.J. Genetics and pathogenesis of inflammatory bowel disease. Nat. Cell Biol. 2011;474:307–317. doi: 10.1038/nature10209. - DOI - PMC - PubMed
    1. Xing P.Y., Pettersson S., Kundu P. Microbial Metabolites and Intestinal Stem Cells Tune Intestinal Homeostasis. Proteomics. 2020;20:e1800419. doi: 10.1002/pmic.201800419. - DOI - PubMed
    1. Yatsunenko T., Rey F.E., Manary M.J., Trehan I., Dominguez-Bello M.G., Contreras M., Magris M., Hidalgo G., Baldassano R.N., Anokhin A.P., et al. Human gut microbiome viewed across age and geography. Nature. 2012;486:222–227. doi: 10.1038/nature11053. - DOI - PMC - PubMed
    1. Candela M., Perna F., Carnevali P., Vitali B., Ciati R., Gionchetti P., Rizzello F., Campieri M., Brigidi P. Interaction of probiotic Lactobacillus and Bifidobacterium strains with human intestinal epithelial cells: Adhesion properties, competition against enteropathogens and modulation of IL-8 production. Int. J. Food Microbiol. 2008;125:286–292. doi: 10.1016/j.ijfoodmicro.2008.04.012. - DOI - PubMed

MeSH terms