. 2021 Dec 29;23(1):376.
doi: 10.3390/ijms23010376.

Iron-Chelation Treatment by Novel Thiosemicarbazone Targets Major Signaling Pathways in Neuroblastoma

Affiliations

Iron-Chelation Treatment by Novel Thiosemicarbazone Targets Major Signaling Pathways in Neuroblastoma

Peter Macsek et al. Int J Mol Sci. .

Abstract

Despite constant advances in the field of pediatric oncology, the survival rate of high-risk neuroblastoma patients remains poor. The molecular and genetic features of neuroblastoma, such as MYCN amplification and stemness status, have established themselves not only as potent prognostic and predictive factors but also as intriguing targets for personalized therapy. Novel thiosemicarbazones target both total level and activity of a number of proteins involved in some of the most important signaling pathways in neuroblastoma. In this study, we found that di-2-pyridylketone 4-cyclohexyl-4-methyl-3-thiosemicarbazone (DpC) potently decreases N-MYC in MYCN-amplified and c-MYC in MYCN-nonamplified neuroblastoma cell lines. Furthermore, DpC succeeded in downregulating total EGFR and phosphorylation of its most prominent tyrosine residues through the involvement of NDRG1, a positive prognostic marker in neuroblastoma, which was markedly upregulated after thiosemicarbazone treatment. These findings could provide useful knowledge for the treatment of MYC-driven neuroblastomas that are unresponsive to conventional therapies.

Keywords: DpC; EGFR; MYC; NDRG1; lipid droplet; neuroblastoma; thiosemicarbazone.


Conflict of interest statement

The authors declare no conflict of interest.

Figures

Figure 1
Figure 1
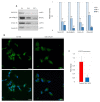
NDRG1 is upregulated in neuroblastoma cells in response to iron-chelation therapy by DpC. (A) Immunoblotting of NDRG1 protein levels in neuroblastoma cell lines treated with 20 μM (SH-SY5Y, SK-N-BE(2)) or 2 μM (CHLA-15, CHLA-20) DpC. Representative images of three independent experiments. Source data are provided in Figure S1. (B) Massive increase of NDRG1 (green) expression in DpC-treated cells in comparison to control. Immunofluorescence micrographs of SH-SY5Y cells treated with 20 μM DpC for 48 h. Nuclei counterstained with Hoechst 33342 (blue). Scale bar: 20 μm.
Figure 2
Figure 2
EGFR is downregulated in response to iron-chelation therapy by DpC. (A) Immunoblotting of EGFR protein levels in neuroblastoma cell lines treated with 20 μM (SH-SY5Y, SK-N-BE(2)) or 2 μM (CHLA-15, CHLA-20) DpC. Representative images (left) and relative optical density values (right) of three independent experiments. Source data are provided in Figure S1. Densitometry data are shown as the mean ± SD normalized to 0 h values. * p < 0.05; ** p < 0.01, two-tailed unpaired t-test.
Figure 3
Figure 3
Silencing of NDRG1 rescues the effect of DpC on total levels of EGFR in the SH-SY5Y cell line but not in SK-N-BE(2). (A) Immunoblotting of NDRG1 and EGFR protein levels in SH-SY5Y cells treated with 20 μM DpC for 48 h and specific siRNAs for NDRG1 (siNDRG1#1 and siNDRG1#2) or negative silencer control (siN.C.). (B) Immunoblotting of NDRG1 and EGFR protein levels in SK-N-BE(2) cells treated with 20 μM DpC for 48 h and specific siRNAs for NDRG1 (siNDRG1#1 and siNDRG1#2) or negative silencer control (siN.C.). Representative images (left) and relative optical density values (right) of three independent experiments. Densitometry data are shown as the mean ± SD normalized to siN.C. values. * p < 0.05; ** p < 0.01; two-tailed unpaired t-test.
Figure 4
Figure 4
DpC downregulates the levels of phosphotyrosine-EGFR. (A) Immunoblotting of phosphorylated forms of EGFR in the SH-SY5Y neuroblastoma cell line treated with 20 μM DpC. Representative images (left) and relative optical density values (right) of three independent experiments. Source data are provided in Figure S1. Densitometry data are shown as the mean ± SD normalized to 0 h values. * p < 0.05; ** p < 0.01; two-tailed unpaired t-test. (B) Immunofluorescence micrographs of EGFR (green) in SH-SY5Y cells treated with 20 μM DpC and EGF (40 ng/mL; 10 min; 37 °C). Nuclei counterstained with Hoechst 33342 (blue). Scale bar: 20 μm. (C,D) Quantification of pY1068-EGFR protein levels in response to DpC treatment (20 μM; 48 h) in SH-SY5Y cells. Median fluorescence intensity (MFI) ± SD comprised of three independent experiments. * p < 0.05; ** p < 0.01; two-tailed unpaired t-test.
Figure 5
Figure 5
Array profiling of stress response proteins and kinase phosphorylation in response to DpC in the SH-SY5Y cell line. (A) Stress response protein profile of cells treated with 20 μM DpC for 24 and 48 h. (B) Hierarchical clustering of relative stress protein expression. (C) Phospho-kinase protein profile of cells treated with 20 μM DpC for 24 and 48 h.
Figure 6
Figure 6
DpC regulates total and phosphorylated AKT protein levels in neuroblastoma cell lines. (A) Immunoblotting of AKT and (B) immunoblotting of pAKT (S473) protein levels in neuroblastoma cells treated with 20 μM (SH-SY5Y, SK-N-BE(2)) or 2 μM (CHLA-15, CHLA-20) DpC. Representative images (up) and relative optical density values (down) of three independent experiments. Source data are provided in Figure S1. Densitometry data are shown as the mean ± SD normalized to 0 h values. * p < 0.05; ** p < 0.01; two-tailed unpaired t-test.
Figure 7
Figure 7
DpC downregulates MYC proteins in neuroblastoma cell lines. (A) Immunoblotting of c-MYC (SH-SY5Y, CHLA-15, CHLA-20) and N-MYC (SK-N-BE(2)) protein levels in neuroblastoma cells treated with 20 μM (SH-SY5Y) or 2 μM (CHLA-15, CHLA-20) DpC. Representative images (left) and relative optical density values (right) of three independent experiments. Source data are provided in Figure S1. Densitometry data are shown as the mean ± SD normalized to 0 h values. * p < 0.05; ** p < 0.01; two-tailed unpaired t-test. (B) Immunofluorescence micrographs of c-MYC (green) in SH-SY5Y cells treated with 20 μM DpC and EGF (40 ng/mL; 10 min; 37 °C). Nuclei counterstained with Hoechst 33342 (blue). Scale bar = 20 μm. (C) qRT–PCR analysis of the effect of 20 μM DpC on the expression of MYCN in the SK-N-BE(2) cell line. Fold change ± SD comprised of three independent experiments. * p < 0.05; ** p < 0.01; two-tailed unpaired t-test.
Figure 8
Figure 8
Lipid accumulation in SH-SY5Y neuroblastoma cells in response to DpC treatment. (A) Light-microscopy micrograms revealing spherical bodies in the cytoplasm of SH-SY5Y cells. (B) Neutral lipid staining of DpC-treated cells by Oil Red O (red, left) and LipidTOX™ Green (green, right). Nuclei counterstained with Hoechst 33342 (blue). Scale bar: 20 μm. (C,D) Increase in the median fluorescence intensity (MFI) of LipidTOX™ Green emission after DpC treatment. MFI ± SD comprised of three independent experiments. ** p < 0.01.
Figure 9
Figure 9
Graphical overview of the major molecular targets affected by DpC treatment in neuroblastoma. Black arrows indicate findings of this study. Blue arrows represent existing knowledge (see references), providing a mechanistic insight into the effects of thiosemicarbazones in the context of neuroblastoma cells. DpC suppressed the expression of EGFR and MYC proteins in all studied neuroblastoma cell lines. Additionally, the treatment induced a massive increase in NDRG1 levels, as well as lipid droplet accumulation. Although the involvement of NDRG1 in lipid accumulation has been suggested in neuroblastoma [61] and other cell types [62,63], the underlying mechanism is still unclear (dashed line).

Similar articles

Cited by

References

    1. Matthay K.K., Maris J.M., Schleiermacher G., Nakagawara A., Mackall C.L., Diller L., Weiss W.A. Neuroblastoma. Nat. Rev. Dis. Prim. 2016;2:1–21. doi: 10.1038/nrdp.2016.78. - DOI - PubMed
    1. Nuchtern J.G., London W.B., Barnewolt C.E., Naranjo A., McGrady P.W., Geiger J.D., Diller L., Schmidt M., Lou Maris J.M., Cohn S.L. et al. A prospective study of expectant observation as primary therapy for neuroblastoma in young infants: A children’s oncology group study. Ann. Surg. 2012;256:573. doi: 10.1097/SLA.0b013e31826cbbbd. - DOI - PMC - PubMed
    1. Baker D.L., Schmidt M.L., Cohn S.L., Maris J.M., London W.B., Buxton A., Stram D., Castleberry R.P., Shimada H., Sandler A., et al. Outcome after Reduced Chemotherapy for Intermediate-Risk Neuroblastoma. N. Engl. J. Med. 2010;363:1313–1323. doi: 10.1056/NEJMoa1001527. - DOI - PMC - PubMed
    1. Johnsen J.I., Dyberg C., Wickström M. Neuroblastoma—A Neural Crest Derived Embryonal Malignancy. Front. Mol. Neurosci. 2019;12:9. doi: 10.3389/fnmol.2019.00009. - DOI - PMC - PubMed
    1. Park J.R., Bagatell R., London W.B., Maris J.M., Cohn S.L., Mattay K.M., Hogarty M. Children’s Oncology Group’s 2013 blueprint for research: Neuroblastoma. Pediatr. Blood Cancer. 2013;60:985–993. doi: 10.1002/pbc.24433. - DOI - PubMed

MeSH terms

Substances