. 2021 Dec 30;23(1):388.
doi: 10.3390/ijms23010388.

Platelet Mitochondrial Bioenergetics Reprogramming in Patients with Urothelial Carcinoma

Affiliations

Platelet Mitochondrial Bioenergetics Reprogramming in Patients with Urothelial Carcinoma

Patrik Palacka et al. Int J Mol Sci. .

Abstract

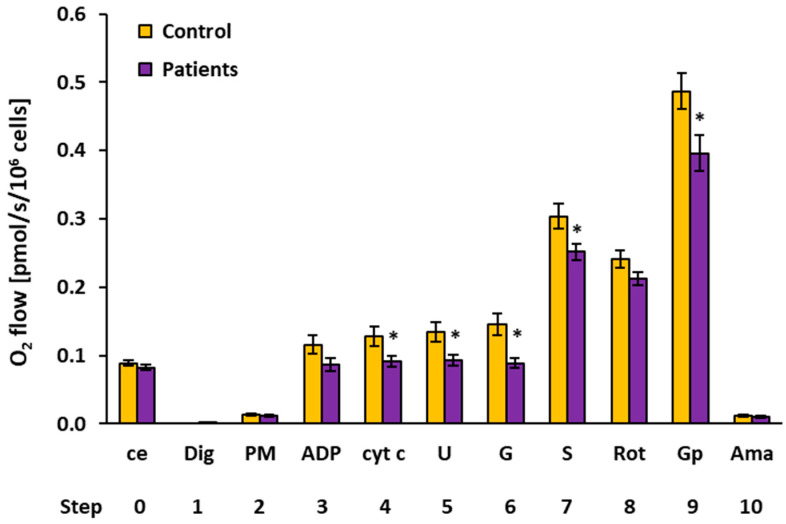
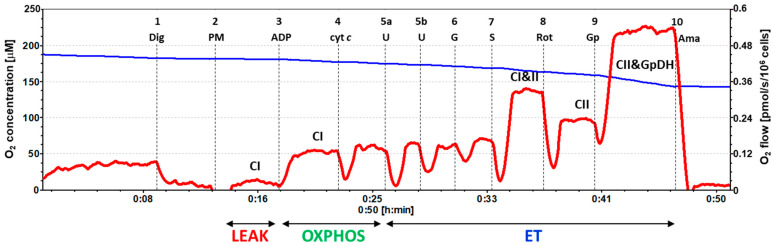
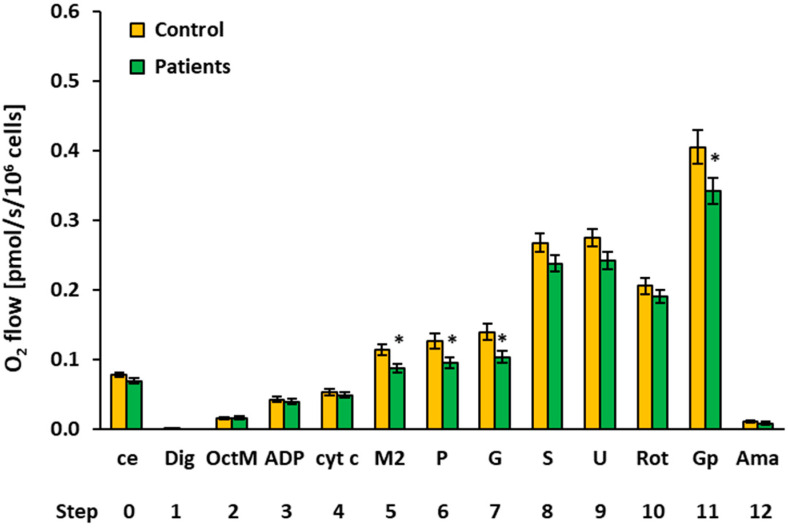
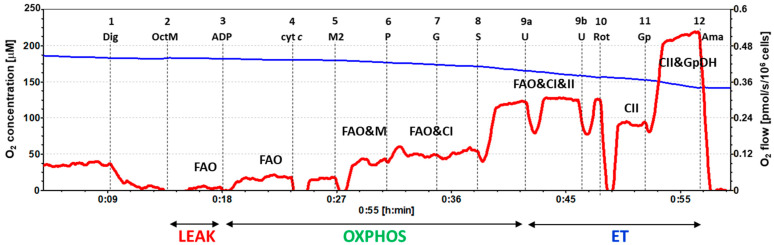
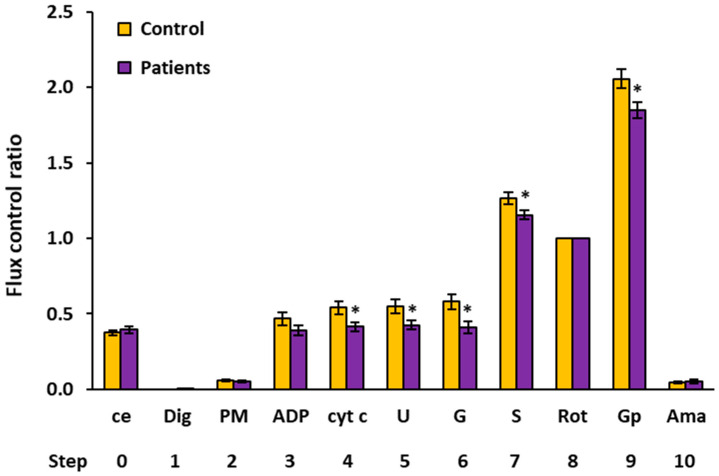
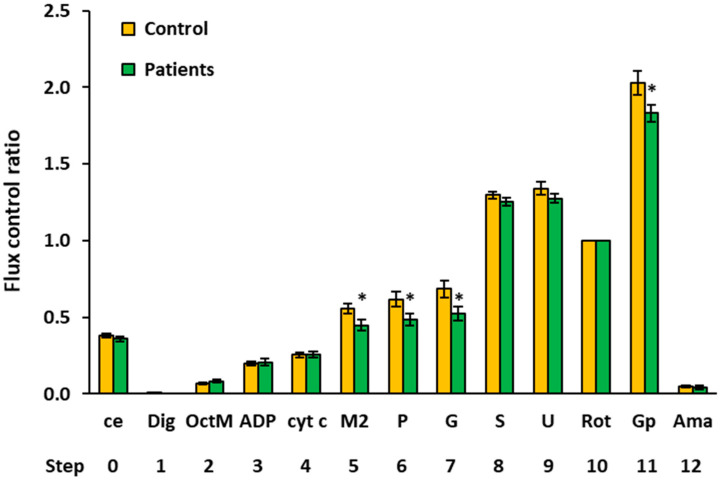
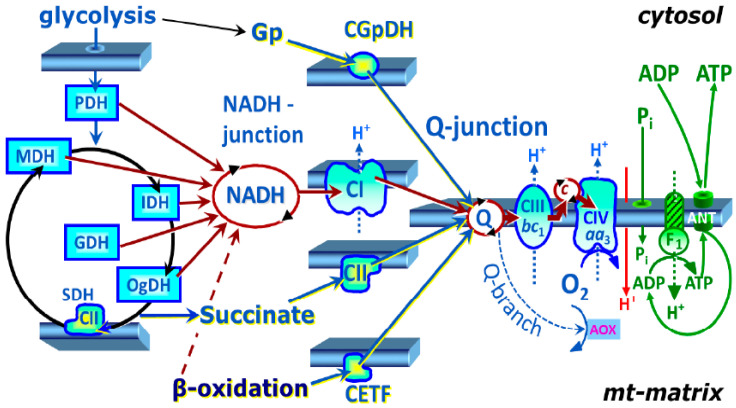
Mitochondrial bioenergetics reprogramming is an essential response of cells to stress. Platelets, an accessible source of mitochondria, have a crucial role in cancer development; however, the platelet mitochondrial function has not been studied in urothelial carcinoma (UC) patients. A total of 15 patients with UC and 15 healthy controls were included in the study. Parameters of platelet mitochondrial respiration were evaluated using the high-resolution respirometry method, and the selected antioxidant levels were determined by HPLC. In addition, oxidative stress was evaluated by the thiobarbituric acid reactive substances (TBARS) concentration in plasma. We demonstrated deficient platelet mitochondrial respiratory chain functions, oxidative phosphorylation (OXPHOS), and electron transfer (ET) capacity with complex I (CI)-linked substrates, and reduced the endogenous platelet coenzyme Q10 (CoQ10) concentration in UC patients. The activity of citrate synthase was decreased in UC patients vs. controls (p = 0.0191). γ-tocopherol, α-tocopherol in platelets, and β-carotene in plasma were significantly lower in UC patients (p = 0.0019; p = 0.02; p = 0.0387, respectively), whereas the plasma concentration of TBARS was increased (p = 0.0022) vs. controls. The changes in platelet mitochondrial bioenergetics are consistent with cell metabolism reprogramming in UC patients. We suppose that increased oxidative stress, decreased OXPHOS, and a reduced platelet endogenous CoQ10 level can contribute to the reprogramming of platelet mitochondrial OXPHOS toward the activation of glycolysis. The impaired mitochondrial function can contribute to increased oxidative stress by triggering the reverse electron transport from the CoQ10 cycle (Q-junction) to CI.

Keywords: mitochondrial bioenergetics; oxidative stress; platelets; reprogramming; urothelial carcinoma.


Conflict of interest statement

The authors declare no conflict of interest.

Figures

Figure 1
Figure 1
Platelet mitochondrial respiration by SUIT protocol 1 [17] measured in freshly isolated platelets expressed as O2 flow (pmol/s/106 cells). A total of 200 × 106 platelets were used in a 2 mL chamber of an O2k-respirometer. The respiration was measured in mitochondrial respiration medium MiR05 with 20 mM creatine at 37 °C under continuous stirring at 750 rpm. The columns show mean ± sem of the respiratory capacities after titration steps indicated on the x-axis. ce: intact cells; Dig: digitonin; PM: pyruvate plus malate; ADP: adenosine diphosphate; cyt c: cytochrome c; U: uncoupler; G: glutamate; S: succinate; Rot: rotenone; Gp: glycerophosphate; Ama: antimycin A. All substrates were titrated in kinetically saturating concentrations, and the uncoupler FCCP was titrated in optimum concentration to reach the maximum flux. The respiratory rates at step 9, Gp are 20–30% lower than the respiratory capacity at this state due to the use of lower than optimum uncoupler concentration at this titration step (see Section 4 for details). Control: the control group; Patients: the patients with UC. * p < 0.05—statistically significant difference vs. the control group.
Figure 2
Figure 2
The trace from the measurement of platelet mitochondrial respiration in freshly isolated platelets following SUIT protocol 1. The blue line represents oxygen concentration (µM) and the red trace represents oxygen consumption as flow per cells (pmol O2/s/106 cells). A total of 200 × 106 platelets were used in a 2 mL chamber of an O2k-respirometer. The respiration was measured in mitochondrial respiration medium MiR05 with 20 mM creatine at 37 °C under continuous stirring at 750 rpm. The protocol includes the following titration steps: 1—digitonin (Dig); 2—pyruvate plus malate (PM); 3 —ADP; 4—cytochrome c (cyt c); 5a,b—uncoupler (U); 6—glutamate (G); 7—succinate (S); 8—rotenone (Rot); 9—glycerophosphate (Gp); 10—antimycin A (Ama). All substrates and inhibitors were added in saturating concentrations, and the uncoupler FCCP was titrated in optimum concentration to reach the maximum O2 flow at given respiratory state. The O2 flow after Step 9, Gp is 20–30% lower than the CII&GpDH-pathway respiratory capacity, as additional uncoupler titration is necessary to reach the maximum O2 flow at this state. The labels above the red trace indicate mitochondrial pathways involved in the respiratory rate: CI—complex I pathway; CI&II—complex I and complex II pathway; CII—complex II pathway; CII&GpDH—complex II and glycerophosphate dehydrogenase complex pathway; LEAK—non-phosphorylating resting state of respiration; OXPHOS—the phosphorylating state of respiration; ET—noncoupled state of respiration at optimum uncoupler concentration.
Figure 3
Figure 3
Platelet mitochondrial respiration by SUIT protocol 2 ([18], modified) measured in freshly isolated platelets expressed as O2 flow (pmol/s/106 cells). A total of 200 × 106 platelets were used in a 2 mL chamber of an O2k-respirometer. The respiration was measured in mitochondrial respiration medium MiR05 with 20 mM creatine at 37 °C under continuous stirring at 750 rpm. The columns show mean ± sem of the respiratory capacities after titration steps indicated on the x-axis. ce: intact cells; Dig: digitonin; OctM: octanoylcarnitine plus 0.1 mM malate saturating FAO; ADP: adenosine diphosphate; cyt c: cytochrome c; M2: 2 mM malate saturating I-linked respiration in the presence of pyruvate; p: pyruvate; G: glutamate; S: succinate; U: uncoupler; Rot: rotenone; Gp: glycerophosphate; Ama: antimycin A. All substrates were titrated in kinetically saturating concentrations, and the uncoupler FCCP was titrated in optimum concentration to reach the maximum O2 flow. The respiratory rates at step 11, Gp are 20–30% lower than the respiratory capacity at this state due to the use of lower than optimum uncoupler concentration at this titration step (for more details, see Section 4 ). Control: control group; Patients: the patients with urothelial carcinoma. * p < 0.05—statistically significant difference vs. the control group.
Figure 4
Figure 4
The trace from the measurement of platelet respiration in freshly isolated platelets following SUIT protocol 2. The blue line represents oxygen concentration (µM) and the red trace represents oxygen consumption as flow per cells (pmol O2/s/106 cells). A total of 200 × 106 platelets were used in a 2 mL chamber of an O2k-respirometer. The respiration was measured in mitochondrial respiration medium MiR05 with 20 mM creatine at 37 °C under continuous stirring at 750 rpm. The protocol includes following titration steps: 1—digitonin (Dig); 2—octanoylcarnitine plus 0.1 mM malate saturating FAO (OctM); 3—ADP; 4—cytochrome c (cyt c); 5—2 mM malate (M2) saturating CI-linked respiration in the presence of pyruvate; 6—pyruvate (P), 7—glutamate (G); 8—succinate (S); 9—uncoupler (U); 10—rotenone (Rot); 11—glycerophosphate (Gp); 12—antimycin A (Ama). All substrates and inhibitors were added in saturating concentrations, and the uncoupler FCCP was titrated in optimum concentration to reach the maximum O2 flow at given respiratory state. The O2 flow after Step 11, Gp is 20–30% lower than the CII&GpDH-pathway respiratory capacity, as additional uncoupler titration is necessary to reach the maximum O2 flow at this state. The labels above the red trace indicate mitochondrial pathways involved in the respiratory rate: FAO—fatty acid oxidation pathway; FAO&M—fatty acid oxidation and malate pathway; FAO&CI—fatty acid oxidation and complex I pathway; FAO&CI&II—fatty acid oxidation and complex I and complex II pathway; CII—complex II pathway; CII&GpDH—complex II and glycerophosphate dehydrogenase complex pathway; LEAK—non-phosphorylating resting state of respiration; OXPHOS—the phosphorylating state of respiration; ET—noncoupled state of respiration at optimum uncoupler concentration.
Figure 5
Figure 5
Flux control ratios of respiratory capacities measured in freshly isolated platelets by SUIT protocol 1. The CII-linked ET capacity (step 8) served as common reference state. The columns show mean ± sem of the FCR (relative units) after titration steps indicated on the x-axis. ce: intact cells; Dig: digitonin; PM: pyruvate plus malate; ADP: adenosine diphosphate; cyt c: cytochrome c; U: uncoupler; G: glutamate; S: succinate; Rot: rotenone; Gp: glycerophosphate; Ama: antimycin A. Control: the control group; Patients: the patients with UC. * p < 0.05—statistically significant difference vs. the control group. For more details, see Section 4 and the legend for Figure 1 and Figure 2 and Table 4.
Figure 6
Figure 6
Flux control ratios of respiratory capacities measured in freshly isolated platelets by SUIT protocol 2. The CII-linked ET capacity (Step 10) served as common reference state. The columns show mean ± sem of the FCR (relative units) after titration steps indicated on the x-axis. ce: intact cells; Dig: digitonin; OctM: octanoylcarnitine plus 0.1 mM malate saturating FAO; ADP: adenosine diphosphate; cyt c: cytochrome c; M2: 2 mM malate saturating CI-linked respiration in the presence of pyruvate; P: pyruvate; G: glutamate; S: succinate; U: uncoupler; Rot: rotenone; Gp: glycerophosphate; Ama: antimycin A; Control: control group; Patients: the patients with UC. * p < 0.05—statistically significant difference vs. the control group. For more details, see Section 4 and the legend for Figure 3 and Figure 4 and Table 5.
Figure 7
Figure 7
Mitochondrial electron transfer system—convergent electron transfer at the NADH-junction and Q-junction—© Gnaiger (2020), copied from [49] with permission. Electrons flow to oxygen from complex I (CI) or complex II (CII) and other flavoproteins, providing multiple entries into the Q-cycle (Q-junction). In the complete tricarboxylic acid (TCA) cycle in the living cell with the influx of pyruvate, electrons flow into Q-junction converges according to an NADH: succinate ratio of 4:1. Advanced SUIT protocols are designed for reconstitution of TCA cycle function and sequential separation of segments of mitochondrial pathways for OXPHOS analysis [48]. PDH—pyruvate dehydrogenase, MDH—malate dehydrogenase, IDH—isocitrate dehydrogenase, GDH—glutamate dehydrogenase, OgDH—2-oxoglutarate dehydrogenase, SDH—succinate dehydrogenase (CII), CETF—electron transfer flavoprotein complex, CGpDH—glycerophosphate dehydrogenase complex, Gp—glycerophosphate, ANT—adenine nucleotide translocase, AOX—alternative oxidase, bc1—the cytochrome b and cytochrome c1 of complex III (CIII), aa3—the cytochrome a and cytochrome a3 of cytochrome c oxidase (CIV), F1—the F1 subunit of ATP synthase attached to the transmembrane Fo subunit, Q—Q-cycle of coenzyme Q, mt-matrix—mitochondrial matrix.

Similar articles

Cited by

References

    1. Bray F., Ferlay J., Soerjomataram I., Siegel R.L., Torre L.A., Jemal A. Global cancer statistics 2018: GLOBOCAN estimates of incidence and mortality worldwide for 36 cancers in 185 countries. CA Cancer J. Clin. 2018;68:394–424. doi: 10.3322/caac.21492. - DOI - PubMed
    1. Kamat A.M., Hegarty P.K., Gee J.R., Clark P.E., Svatek R.S., Hegarty N., Shariat S.F., Xylinas E., Schmitz-Dräger B.J., Lotan Y., et al. International consultation on urologic disease—European association of urology consultation on bladder cancer 2012. ICUD-EAU international consultation on bladder cancer 2012: Screening, diagnosis, and molecular markers. Eur Urol. 2013;63:4–15. doi: 10.1016/j.eururo.2012.09.057. - DOI - PubMed
    1. Humphrey P.A., Moch H., Cubilla A.L., Ulbright T.M., Reuter V.E. The 2016 WHO classification of tumours of the urinary system and male genital organs—Part B: Prostate and bladder tumours. Eur. Urol. 2016;70:106–119. doi: 10.1016/j.eururo.2016.02.028. - DOI - PubMed
    1. Black A.J., Black P.C. Variant histology in bladder cancer: Diagnostic and clinical implications. Transl. Cancer Res. 2020;18:6565–6575. doi: 10.21037/tcr-20-2169. - DOI - PMC - PubMed
    1. Gasic G.J., Gasic T.B., Galanti N., Johnson T., Murphy S. Platelet-tumor-cell interactions in mice. The role of platelets in the spread of malignant disease. Int. J. Cancer. 1973;11:704–718. doi: 10.1002/ijc.2910110322. - DOI - PubMed

MeSH terms