. 2021 Dec 30;23(1):400.
doi: 10.3390/ijms23010400.

Two Novel Dimorphism-Related Virulence Factors of Zymoseptoria tritici Identified Using Agrobacterium-Mediated Insertional Mutagenesis

Affiliations

Two Novel Dimorphism-Related Virulence Factors of Zymoseptoria tritici Identified Using Agrobacterium-Mediated Insertional Mutagenesis

Alexander Yemelin et al. Int J Mol Sci. .

Abstract

Diseases caused by dimorphic phytopathogenic and systemic dimorphic fungi have markedly increased in prevalence in the last decades, and understanding the morphogenic transition to the virulent state might yield novel means of controlling dimorphic fungi. The dimorphic fungus Z. tritici causes significant economic impact on wheat production, and yet the regulation of the dimorphic switch, a key first step in successful plant colonization, is still largely unexplored in this fungus. The fungus is amenable to suppression by fungicides at this switch point, and the identification of the factors controlling the dimorphic switch provides a potential source of novel targets to control Septoria tritici blotch (STB). Inhibition of the dimorphic switch can potentially prevent penetration and avoid any damage to the host plant. The aim of the current work was to unveil genetic determinants of the dimorphic transition in Z. tritici by using a forward genetics strategy. Using this approach, we unveiled two novel factors involved in the switch to the pathogenic state and used reverse genetics and complementation to confirm the role of the novel virulence factors and further gained insight into the role of these genes, using transcriptome analysis via RNA-Seq. The transcriptomes generated potentially contain key determinants of the dimorphic transition.

Keywords: RNA-Seq; Zymoseptoria tritici; dimorphic switch; forward genetics; fungal dimorphism; melanin; mycelium; pseudohyphal growth; reverse genetics; transcriptomic analysis.


Conflict of interest statement

The authors declare that the research was conducted in the absence of any commercial or financial relationships that could be construed as a potential conflict of interest.

Figures

Figure 1
Figure 1
(A) Structure of the predicted target genes MYCO5 and MYCO56 and the position of the inserts in the mutants. Sites of T-DNA integration (HPT) in the genes are indicated. The numbers indicate the length of the annotated genes. The highlighted bars show the functional domains present in the predicted gene products and found by using InterProScan. Black lines indicate intron, and gray bars indicate exons. (B) Phenotypes of the mutants are shown by macroscopic analysis of colony morphology after 21 days’ growth on minimal medium (MM), N-deprivation medium and YEG medium. The micrographs (DIC) indicate the spore morphology following 3 days’ growth in YEG liquid medium.
Figure 2
Figure 2
Virulence of Z. tritici Δmyco5 and Δmyco56 strains. The effects of the gene deletion on disease development in the susceptible wheat cv. Riband after 21 days after inoculation (dpi) are indicated. The wild-type IPO323 and ΔZthog1 are used as positive and attenuated virulence controls, while “mock” is a negative control (inoculated with water only). Infections were carried out at 22 °C with 80% humidity and a 16 h/8 h light cycle. The strain Δmyco5 proved to be non-pathogenic, while Δmyco56 strains, such as ΔZthog1, are severely reduced in virulence. Successful infection was observed for IPO323, which formed mature pycnidia at 21 dpi. Full virulence was completely restored for the complementation strains Δmyco5/MYCO5 and Δmyco56/MYCO56 generated by reintroduction of the full-length genes in the respective mutants.
Figure 3
Figure 3
Transcriptome analysis of the strains IPO323, Δmyco5, Δmyco56 and ΔZthog1 grown under the dimorphic switch inducing condition. (A) Pie chart showing the custom categories of the products of all the DE genes (375) obtained from RNA-Seq analysis that were categorized by using data obtained from JGI server and Blast2GO analysis. Significant differential expression was defined as average expression altered by a factor >2.5× at one instance of pairwise comparisons across all the strains investigated and with a q-value threshold of less than or equal to 0.05. (B) Identification of virulence genes. Searches using the predicted amino acid sequences from the set of DE genes was undertaken by using BLASTp (E-value cutoff of ≤10−30) against the PHI-Base database (version 4.1) to assess potential involvement in host–pathogen interaction. (C) Pie charts showing the biological categories of all the DE genes obtained from the RNA-Seq studies. The pie chart shows the percentage of the genes expressed for each biological process. Biological categories were assigned manually based on the presence of conserved functional domains, GO annotation and/or the best meaningful match, using BLASTp. Genes identified by using Cuffdiff-analysis were filtered for an absolute fold-change value ≥2.5 and q-value threshold of 0.05. (D) Functional groupings of up- and downregulated DE gene products. Bar charts show a functional classification based on the manual annotation of the DE genes for each strain-specific transcriptome. Red bars represent functional categories for products of the genes with reduced transcript abundance, while the green bars represent those for those with increased transcript abundance. The total number of down- and upregulated genes for each biological category is also indicated.
Figure 4
Figure 4
GO enrichment analysis of differentially expressed genes in ΔZthog1, Δmyco5 and Δmyco56. GO terms enriched in the DE genes for each of the mutant strains studied (ZtHOG1, MYCO5 and MYCO56) were analyzed with the aid of the TopGO package in R, and the first fifty GO clusters were processed by using the web-based tool REVIGO. GO terms’ redundancy was subtracted, and the GO terms for biological processes were clustered in TreeMap plots, where each rectangle represents a single cluster. Similar colors of the rectangles indicate semantic similarity. The magnitude of the rectangles reflects the p-value obtained from TopGO analysis (the larger the size, the smaller the p-value and the greater the enrichment factor for respective GO term). For the TreeMaps, the adjoining table shows those GO clusters identified by using TopGO evaluation and which were significantly enriched according to classic Fisher analysis with a p-value ≤ 0.05.
Figure 5
Figure 5
Histogram indicating the distribution of the BLASTp hits of DE genes. The predicted amino acid sequences of the 375 DE genes from the RNA-Seq analysis were searched by using the NCBI “nr”-database to identify potential homologs. Gene products with just 1, 2 or 3 orthologues in other fungal species were considered as potentially “unique” or “Z. tritici-specific”, and thus represent attractive candidate genes for further study.
Figure 6
Figure 6
Growth of IPO323 and the mutant strains at elevated temperatures. (A) Axenic growth of Zymoseptoria tritici wild-type and generated mutant strains at increased temperature. YEG-grown cultures of the wild-type strain IPO323 and mutant strains Δmyco5 and Δmyco56 were spotted onto YEG/PDA plates as serial dilutions (1.5 μL; 5 × 10⁷ spores/mL). Cultures were imaged following 7 days’ growth at 28 °C. (B) Axenic cultures of Z. tritici strains showed unusual cell aggregates and clumpy growth in the Δmyco5 strain in PDA or YEG and for the Δmyco56 strain in PDA. Cultures were agitated prior to imaging. Cultures for each condition were routinely incubated in 100 mL flasks, without baffles, for one week, with shaking at 120 rpm. Before imaging, strains were transferred to glass tubes. For Δmyco5, a drastically reduced growth was apparent at elevated temperatures.
Figure 7
Figure 7
Susceptibility of mutant strains to oxidative stress. (A) Morphologies of colonies of Z. tritici IPO323 and the mutants generated in the current study under oxidative stress. Wild-type strain and mutant strains were spotted as 1.5 μL spots from a 5 × 10⁷ spores/mL spore suspension and grown on YEG agar medium, with the concentrations of H2O2 indicated. Plates were documented following 7 days’ growth at 18 °C. ZtHOG1 is more susceptible to oxidative stress, while Δmyco5 has a slightly reduced growth. (B) Transcription of the potential (chloro)peroxidases, catalase and superoxide-dismutase-encoding genes identified by using RNA-Seq data. Gene-expression data were clustered in one dimension by hierarchical agglomerative clustering with complete linkage. One minus Pearson correlation was used as the similarity metric for the Z. tritici strains. The detected expression profiles reveal, on average, a lower expression of listed genes in the case of Δmyco5 and ΔZthog1, while Δmyco56 was the highest. Red asterisks (*) show DE transcripts with significantly changed transcription in at least two strains.
Figure 8
Figure 8
Colony morphology of Zymoseptoria tritici IPO323 and the mutants studied during transient metal stress. Δmyco5 had increased sensitivity to elevated levels of metal ions. Strains were grown as YEG cultures and then spotted from a spore suspension (1.5 μL; 5 × 10⁷ spores/mL) to YEG solid medium supplemented with 5 mM CuSO4 and 10 mM ZnSO4. Plates were imaged following 7 days’ growth at 18 °C.
Figure 9
Figure 9
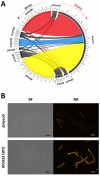
Aberrant lipid metabolism in the strain Δmyco5. (A) CircosPlot visualization of the RNA-Seq transcriptomic data regarding the genes predicted to encode phospholipases and esterases. Zt105080, Zt109795 and Zt81448 were shown to be highly transcribed in Δmyco5 compared to WT and other the strains examined. (B) Imaging the lipid content of the Δmyco5 strain. Localization of neutral lipids was visualized by Nile Red staining in IPO323 and the Δmyco5 strain. BF, bright field microscopy; NR, Nile Red staining.
Figure 10
Figure 10
Δmyco5 mutant shows reduced proteolytic activity. (A) Growth assay of the mutant strains and IPO323 on N-deprivation medium supplemented with 1% skimmed milk to visualize the proteolytic activity. Strains were inoculated as 1.5 µL drops of a 5 × 10⁷ spores/mL spore suspension and grown for 7 days at 18 °C. The clearing zones around the colonies show extracellular protease activity. Scale bar is 20 μm. (B) A heat map indicating the transcript abundance (FPKM values) of differentially expressed genes which are predicted to encode proteases. Transcript data were clustered in two dimensions by hierarchical agglomerative clustering with complete linkage. One minus Pearson correlation was employed as the similarity metric. Red asterisks (*) show DE genes which are predicted to code for extracellular proteases.
Figure 11
Figure 11
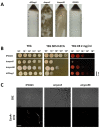
Involvement of MYCO5 and MYCO56 in cell-wall-integrity maintenance. (A) Pellet stability analysis was carried out by centrifugation at 4000 rpm of the strains cultured in YEG fluid medium for 4 days at 18 °C. After centrifugation, all pellets were directly documented. (B) Sensitivity of the mutant strains to cell-wall-perturbing agents. strains were grown on YEG medium with 0.01% SDS or 2 mg/mL Congo Red (CR) for 7 days at 18 °C. Four spots of 1.5 microliter of 1 × 10⁸ spores/mL spore suspension were inoculated on the plate. (C) Investigation of mutant strain’s cell wall toward the Concanavalin-A (ConA-FITC), using fluorescent microscopy. Δmyco5 and Δmyco56 showed altered staining compared to IPO323 both in the number of cells which bound ConA-FITC and the intensity of fluorescent signal. Scale bar = 20 μm.

Similar articles

Cited by

References

    1. Kettles G.J., Kanyuka K. Dissecting the molecular interactions between wheat and the fungal pathogen Zymoseptoria tritici. Front. Plant Sci. 2016;7:508. doi: 10.3389/fpls.2016.00508. - DOI - PMC - PubMed
    1. Orton E.S., Deller S., Brown J.K. Mycosphaerella graminicola: From genomics to disease control. Mol. Plant Pathol. 2011;12:413–424. doi: 10.1111/j.1364-3703.2010.00688.x. - DOI - PMC - PubMed
    1. Rudd J.J. Previous bottlenecks and future solutions to dissecting the Zymoseptoria tritici–wheat host-pathogen interaction. Fungal Genet. Biol. 2015;79:24–28. doi: 10.1016/j.fgb.2015.04.005. - DOI - PMC - PubMed
    1. Yang F., Li W., Jørgensen H.J. Transcriptional reprogramming of wheat and the hemibiotrophic pathogen Septoria tritici during two phases of the compatible interaction. PLoS ONE. 2013;8:e81606. doi: 10.1371/journal.pone.0081606. - DOI - PMC - PubMed
    1. Brunner P.C., Torriani S.F., Croll D., Stukenbrock E.H., McDonald B.A. Coevolution and life cycle specialization of plant cell wall degrading enzymes in a hemibiotrophic pathogen. Mol. Biol. Evol. 2013;30:1337–1347. doi: 10.1093/molbev/mst041. - DOI - PMC - PubMed

MeSH terms

Supplementary concepts

LinkOut - more resources