

Ganglioside GD2 Enhances the Malignant Phenotypes of Melanoma Cells by Cooperating with Integrins
- PMID: 35008849
- PMCID: PMC8745508
- DOI: 10.3390/ijms23010423
Ganglioside GD2 Enhances the Malignant Phenotypes of Melanoma Cells by Cooperating with Integrins
Abstract
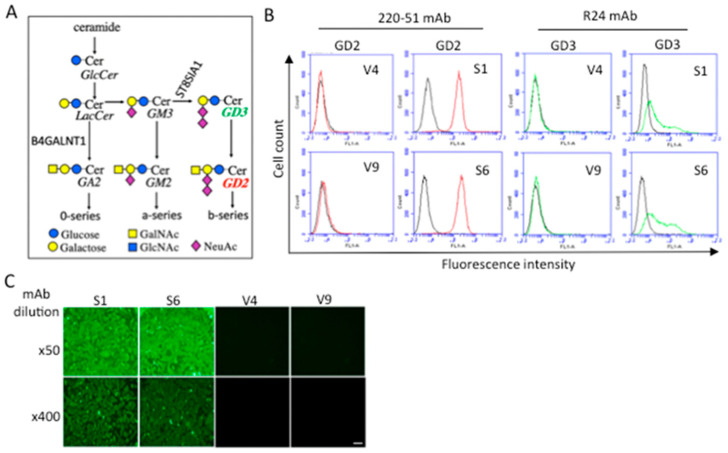
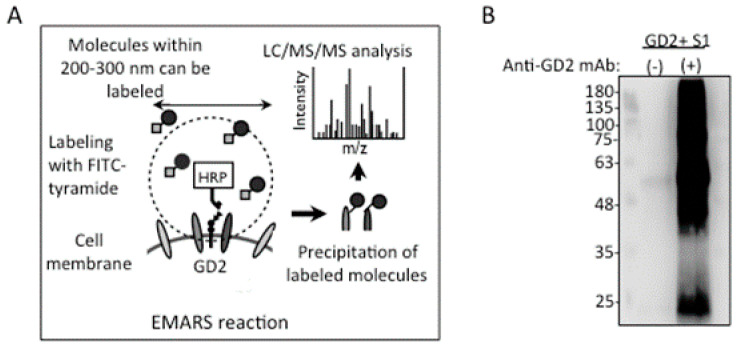
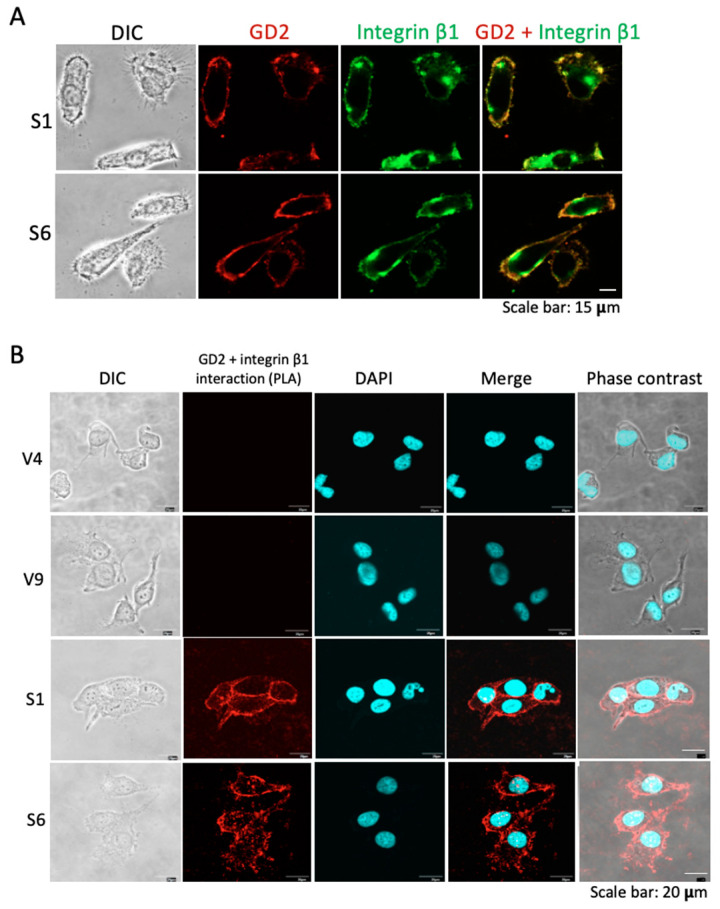
Gangliosides have been considered to modulate cell signals in the microdomain of the cell membrane, lipid/rafts, or glycolipid-enriched microdomain/rafts (GEM/rafts). In particular, cancer-associated gangliosides were reported to enhance the malignant properties of cancer cells. In fact, GD2-positive (GD2+) cells showed increased proliferation, invasion, and adhesion, compared with GD2-negative (GD2-) cells. However, the precise mechanisms by which gangliosides regulate cell signaling in GEM/rafts are not well understood. In order to analyze the roles of ganglioside GD2 in the malignant properties of melanoma cells, we searched for GD2-associating molecules on the cell membrane using the enzyme-mediated activation of radical sources combined with mass spectrometry, and integrin β1 was identified as a representative GD2-associating molecule. Then, we showed the physical association of GD2 and integrin β1 by immunoprecipitation/immunoblotting. Close localization was also shown by immuno-cytostaining and the proximity ligation assay. During cell adhesion, GD2+ cells showed multiple phospho-tyrosine bands, i.e., the epithelial growth factor receptor and focal adhesion kinase. The knockdown of integrin β1 revealed that the increased malignant phenotypes in GD2+ cells were clearly cancelled. Furthermore, the phosphor-tyrosine bands detected during the adhesion of GD2+ cells almost completely disappeared after the knockdown of integrin β1. Finally, immunoblotting to examine the intracellular distribution of integrins during cell adhesion revealed that large amounts of integrin β1 were localized in GEM/raft fractions in GD2+ cells before and just after cell adhesion, with the majority being localized in the non-raft fractions in GD2- cells. All these results suggest that GD2 and integrin β1 cooperate in GEM/rafts, leading to enhanced malignant phenotypes of melanomas.
Keywords: GEM/rafts; cancer-associated antigen; ganglioside; integrin; melanoma.
Conflict of interest statement
Both Memorial Sloan Kettering Cancer Center (MSK) and NKC have financial interest in Y-mAbs, Abpro-Labs and Eureka Therapeutics. NKC reports receiving commercial research grants from Y-mabs Therapeutics. NKC was named as inventor on multiple patents filed by MSK, including those licensed to Y-mabs Therapeutics, Biotec Pharmacon, and Abpro-labs. NKC is a SAB member for Eureka Therapeutics.
Figures


Similar articles
-
Action Mechanisms of Exosomes Derived from GD3/GD2-Positive Glioma Cells in the Regulation of Phenotypes and Intracellular Signaling: Roles of Integrins.Int J Mol Sci. 2024 Nov 27;25(23):12752. doi: 10.3390/ijms252312752. Int J Mol Sci. 2024. PMID: 39684463 Free PMC article.
-
Ganglioside GD3 enhances adhesion signals and augments malignant properties of melanoma cells by recruiting integrins to glycolipid-enriched microdomains.J Biol Chem. 2010 Aug 27;285(35):27213-27223. doi: 10.1074/jbc.M109.087791. Epub 2010 Jun 25. J Biol Chem. 2010. PMID: 20581115 Free PMC article.
-
GM1 / GD1b / GA1 synthase expression results in the reduced cancer phenotypes with modulation of composition and raft-localization of gangliosides in a melanoma cell line.Cancer Sci. 2010 Sep;101(9):2039-47. doi: 10.1111/j.1349-7006.2010.01613.x. Cancer Sci. 2010. PMID: 20594196 Free PMC article.
-
Disialyl gangliosides enhance tumor phenotypes with differential modalities.Glycoconj J. 2012 Dec;29(8-9):579-84. doi: 10.1007/s10719-012-9423-0. Epub 2012 Jul 5. Glycoconj J. 2012. PMID: 22763744 Review.
-
Essential roles of gangliosides in the formation and maintenance of membrane microdomains in brain tissues.Neurochem Res. 2012 Jun;37(6):1185-91. doi: 10.1007/s11064-012-0764-7. Epub 2012 Apr 10. Neurochem Res. 2012. PMID: 22488331 Review.
Cited by
-
Action Mechanisms of Exosomes Derived from GD3/GD2-Positive Glioma Cells in the Regulation of Phenotypes and Intracellular Signaling: Roles of Integrins.Int J Mol Sci. 2024 Nov 27;25(23):12752. doi: 10.3390/ijms252312752. Int J Mol Sci. 2024. PMID: 39684463 Free PMC article.
-
Desensitizing the autonomic nervous system to mitigate anti-GD2 monoclonal antibody side effects.Front Oncol. 2024 May 15;14:1380917. doi: 10.3389/fonc.2024.1380917. eCollection 2024. Front Oncol. 2024. PMID: 38812778 Free PMC article.
-
Confronting Melanoma Radioresistance: Mechanisms and Therapeutic Strategies.Cancers (Basel). 2025 Aug 14;17(16):2648. doi: 10.3390/cancers17162648. Cancers (Basel). 2025. PMID: 40867277 Free PMC article. Review.
-
Crucial roles of exosomes secreted from ganglioside GD3/GD2-positive glioma cells in enhancement of the malignant phenotypes and signals of GD3/GD2-negative glioma cells.Nagoya J Med Sci. 2024 Aug;86(3):435-451. doi: 10.18999/nagjms.86.3.435. Nagoya J Med Sci. 2024. PMID: 39355364 Free PMC article.
-
Safety and antitumor activity of GD2-Specific 4SCAR-T cells in patients with glioblastoma.Mol Cancer. 2023 Jan 9;22(1):3. doi: 10.1186/s12943-022-01711-9. Mol Cancer. 2023. PMID: 36617554 Free PMC article. Clinical Trial.
References
-
- Wiegandt H. Gangliosides. In: Wiegandt H., editor. Glycolipids. Elsevier; New York, NY, USA: 1985. pp. 199–259.
-
- Nagai Y., Tsuji S. Significance of ganglioside-mediated glycosignal transduction in neuronal differentiation and development. Prog. Brain Res. 1994;101:119–126. - PubMed
-
- Lloyd K.O., Old L.J. Human monoclonal antibodies to gly- colipids and other carbohydrate antigens: Dissection of the humoral im- mune response in cancer patients. Cancer Res. 1989;49:3445–3451. - PubMed
-
- Houghton A.N., Mintzer D., Cordon-Cardo C., Welt S., Fliegel B., Vadhan S., Carswell E., Melamed M.R., Oettgen H.F., Old L.J. Mouse monoclonal IgG3 antibody detecting GD3 ganglioside: A phase I trial in patients with malignant melanoma. Proc. Natl. Acad. Sci. USA. 1985;82:1242–1246. doi: 10.1073/pnas.82.4.1242. - DOI - PMC - PubMed
MeSH terms
Substances
Grants and funding
LinkOut - more resources
Full Text Sources
Medical
Research Materials
