. 2021 Dec 31;23(1):440.
doi: 10.3390/ijms23010440.

Novel Purine Derivative ITH15004 Facilitates Exocytosis through a Mitochondrial Calcium-Mediated Mechanism

Affiliations

Novel Purine Derivative ITH15004 Facilitates Exocytosis through a Mitochondrial Calcium-Mediated Mechanism

Ricardo de Pascual et al. Int J Mol Sci. .

Abstract

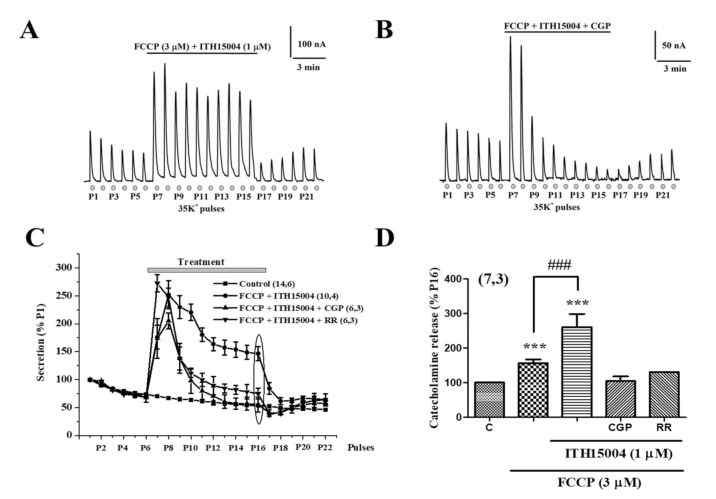
Upon depolarization of chromaffin cells (CCs), a prompt release of catecholamines occurs. This event is triggered by a subplasmalemmal high-Ca2+ microdomain (HCMD) generated by Ca2+ entry through nearby voltage-activated calcium channels. HCMD is efficiently cleared by local mitochondria that avidly take up Ca2+ through their uniporter (MICU), then released back to the cytosol through mitochondrial Na+/Ca2+ exchanger (MNCX). We found that newly synthesized derivative ITH15004 facilitated the release of catecholamines triggered from high K+-depolarized bovine CCs. Such effect seemed to be due to regulation of mitochondrial Ca2+ circulation because: (i) FCCP-potentiated secretory responses decay was prevented by ITH15004; (ii) combination of FCCP and ITH15004 exerted additive secretion potentiation; (iii) such additive potentiation was dissipated by the MICU blocker ruthenium red (RR) or the MNCX blocker CGP37157 (CGP); (iv) combination of FCCP and ITH15004 produced both additive augmentation of cytosolic Ca2+ concentrations ([Ca2+]c) K+-challenged BCCs, and (v) non-inactivated [Ca2+]c transient when exposed to RR or CGP. On pharmacological grounds, data suggest that ITH15004 facilitates exocytosis by acting on mitochondria-controlled Ca2+ handling during K+ depolarization. These observations clearly show that ITH15004 is a novel pharmacological tool to study the role of mitochondria in the regulation of the bioenergetics and exocytosis in excitable cells.

Keywords: ITH15004; calcium signalling; catecholamine release; chromaffin cell; mitochondria; neurodegeneration.


Conflict of interest statement

The authors declare no conflict of interest.

Figures

Figure 1
Figure 1
Chemical formula of compound ITH15004: [2-(6-chloro-9H-purin-9-yl)-1-(2, 4-dichlorophenyl) ethenone].
Figure 2
Figure 2
Facilitation of exocytosis by compound ITH15004. The exocytotic release of catecholamines was triggered by sequential stimulation of fast-perifused bovine chromaffin cells (BCCs) with a 35 mM K+, low Na+ solution (35K+) during 5 s at 3 min intervals (bottom dots in panels (A) and (B), 22 pulses were applied, P1 to P22). (A), original record of secretory responses, showing a gradual decay in control cells. (B), original record of secretory responses elicited by 35K+ challenges in cells that were exposed to compound ITH15004 during the time period indicated by the top horizontal bar. Insets in A and B are calibration bars (secretion of catecholamines in nA versus time). (C), normalized averaged secretion expressed as percentage of P6 in each individual experiment (ordinate), expressing the time course (abscissa) of secretory spike amplitude in control cells and cells exposed to ITH15004 (top horizontal bar, pulses P7 to P16). Data are means ± SEM of the number of experiments (n) and the different cell cultures (N) shown in parentheses (n,N). (D), pooled data on the concentration-response effects of ITH15004 in enhancing the secretory responses to 35K+ pulses. Data are normalized as percentage of P16 and correspond to the last pulse P16 in both control cells (100% ordinate) and cells exposed to increasing concentrations of ITH15004 (abscissa) (points marked with an ellipse in panel (C)). They are means ± SEM of the number of experiments (n) and separate cell cultures (N) shown in parenthesis (n,N). * p < 0.05, ** p < 0.01, *** p < 0.001 with respect to control.
Figure 3
Figure 3
Compound ITH15004 still augments the secretory responses elicited by 35K+, in BCCs with their endoplasmic reticulum (ER) calcium store depleted. ER depletion is caused by cell exposure to the CRT mixture (20 mM caffeine, 1 µM ryanodine, 1 µM thapsigargin). (A), original record of secretory responses before, during CRT exposure and after its washout. (B), original record of secretory responses before, during CRT or CRT+ITH15004 cell exposure, as indicated by top horizontal lines. Insets, calibration bars. (C), averaged quantitative data of secretory responses normalized as percentage of P6 in each individual experiment. (D), secretory responses normalized to P16 (ellipse in panel (C)), in the presence of CRT alone or combined CRT plus ITH15004. Data are means ± SEM of the number of experiments (n) and distinct cell cultures (N) shown in parenthesis (n,N). *** p < 0.001 with respect to control; ### with respect CRT.
Figure 4
Figure 4
Effects of ITH15004 on the secretory responses elicited by 35K+ pulses, in cells exposed to the protonophore FCCP. (A), original record of secretion responses before, during FCCP cell exposure (top horizontal line) and after its washout. Inset, calibration bars (secretion in nA and time). (B), original record of secretory responses before and during cell exposure to FCCP (top horizontal line), and during cell exposure to ITH15004 added on top of FCCP during the time period indicated by the horizontal bar. Inset, calibration bars on secretion in nA and time in min. (C), pooled data on the time course of secretory response elicited by 35K+ pulses in control conditions (bottom curve) and during cell exposure to FCCP alone or to combined FCCP plus ITH15004, according to the time periods marked by the top horizontal lines. Data are means ± SEM of the number of experiments (n) and different cell cultures (N) shown in parenthesis. (D), pooled data on the experiments shown in panel C at P16 (ellipse); they represent the effects of FCCP alone and of FCCP combined with increasing concentrations of ITH15004 (bottom horizonal lines). Data are means ± SEM of the number of experiments (n) and separate cell cultures (N) shown in parenthesis (n,N). * p < 0.05, ** p < 0.01, *** p < 0.001 with respect control. ### p < 0.001 with respect to FCCP alone.
Figure 5
Figure 5
Effects of simultaneous cell exposure to FCCP+ITH15004 on secretory responses triggered by 35K+ in BCCs, upon the pharmacological manipulation of calcium handling bye mitochondria. (A), original record on secretory responses before and during cell exposure to FCCP+ITH15004, during the time period marked by the horizontal top line. Inset, calibration bars of spike secretion amplitude in nA and time in minutes. (B), original record on secretory responses before and during cell exposure to combined FCCP+ITH15004 + CGP37157. (C), averaged data normalized to P1 (ordinates), on the time course of secretory responses in control cells (bottom curves) and cells exposed to combined FCCP+ITH15004, to FCCP+ITH15004+CGP37157 or to combined FCCP, ITH15004 and ruthenium red (1 μM) (top bar on treatments). Data are means ± SEM of the number of experiments (n) and different cell cultures (N) shown in parentheses. (D), pooled data normalized as percentage of P16 (as indicated by the ellipse in panel C) (ordinate) on the effects of the different treatments namely, FCCP alone, FCCP+ITH15004 (ITH), FCCP+ITH15004+CGP37157 at 1 μM (CGP) and FCCP+ITH15004+ ruthenium red (RR). Data are means ± SEM of the number of experiments (n) done in different cultures (N) shown in parenthesis (n,N). *** p < 0.001 with respect control (C). ### p < 0.001 with respect to FCCP alone.
Figure 6
Figure 6
ITH15004 (ITH) mildly blocks the whole-cell current through VACCs in voltage-clamped BCCs using 2 mM external Ba2+ as charge carrier. The protocol shown on top of panel A was used to elicit IBa by sequential 50 ms pulses to −10 mV (peak current) from a holding potential of −80 mV. (A), family of original Ba2+ current records obtained in control conditions (note the initial peak in each trace, corresponding to sodium current, INa), and the traces obtained after 1 min exposure of the cell to 1 µM ITH15004 (ITH), combined ITH+1 µM ω-conotoxin GVIA (GVIA), or combined ITH+GVIA+10 µM nifedipine (Nife). Inset, calibration bars of currents (pA) and time (ms). (B), time course of the normalized IBa (initial current amplitude = 100%, ordinate) and its blockade by cumulative additions of ITH15004, GVIA and Nife, as indicated by the top horizontal bars. Abscissa, time in seconds. (C), pooled data on the blockade of IBa (normalized as percentage of the initial IBa peak, ordinate) elicited by cumulative addition of ITH, then GVIA (G) and finally nifedipine (N). WO, washout. Data are means ± SEM of the number of cells tested (n) from different cell cultures (N) shown in parenthesis (n,N). *** p < 0.001 with respect control. ### p < 0.001 with respect to ITH15004 alone.
Figure 7
Figure 7
ITH15004 augments the cytosolic calcium signals ([Ca2+]c) elicited by 35K+ pulses applied to fluo-4-loaded BCCs. Cells seeded in 96 well black plates were exposed to increasing concentrations of ITH15004 10 s before their stimulation with a pulse of 35K+. (A), family of [Ca2+]c traces normalized to the initial baseline in the absence (Control) and the presence of the indicated concentrations of ITH15004. Inset, calibration bars in net increases of arbitrary fluorescence units (AFU), versus time (s). (B), [Ca2+]c signals elicited by 35K+, in absolute AFU (ordinate) versus time (abscissa), before (control) of after cell exposure to increasing concentrations of ITH15004. Note the initial basal [Ca2+]c in each trace that is augmented in the presence of ITH15004 (curves are averaged from 9 experiments done in 3 different cultures). (C), quantitative averaged data on the net [Ca2+]c increase elicited by 35K+ in the absence (Control) and the presence of ITH15004 (bottom horizontal line). (D), net baseline increases (after subtracting baseline control) (ordinate) elicited by ITH15004 (abscissa). Data in panels C and D are means ± SEM of 9 experiments from 3 different cell cultures, as indicated in parenthesis * p < 0.05, ** p < 0.01, *** p < 0.001, with respect to control.
Figure 8
Figure 8
Augmentation by ITH15004 of the [Ca2+]c signals elicited by 35K+, in BCCs with their ER Ca2+ store depleted by CRT (a mixture of 20 mM caffeine, 1 µM ryanodine, and 1 µM thapsigargin). (A), CRT itself augmented the [Ca2+]c signals control response. Added on top of CRT, ITH15004 further augments the response. (B), ITH15004 augments the [Ca2+]c elevations elicited by 35K+ in cells treated with CRT, in a concentration-dependent manner. (C), pooled data on the net increases of [Ca2+]c normalized to% of control in each individual experiment (ordinate), obtained from experiments of panel B. (D), pooled data on baseline elevations, expressed in absolute AFU (ordinate). Data in C and D are means of 9 experiments from 3 different cultures, as indicated in parenthesis. * p < 0.05, ** p < 0.01, *** p < 0.001 with respect to control.
Figure 9
Figure 9
Effects of ITH15004 combined with FCCP on 35K+ elicited [Ca2+]c elevations and the effects of RR 1 µM or CGP371757 (CGP, 3 µM). (A,B) original traces and pooled data on the effects of FCCP alone and FCCP plus increasing concentrations of ITH15004, respectively, on the [Ca2+]c transients elicited by 35K+. (C,D) similar experiments but with a combination of FCCP+RR+increasing concentrations of ITH15004. (E,F), similar experiments (as in (A,B)) but with a combination of FCCP (FC)+CGP plus increasing concentrations of ITH15004. (G,H), similar experiments with combined FCCP (FC)+JNJ-47965567+increasing concentrations of ITH15004. Pooled data in panels B, D, F, H are means ± SEM of 9 experiments from 3 different cell cultures, as indicated in parenthesis. ** p < 0.01, *** p < 0.001 with respect control (C). Panels B and H; ## p < 0.01, ### p < 0.001 respect to FCCP (B) or FCCP+JNJ (H).

Similar articles

Cited by

References

    1. Carbone E., Borges R., Eiden L.E., Garcia A.G., Hernandez-Cruz A. Chromaffin Cells of the Adrenal Medulla: Physiology, Pharmacology, and Disease. Compr. Physiol. 2019;9:1443–1502. - PubMed
    1. Douglas W.W. Stimulus-secretion coupling: The concept and clues from chromaffin and other cells. Br. J. Pharmacol. 1968;34:453–474. doi: 10.1111/j.1476-5381.1968.tb08474.x. - DOI - PMC - PubMed
    1. Neher E. Vesicle pools and Ca2+ microdomains: New tools for understanding their roles in neurotransmitter release. Neuron. 1998;20:389–399. doi: 10.1016/S0896-6273(00)80983-6. - DOI - PubMed
    1. García A.G., García-De-Diego A.M., Gandía L., Borges R., García-Sancho J. Calcium signaling and exocytosis in adrenal chromaffin cells. Physiol. Rev. 2006;86:1093–1131. doi: 10.1152/physrev.00039.2005. - DOI - PubMed
    1. García-Sancho J., de Diego A.M., García A.G. Mitochondria and chromaffin cell function. Pflugers Arch. 2012;464:33–41. doi: 10.1007/s00424-012-1074-2. - DOI - PubMed

LinkOut - more resources