. 2022 Jan 2;23(1):497.
doi: 10.3390/ijms23010497.

MTEP, a Selective mGluR5 Antagonist, Had a Neuroprotective Effect but Did Not Prevent the Development of Spontaneous Recurrent Seizures and Behavioral Comorbidities in the Rat Lithium-Pilocarpine Model of Epilepsy

Affiliations

MTEP, a Selective mGluR5 Antagonist, Had a Neuroprotective Effect but Did Not Prevent the Development of Spontaneous Recurrent Seizures and Behavioral Comorbidities in the Rat Lithium-Pilocarpine Model of Epilepsy

Alexandra V Dyomina et al. Int J Mol Sci. .

Abstract

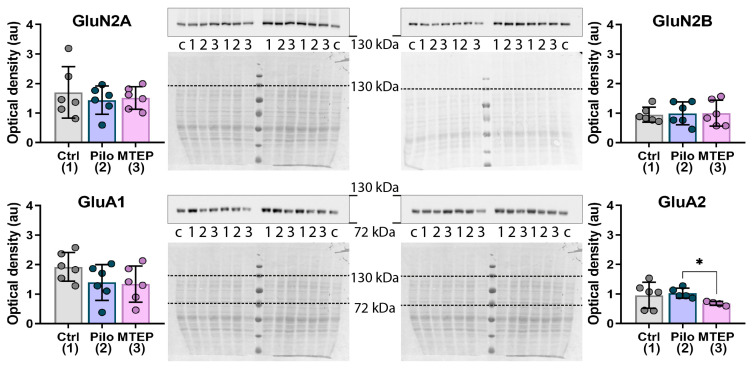
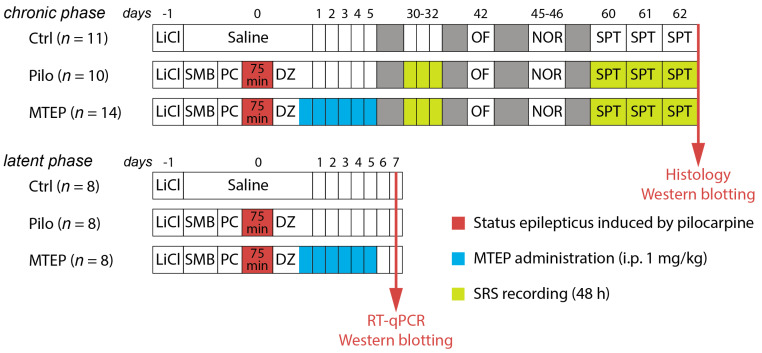
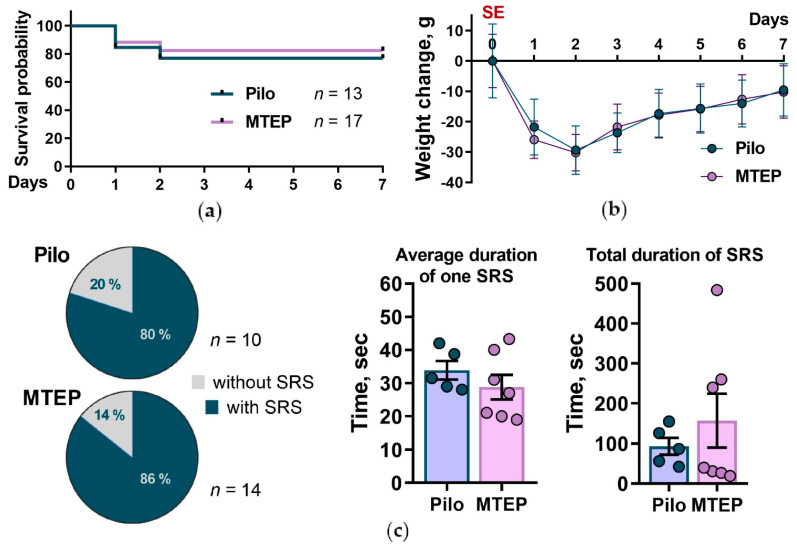
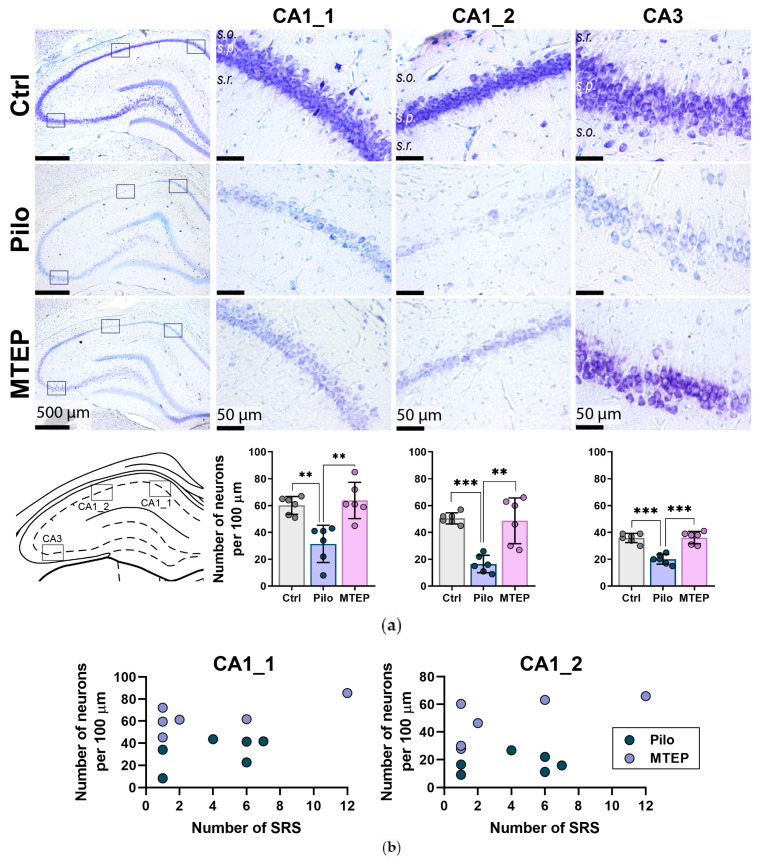
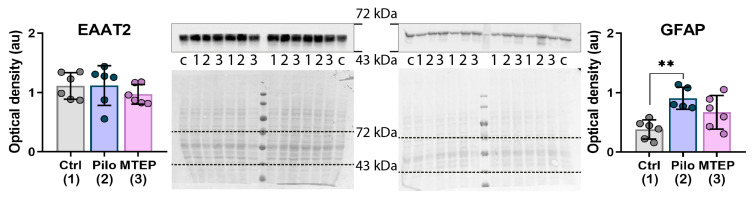
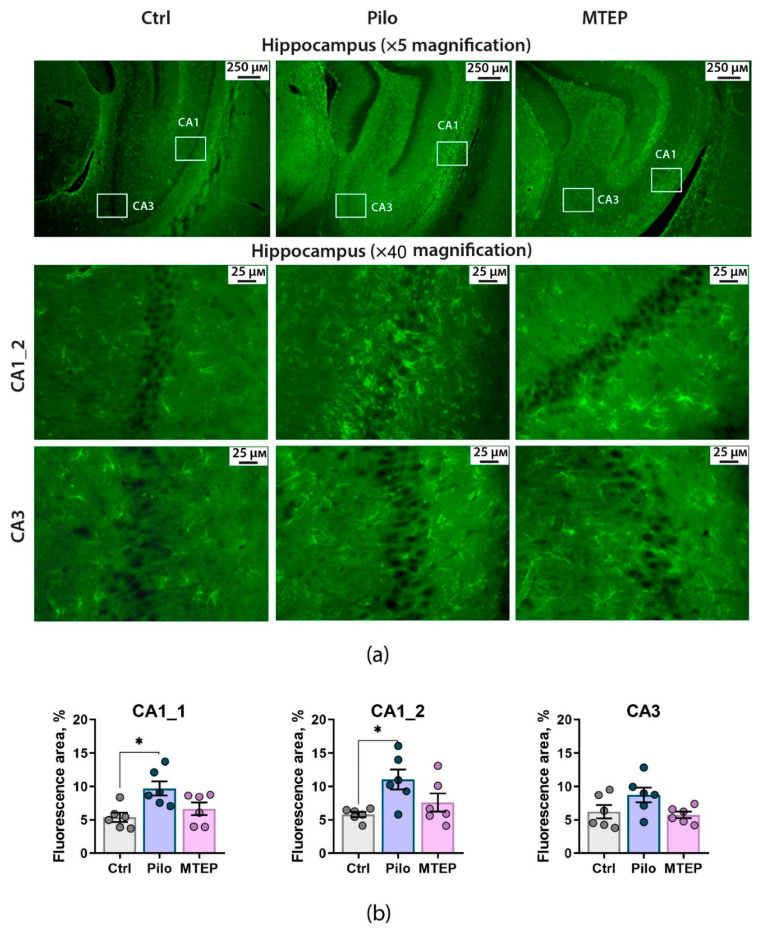
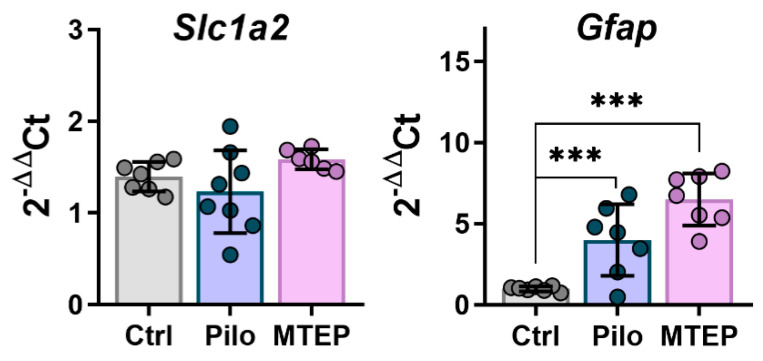
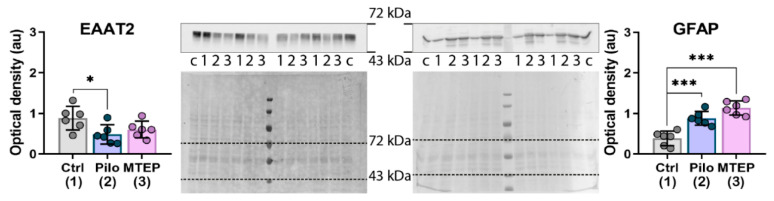
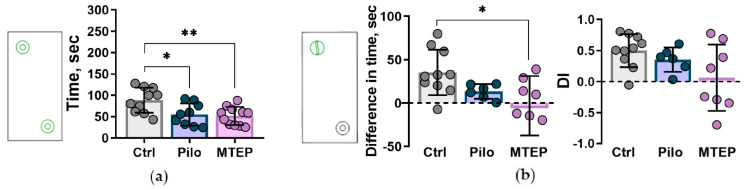
Metabotropic glutamate receptors (mGluRs) are expressed predominantly on neurons and glial cells and are involved in the modulation of a wide range of signal transduction cascades. Therefore, different subtypes of mGluRs are considered a promising target for the treatment of various brain diseases. Previous studies have demonstrated the seizure-induced upregulation of mGluR5; however, its functional significance is still unclear. In the present study, we aimed to clarify the effect of treatment with the selective mGluR5 antagonist 3-[(2-methyl-1,3-thiazol-4-yl)ethynyl]-pyridine (MTEP) on epileptogenesis and behavioral impairments in rats using the lithium-pilocarpine model. We found that the administration of MTEP during the latent phase of the model did not improve survival, prevent the development of epilepsy, or attenuate its manifestations in rats. However, MTEP treatment completely prevented neuronal loss and partially attenuated astrogliosis in the hippocampus. An increase in excitatory amino acid transporter 2 expression, which has been detected in treated rats, may prevent excitotoxicity and be a potential mechanism of neuroprotection. We also found that MTEP administration did not prevent the behavioral comorbidities such as depressive-like behavior, motor hyperactivity, reduction of exploratory behavior, and cognitive impairments typical in the lithium-pilocarpine model. Thus, despite the distinct neuroprotective effect, the MTEP treatment was ineffective in preventing epilepsy.

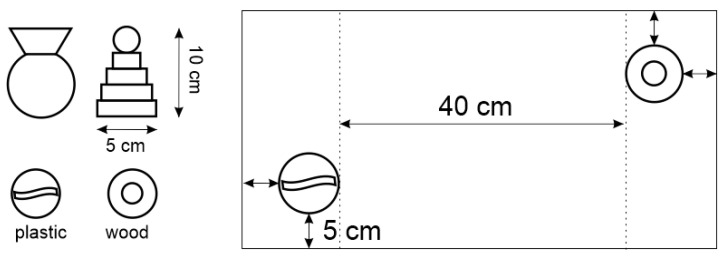
Keywords: excitatory amino acid transporter 2; glial fibrillary acidic protein; hippocampus; immunohistochemistry; neuronal loss; novel object recognition test; open field test; temporal lobe epilepsy.


Conflict of interest statement

The authors declare no conflict of interest.

Figures

Figure A1
Figure A1
Western blotting data of proteins production in the dorsal hippocampus in chronic phase. For inserts, the upper part shows the chemiluminescent signal and the lower part shows the Ponceau S. For bands, c is calibrator sample, 1 is Ctrl, 2 is Pilo, and 3 is MTEP group. On charts, each dot represents one animal; the columns indicate average values, and error bars show standard deviations. One-way ANOVA, GluN2A: F2,17 = 0.3, p = 0.75; GluN2B: F2,17 = 0.3, p = 0.99; GluA1: F2,16 = 1.9, p = 0.19, GluA2: F2,7.1 = 8.7, p = 0.012. Asterisks indicate significant differences between groups according to Games–Howell post hoc tests: * p < 0.05.
Figure 1
Figure 1
Experimental design. Pilo: rats administered with pilocarpine, MTEP: rats administered with pilocarpine and then treated with MTEP, LiCl: lithium chloride, SMB: (−)-scopolamine methyl bromide, DZ: diazepam, OF: open field test, NOR: novel object recognition, SPT: sucrose preference test, SRS: spontaneous recurrent seizure, qPCR: reverse transcription followed by a quantitative polymerase chain reaction, WB: Western blotting.
Figure 2
Figure 2
Survival and body weight dynamics in rats after lithium–pilocarpine induced status epilepticus (SE). (a) The Kaplan–Meier survival curves show no effect of MTEP treatment on survival (Gehan–Breslow–Wilcoxon test ꭓ2 = 1.3, p = 0.72). (b) Bodyweight dynamics are presented as alterations in weight relative to the average weight before SE. Only the rats that survived during the latent phase were used for bodyweight dynamics analysis (Pilo: n = 10; MTEP: n = 14). The data are presented as mean values with standard errors of the mean. Mixed ANOVA analysis showed no MTEP influence on weight dynamics (Greenhouse–Geisser F2.2,53.9 = 0.5, p = 0.7, ηp2 = 0.02). (c) Spontaneous recurrent seizure (SRS) characteristics. The percentages of rats with SRS in the Pilo and MTEP groups do not differ; data includes video-recorded seizures and attacks noted during behavioral testing (left panel). The average duration of video recorded SRS (middle panel) and total SRS time (right panel) are not affected by MTEP treatment (student’s t-test, p > 0.05 for both parameters). The bars represent mean values, the error bars represent standard errors of the mean, and the circles represent the individual values of each animal.
Figure 3
Figure 3
Nissl staining of rats’ hippocampus two months after SE showed the neuroprotective effect of MTEP therapy. (a) Three sites in the dorsal hippocampus were selected to analyze the number of neurons in the str. pyramidale (s.p.). CA1_1 is the most common site in the CA1 region for cell counting; CA1_2 is the place in the CA1 area with the most noticeable neurodegeneration. In the CA3 region, we counted neurons in the middle part of this area. The diagrams below show statistical data on the number of neurons per 100 µm length of the cellular layer. The circles show individual values per rat. The columns indicate average values and error bars show standard deviations. One-way ANOVA was performed to determine the neuroprotective effect of MTEP therapy. For CA1_1 region F2,15 = 13.4, p < 0.001, for CA1_2 F2,15 = 19.0, p < 0.001, for CA3 F2,15 = 30.6, p < 0.001. Asterisks indicate significant differences between groups according to Tukey’s post hoc tests: ** p < 0.01, *** p < 0.001. (b) Scatter plots illustrate the lack of correlation between the number of seizures and neuronal density in the CA1 area of the hippocampus. The circles show individual values.
Figure 4
Figure 4
Western blotting data of proteins production in the dorsal hippocampus in the chronic phase. For inserts, the upper part shows the chemiluminescent signal, the lower part shows the Ponceau S. For bands, c is calibrator sample, 1 is Ctrl, 2 is Pilo, and 3 is MTEP group samples. Each dot represents one animal; the columns indicate average values and error bars show standard deviations. One-way ANOVA was used to determine the effect of MTEP therapy (excitatory amino acid transporter 2 (EAAT2): F2, 17 = 0,66, p = 0.53; glial fibrillary acidic protein (GFAP): F2,16 = 8.1, p < 0.01). Asterisks indicate significant differences between groups according to Tukey’s post hoc tests: ** p < 0.01.
Figure 5
Figure 5
GFAP immunofluorescence analysis of the hippocampal tissue. (a) Representative images of hippocampal sections with GFAP-positive cells. Brain tissue was analyzed two months after pilocarpine-induced SE. Immunohistochemistry targeting glial fibrillary acidic protein (GFAP) was used to detect astrocytes. MTEP therapy reduces astrogliosis in the rat hippocampus. (b) The averaged GFAP-positive areas in different hippocampal sites: CA1_1, CA1_2, and CA3. The circles show individual values per brain. The columns indicate average values and error bars show standard errors of the means. One-way ANOVA was performed to determine the effects of MTEP therapy on astrogliosis: CA1 (F2,15 = 5.9; p < 0.05); CA2-CA1 (F2,15 = 8.4; p < 0.05); CA3 (F2,15 = 4.95; p = 0.07). Asterisks indicate significant differences between groups according to Tukey’s post hoc tests: * p < 0.05.
Figure 6
Figure 6
The relative expression of glial markers (Slc1a2 and Gfap) in the dorsal hippocampus 7 days after pilocarpine-induced SE. Each dot represents one animal; the bars indicate average values and error bars show standard deviations. One-way ANOVA: Slc1a2: F2,21 = 1.4, p = 0.3; Gfap: F2,20 = 21.5, p < 0.001. Asterisks indicate significant differences between groups according to Tukey’s post hoc tests: *** p < 0.001.
Figure 7
Figure 7
Western blotting data of proteins production in the dorsal hippocampus 7 days after pilocarpine-induced SE. For inserts, the upper part shows the chemiluminescent signal, the lower part shows the Ponceau S. For bands c is sample calibrator, 1 is Ctrl, 2 is Pilo, and 3 is MTEP group. Each dot represents one animal; the columns indicate average values and error bars show standard deviations. One-way ANOVA, GFAP: F2,17 = 29, p < 0.001; EAAT2: F2,17 = 4, p < 0.05. Asterisks indicate significant differences between groups according to Tukey’s post hoc tests: * p < 0.05, *** p < 0.001.
Figure 8
Figure 8
The relative expression of genes of NMDA and AMPA receptor subunits in the dorsal hippocampus 7 days after pilocarpine-induced SE. Subunit genes: Grin1–GluN1, Grin2a–GluN2a, Grin2b–GluN2b, Gria1–GluA1, Gria2–GluA2. Each dot represents one animal; the bars indicate average values and error bars show standard deviations. One-way ANOVA, Grin1: F2,19 = 11.8, p < 0.001; Grin2a: F2,20 = 3.7, p < 0.05; F2,20 = 1.7, p = 0.2; Gria1: F2,20 = 1.8, p = 0.2; Gria2: F2,20 = 9.1, p < 0.01. Asterisks indicate significant differences between groups according to Tukey’s post hoc tests: * p < 0.05; ** p < 0.01.
Figure 9
Figure 9
Western blotting data of proteins production in the dorsal hippocampus 7 days after pilocarpine-induced SE. For inserts, upper part in each line shows the chemiluminescent signal, lower part shows the Ponceau S. For bands c is calibrator sample, 1 is Ctrl, 2 is Pilo, and 3 is MTEP group. On charts each dot represents one animal; the columns indicate average values, and error bars show standard deviations. One-way ANOVA, GluN2A: F2,17 = 16, p < 0.001; GluN2B: F2,8.62 = 3.04, p = 0.10; GluA1: F2,16 = 25.4, p < 0.001, GluA2: F2,13 = 5.1, p < 0.05. Asterisks indicate significant differences between groups according to Tukey’s post hoc tests: * p < 0.05; ** p < 0.01, *** p < 0.001.
Figure 10
Figure 10
Sucrose solution consumption in a sucrose preference test. Welch ANOVA was used for statistical analysis–Day 1: F2,14.4 = 12.3, p < 0.001; Day 2: F2,16.6 = 7.4, p < 0.01. The circles show individual values. The columns indicate average values and error bars show standard errors of the means. Asterisks indicate differences between groups according to Games–Howell post hoc test: * p < 0.05.
Figure 11
Figure 11
Open field test. (a) Distribution of time spent in center and thigmotaxis areas of the open field. (b) Locomotion characteristics in the open field test. * p < 0.05, ** p < 0.01, *** p < 0.01 in one-way ANOVA with Tukey’s post hoc test.
Figure 12
Figure 12
Exploratory behavior and memory characteristics in the novel object recognition test. (a) The novel objects interaction paradigm: chart shows time spent interacting with identical objects. * p < 0.05, ** p < 0.01 in one-way ANOVA with Tukey’s post hoc test, F2,27 = 6.4, p = 0.005. (b) Novel object recognition: the left chart shows the difference in time spent on interaction with novel object versus familiar object, the right chart shows discrimination index (DI) for which +1 indicates a preference of the novel object, −1 indicates a preference of the familiar object, and 0 indicates no preferences. * p < 0.05 in one-way ANOVA with Tukey’s post hoc test, F2,21 = 4.8, p = 0.02. On all charts, the circles show individual values. The columns indicate average values and error bars show standard deviations.
Figure 13
Figure 13
The objects for the novel object recognition test and their mutual arrangement in Plexiglas box.

Similar articles

Cited by

References

    1. Pitkänen A., Sutula T.P. Is epilepsy a progressive disorder? Prospects for new therapeutic approaches in temporal-lobe epilepsy. Lancet Neurol. 2002;1:173–181. doi: 10.1016/S1474-4422(02)00073-X. - DOI - PubMed
    1. Elger C.E., Helmstaedter C., Kurthen M. Chronic epilepsy and cognition. Lancet Neurol. 2004;3:663–672. doi: 10.1016/S1474-4422(04)00906-8. - DOI - PubMed
    1. Josephson C.B., Jetté N. Psychiatric comorbidities in epilepsy. Int. Rev. Psychiatry. 2017;29:409–424. doi: 10.1080/09540261.2017.1302412. - DOI - PubMed
    1. Janmohamed M., Brodie M.J., Kwan P. Pharmacoresistance–Epidemiology, mechanisms, and impact on epilepsy treatment. Neuropharmacology. 2020;168:107790. doi: 10.1016/j.neuropharm.2019.107790. - DOI - PubMed
    1. Klein P., Tyrlikova I. No prevention or cure of epilepsy as yet. Neuropharmacology. 2020;168:107762. doi: 10.1016/j.neuropharm.2019.107762. - DOI - PubMed