

Integrated Transcriptome and Metabolome Analysis Reveals Key Metabolites Involved in Camellia oleifera Defense against Anthracnose
- PMID: 35008957
- PMCID: PMC8745097
- DOI: 10.3390/ijms23010536
Integrated Transcriptome and Metabolome Analysis Reveals Key Metabolites Involved in Camellia oleifera Defense against Anthracnose
Abstract
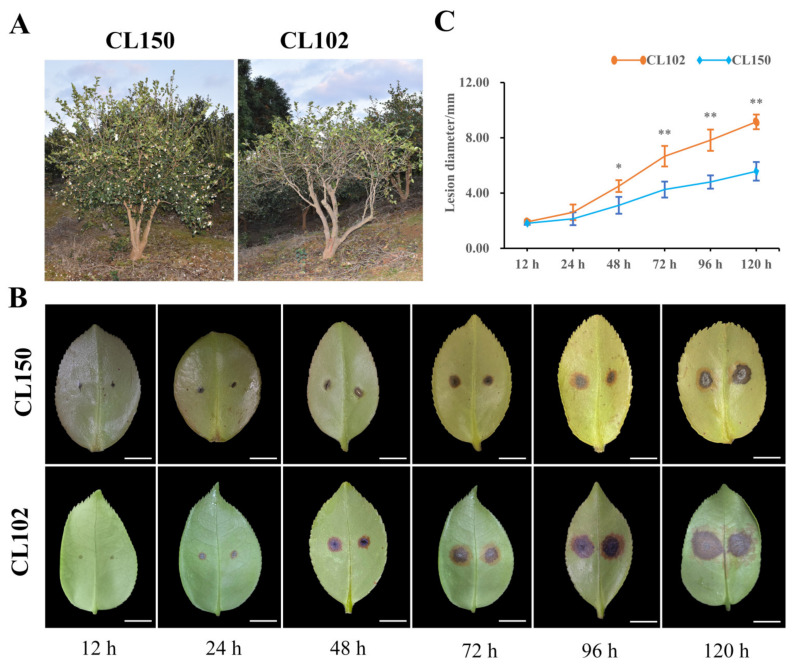
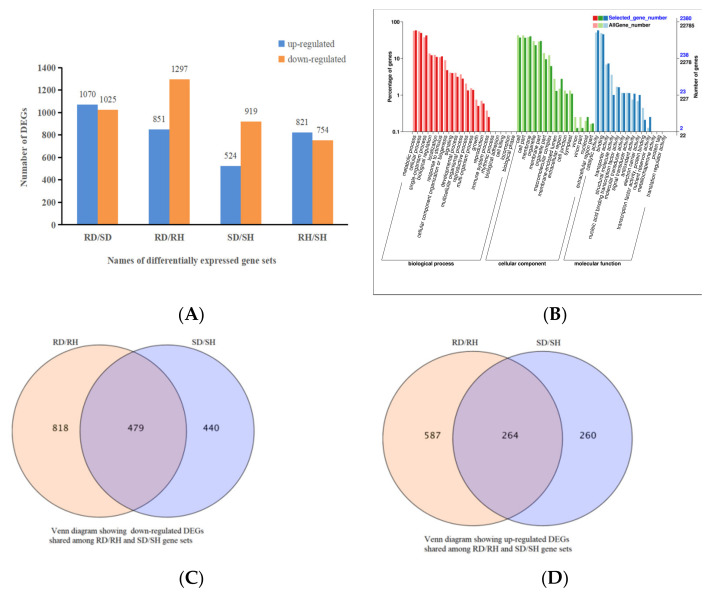
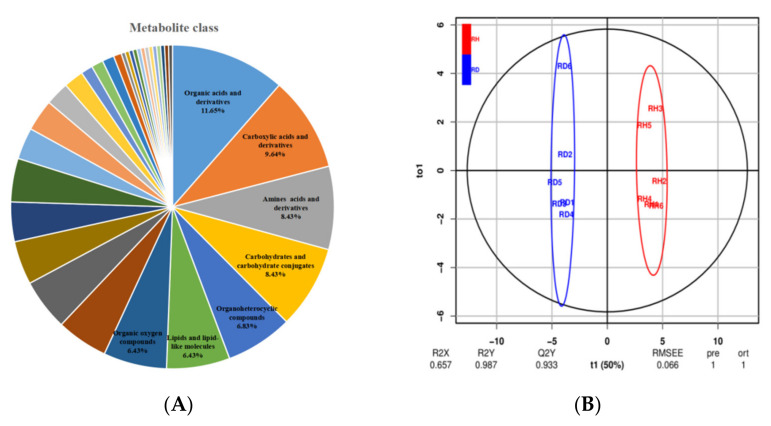
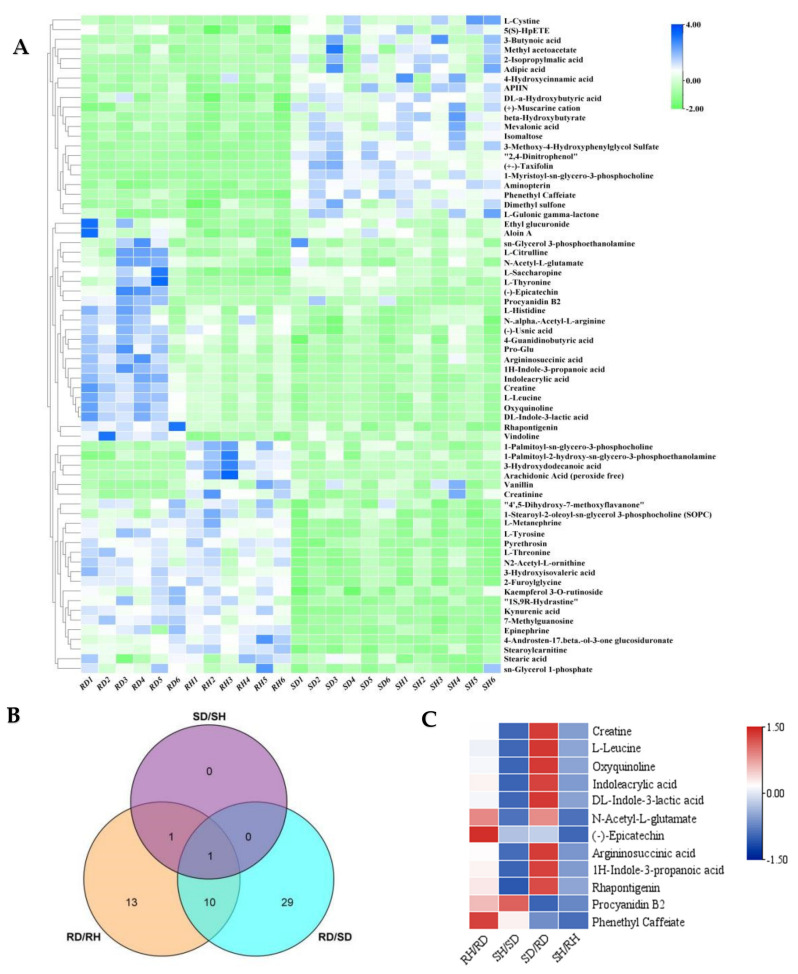
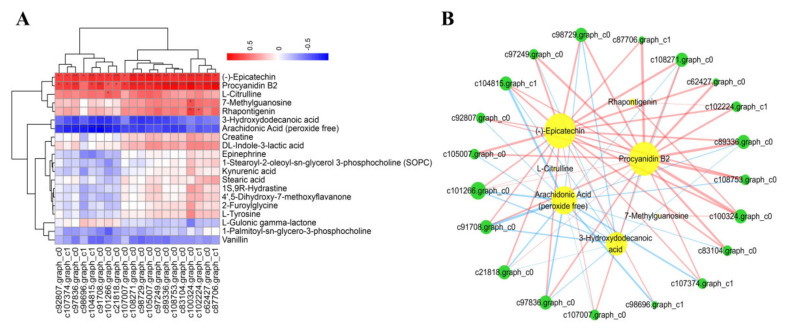
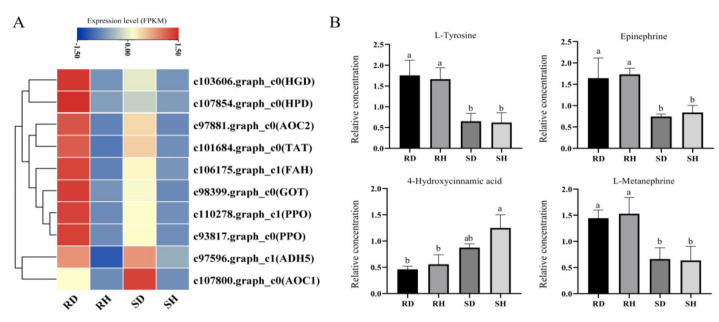
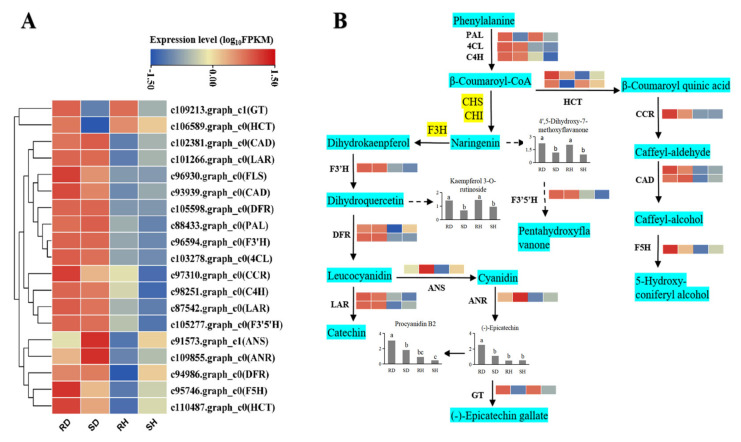
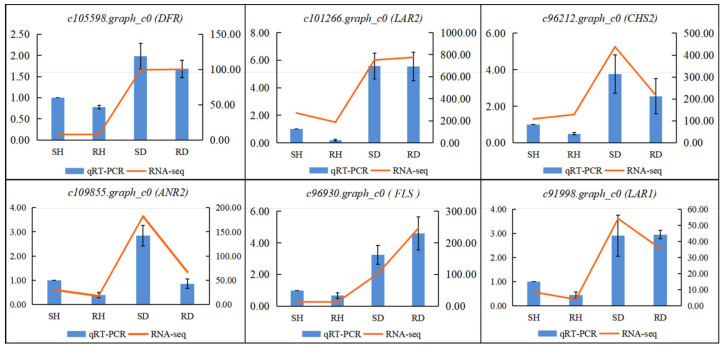
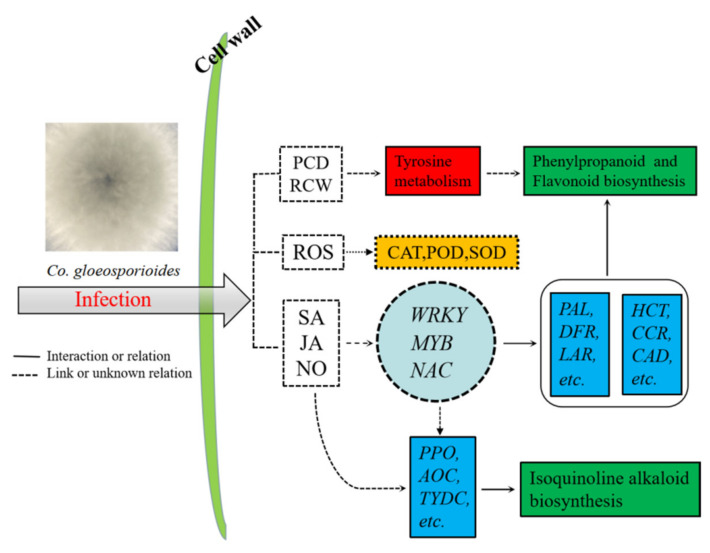
Camellia oleifera (Ca. oleifera) is a woody tree species cultivated for the production of edible oil from its seed. The growth and yield of tea-oil trees are severely affected by anthracnose (caused by Colletotrichum gloeosporioides). In this study, the transcriptomic and metabolomic analyses were performed to detect the key transcripts and metabolites associated with differences in the susceptibility between anthracnose-resistant (ChangLin150) and susceptible (ChangLin102) varieties of Ca. oleifera. In total, 5001 differentially expressed genes (DEGs) were obtained, of which 479 DEGs were common between the susceptible and resistant varieties and further analyzed. KEGG enrichment analysis showed that these DEGs were significantly enriched in tyrosine metabolism, phenylpropanoid biosynthesis, flavonoid biosynthesis and isoquinoline alkaloid biosynthesis pathways. Furthermore, 68 differentially accumulated metabolites (DAMs) were detected, including flavonoids, such as epicatechin, phenethyl caffeate and procyanidin B2. Comparison of the DEGs and DAMs revealed that epicatechin, procyanidin B2 and arachidonic acid (peroxide free) are potentially important. The expression patterns of genes involved in flavonoid biosynthesis were confirmed by qRT-PCR. These results suggested that flavonoid biosynthesis might play an important role in the fight against anthracnose. This study provides valuable molecular information about the response of Ca. oleifera to Co. gloeosporioides infection and will aid the selection of resistant varieties using marker-assisted breeding.
Keywords: Camellia oleifera; Colletotrichum gloeosporioides; anthracnose; flavonoid biosynthesis; metabolome; transcriptome.
Conflict of interest statement
The authors declare no conflict of interest.
Figures
Similar articles
-
Disruption of MAPK signalling and amino acid biosynthesis underlies the antifungal biocontrol mechanism of Coniochaeta velutina against Colletotrichum gloeosporioides: a transcriptome and metabolome analysis.Can J Microbiol. 2025 Jan 1;71:1-13. doi: 10.1139/cjm-2023-0223. Can J Microbiol. 2025. PMID: 40397987
-
Integrated transcriptomic and metabolomic analysis of Jinggang honey pomelo yellow spot disease to reveal the disease resistance mechanism.PLoS One. 2025 Sep 4;20(9):e0330626. doi: 10.1371/journal.pone.0330626. eCollection 2025. PLoS One. 2025. PMID: 40906757 Free PMC article.
-
[Progress in the resistance mechanism and breeding of Camellia oleifera with resistance to anthracnose].Sheng Wu Gong Cheng Xue Bao. 2024 Oct 25;40(10):3360-3374. doi: 10.13345/j.cjb.240197. Sheng Wu Gong Cheng Xue Bao. 2024. PMID: 39467738 Review. Chinese.
-
In-depth Understanding of Camellia oleifera Self-incompatibility by Comparative Transcriptome, Proteome and Metabolome.Int J Mol Sci. 2020 Feb 26;21(5):1600. doi: 10.3390/ijms21051600. Int J Mol Sci. 2020. PMID: 32111089 Free PMC article.
-
Advances in understanding the mechanism of resistance to anthracnose and induced defence response in tea plants.Mol Plant Pathol. 2023 Oct;24(10):1330-1346. doi: 10.1111/mpp.13354. Epub 2023 Jul 31. Mol Plant Pathol. 2023. PMID: 37522519 Free PMC article. Review.
Cited by
-
Enhanced Antifungal Efficacy of Validamycin A Co-Administered with Bacillus velezensis TCS001 against Camellia anthracnose.Plants (Basel). 2024 Sep 30;13(19):2743. doi: 10.3390/plants13192743. Plants (Basel). 2024. PMID: 39409613 Free PMC article.
-
Identification of Camellia oleifera WRKY transcription factor genes and functional characterization of CoWRKY78.Front Plant Sci. 2023 Mar 9;14:1110366. doi: 10.3389/fpls.2023.1110366. eCollection 2023. Front Plant Sci. 2023. PMID: 36968410 Free PMC article.
-
Comprehensive insights into herbicide resistance mechanisms in weeds: a synergistic integration of transcriptomic and metabolomic analyses.Front Plant Sci. 2023 Oct 11;14:1280118. doi: 10.3389/fpls.2023.1280118. eCollection 2023. Front Plant Sci. 2023. PMID: 37885667 Free PMC article. Review.
-
Endophytes and their potential in biotic stress management and crop production.Front Microbiol. 2022 Oct 17;13:933017. doi: 10.3389/fmicb.2022.933017. eCollection 2022. Front Microbiol. 2022. PMID: 36325026 Free PMC article. Review.
-
Comparative Transcriptome and Widely Targeted Metabolome Analysis Reveals the Molecular Mechanism of Powdery Mildew Resistance in Tomato.Int J Mol Sci. 2023 May 4;24(9):8236. doi: 10.3390/ijms24098236. Int J Mol Sci. 2023. PMID: 37175940 Free PMC article.
References
-
- Gao C., Yuan D., Yang Y., Wang B., Liu D., Zou F. Pollen Tube Growth and Double Fertilization in Camellia oleifera. J. Am. Soc. Hortic. Sci. 2015;140:12–18. doi: 10.21273/JASHS.140.1.12. - DOI
-
- Li Z., Tan X., Liu Z., Lin Q., Zhang L., Yuan J., Zeng Y., Wu L. In Vitro Propagation of Camellia oleifera Abel. Using Hypocotyl, Cotyledonary Node, and Radicle Explants. HortScience. 2016;51:416–421. doi: 10.21273/HORTSCI.51.4.416. - DOI
-
- Ye Z., Yu J., Yan W., Zhang J., Yang D., Yao G., Liu Z., Wu Y., Hou X. Integrative iTRAQ-based proteomic and transcriptomic analysis reveals the accumulation patterns of key metabolites associated with oil quality during seed ripening of Camellia oleifera. Hortic. Res. 2021;8:1–26. doi: 10.1038/s41438-021-00591-2. - DOI - PMC - PubMed
MeSH terms
Substances
Grants and funding
LinkOut - more resources
Full Text Sources
