

Mast Cells Differentiated in Synovial Fluid and Resident in Osteophytes Exalt the Inflammatory Pathology of Osteoarthritis
- PMID: 35008966
- PMCID: PMC8745477
- DOI: 10.3390/ijms23010541
Mast Cells Differentiated in Synovial Fluid and Resident in Osteophytes Exalt the Inflammatory Pathology of Osteoarthritis
Abstract
Introduction: Osteophytes are a prominent feature of osteoarthritis (OA) joints and one of the clinical hallmarks of the disease progression. Research on osteophytes is fragmentary and modes of its contribution to OA pathology are obscure.
Aim: To elucidate the role of osteophytes in OA pathology from a perspective of molecular and cellular events.
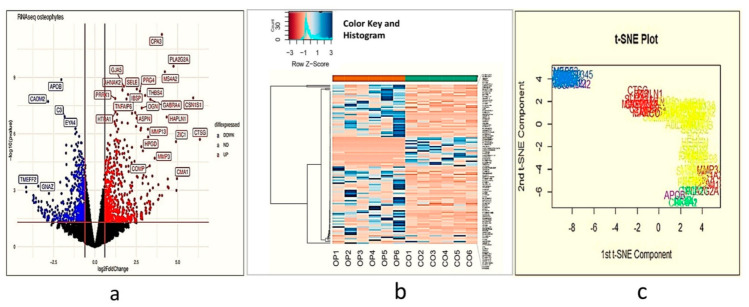
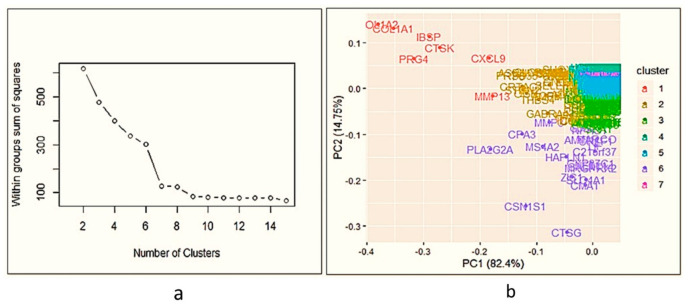
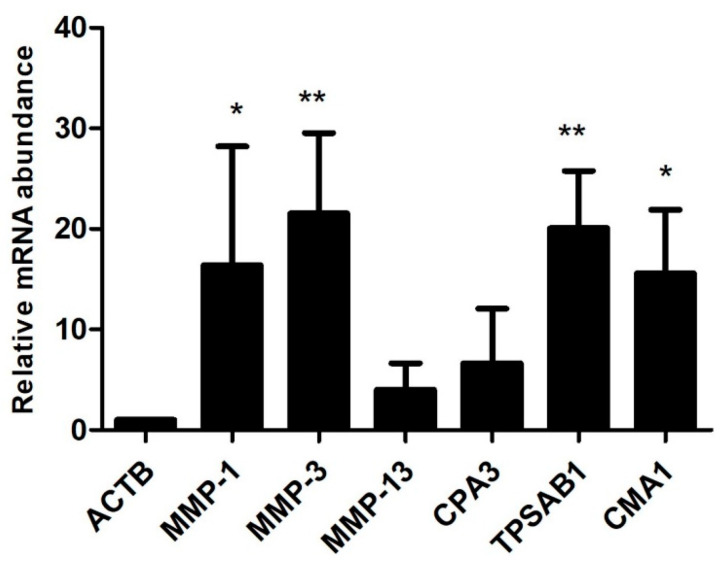
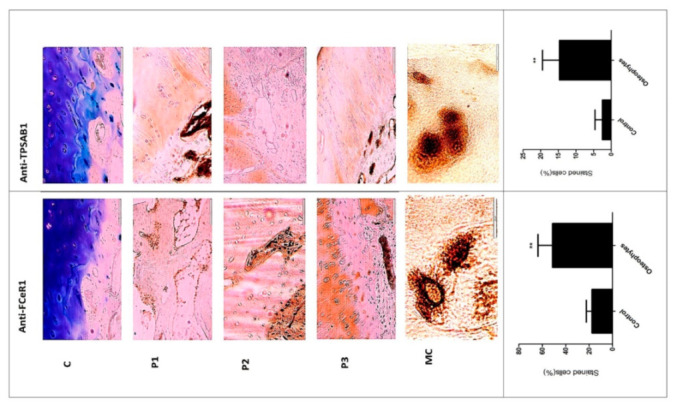
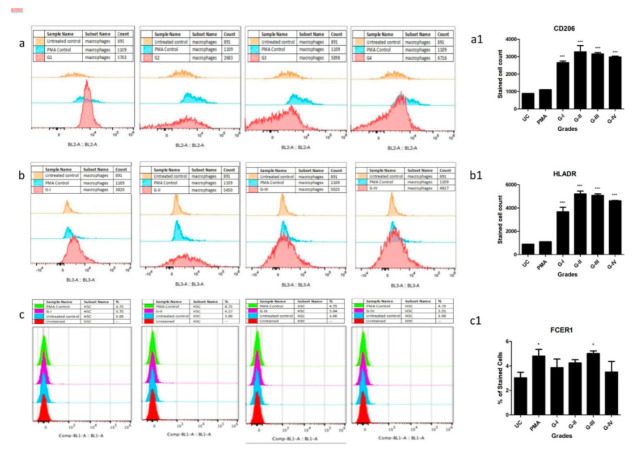
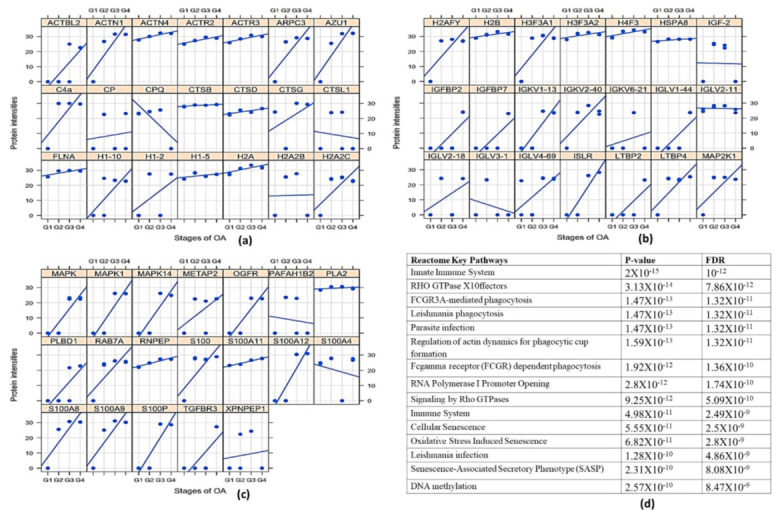
Methods: RNA-seq of fully grown osteophytes, collected from tibial plateau of six OA patients revealed patterns corresponding to active extracellular matrix re-modulation and prominent participation of mast cells. Presence of mast cells was further confirmed by immunohistochemistry, performed on the sections of the osteophytes using anti-tryptase alpha/beta-1 and anti-FC epsilon RI antibodies and the related key up-regulated genes were validated by qRT-PCR. To test the role of OA synovial fluid (SF) in mast cell maturation as proposed by the authors, hematopoietic stem cells (HSCs) and ThP1 cells were cultured in a media supplemented with 10% SF samples, obtained from various grades of OA patients and were monitored using specific cell surface markers by flow cytometry. Proteomics analysis of SF samples was performed to detect additional markers specific to mast cells and inflammation that drive the cell differentiation and maturation.
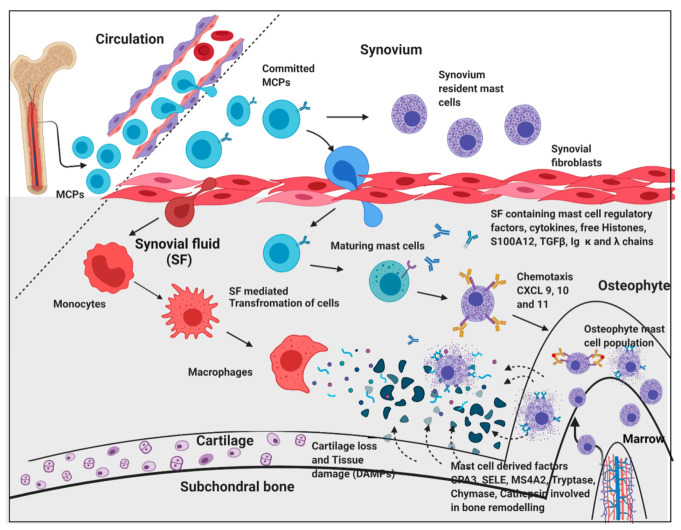
Results: Transcriptomics of osteophytes revealed a significant upregulation of mast cells specific genes such as chymase 1 (CMA1; 5-fold) carboxypeptidase A3 (CPA3; 4-fold), MS4A2/FCERI (FCERI; 4.2-fold) and interleukin 1 receptor-like 1 (IL1RL1; 2.5-fold) indicating their prominent involvement. (In IHC, anti-tryptase alpha/beta-1 and anti- FC epsilon RI-stained active mast cells were seen populated in cartilage, subchondral bone, and trabecular bone.) Based on these outcomes and previous learnings, the authors claim a possibility of mast cells invasion into osteophytes is mediated by SF and present in vitro cell differentiation assay results, wherein ThP1 and HSCs showed differentiation into HLA-DR+/CD206+ and FCERI+ phenotype, respectively, after exposing them to medium containing 10% SF for 9 days. Proteomics analysis of these SF samples showed an accumulation of mast cell-specific inflammatory proteins.
Conclusions: RNA-seq analysis followed by IHC study on osteophyte samples showed a population of mast cells resident in them and may further accentuate inflammatory pathology of OA. Besides subchondral bone, the authors propose an alternative passage of mast cells invasion in osteophytes, wherein OA SF was found to be necessary and sufficient for maturation of mast cell precursor into effector cells.
Keywords: RNA-seq; immune cell differentiation; mast cells; osteoarthritis; osteophytes; proteomics; synovial fluid.
Conflict of interest statement
All the authors declare no competing interests.
Figures
Similar articles
-
RNA-seq characterization of histamine-releasing mast cells as potential therapeutic target of osteoarthritis.Clin Immunol. 2022 Nov;244:109117. doi: 10.1016/j.clim.2022.109117. Epub 2022 Sep 13. Clin Immunol. 2022. PMID: 36109004 Free PMC article.
-
Molecular changes in articular cartilage and subchondral bone in the rat anterior cruciate ligament transection and meniscectomized models of osteoarthritis.BMC Musculoskelet Disord. 2011 Aug 24;12:197. doi: 10.1186/1471-2474-12-197. BMC Musculoskelet Disord. 2011. PMID: 21864409 Free PMC article.
-
Alarmins S100A8/S100A9 aggravate osteophyte formation in experimental osteoarthritis and predict osteophyte progression in early human symptomatic osteoarthritis.Ann Rheum Dis. 2016 Jan;75(1):218-25. doi: 10.1136/annrheumdis-2014-205480. Epub 2014 Sep 1. Ann Rheum Dis. 2016. PMID: 25180294
-
Arthritic and non-arthritic synovial fluids modulate IL10 and IL1RA gene expression in differentially activated primary human monocytes.Osteoarthritis Cartilage. 2015 Nov;23(11):1853-7. doi: 10.1016/j.joca.2015.06.003. Osteoarthritis Cartilage. 2015. PMID: 26521731 Review.
-
Osteophytes: relevance and biology.Osteoarthritis Cartilage. 2007 Mar;15(3):237-44. doi: 10.1016/j.joca.2006.11.006. Epub 2007 Jan 3. Osteoarthritis Cartilage. 2007. PMID: 17204437 Review.
Cited by
-
Targeting Neuroinflammation in Osteoarthritis with Intra-Articular Adelmidrol.Biomolecules. 2022 Oct 11;12(10):1453. doi: 10.3390/biom12101453. Biomolecules. 2022. PMID: 36291664 Free PMC article. Review.
-
Mechanism of immune infiltration in synovial tissue of osteoarthritis: a gene expression-based study.J Orthop Surg Res. 2023 Jan 21;18(1):58. doi: 10.1186/s13018-023-03541-x. J Orthop Surg Res. 2023. PMID: 36681837 Free PMC article.
-
Myeloid Cells and Sensory Nerves Mediate Peritendinous Adhesion Formation via Prostaglandin E2.Adv Sci (Weinh). 2024 Oct;11(40):e2405367. doi: 10.1002/advs.202405367. Epub 2024 Aug 29. Adv Sci (Weinh). 2024. PMID: 39207041 Free PMC article.
-
Primary cilia and inflammatory response: unveiling new mechanisms in osteoarthritis progression.Exp Biol Med (Maywood). 2025 Apr 28;250:10490. doi: 10.3389/ebm.2025.10490. eCollection 2025. Exp Biol Med (Maywood). 2025. PMID: 40357414 Free PMC article. Review.
-
Phytochemicals in the treatment of inflammation-associated diseases: the journey from preclinical trials to clinical practice.Front Pharmacol. 2023 May 9;14:1177050. doi: 10.3389/fphar.2023.1177050. eCollection 2023. Front Pharmacol. 2023. PMID: 37229273 Free PMC article. Review.
References
-
- Kulkarni P., Martson A., Vidya R., Chitnavis S., Harsulkar A. Pathophysiological landscape of osteoarthritis. Adv. Clin. Chem. 2021;100:37–90. - PubMed
MeSH terms
Substances
Grants and funding
LinkOut - more resources
Full Text Sources
Medical
Molecular Biology Databases
Research Materials
Miscellaneous
