. 2022 Jan 5;23(1):569.
doi: 10.3390/ijms23010569.

Gene Co-Expression Analysis Reveals Transcriptome Divergence between Wild and Cultivated Sugarcane under Drought Stress

Affiliations

Gene Co-Expression Analysis Reveals Transcriptome Divergence between Wild and Cultivated Sugarcane under Drought Stress

Peiting Li et al. Int J Mol Sci. .

Abstract

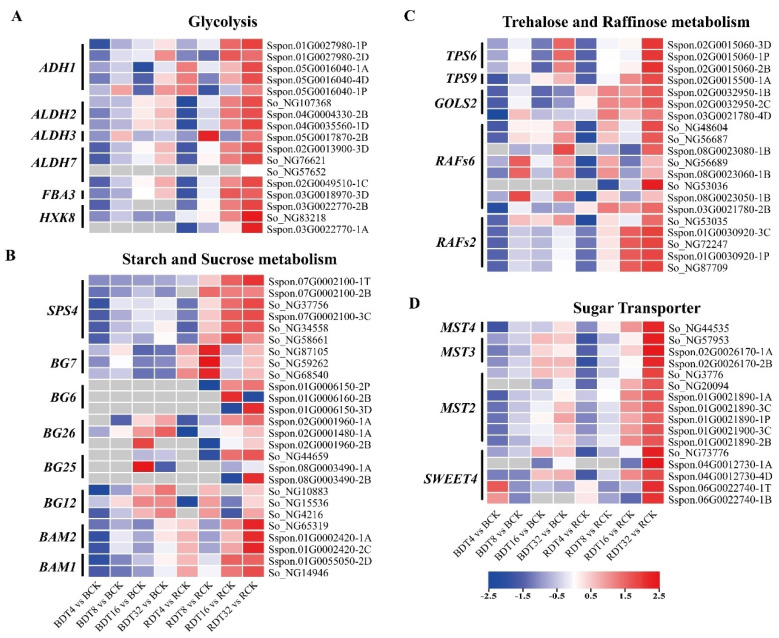
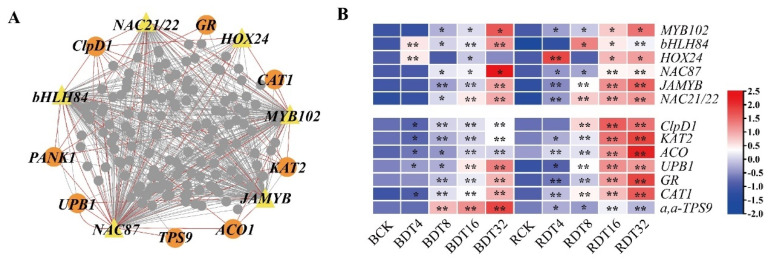
Drought is the main abiotic stress that constrains sugarcane growth and production. To understand the molecular mechanisms that govern drought stress, we performed a comprehensive comparative analysis of physiological changes and transcriptome dynamics related to drought stress of highly drought-resistant (ROC22, cultivated genotype) and weakly drought-resistant (Badila, wild genotype) sugarcane, in a time-course experiment (0 h, 4 h, 8 h, 16 h and 32 h). Physiological examination reviewed that ROC22, which shows superior drought tolerance relative to Badila, has high performance photosynthesis and better anti-oxidation defenses under drought conditions. The time series dataset enabled the identification of important hubs and connections of gene expression networks. We identified 36,956 differentially expressed genes (DEGs) in response to drought stress. Of these, 15,871 DEGs were shared by the two genotypes, and 16,662 and 4423 DEGs were unique to ROC22 and Badila, respectively. Abscisic acid (ABA)-activated signaling pathway, response to water deprivation, response to salt stress and photosynthesis-related processes showed significant enrichment in the two genotypes under drought stress. At 4 h of drought stress, ROC22 had earlier stress signal transduction and specific up-regulation of the processes response to ABA, L-proline biosynthesis and MAPK signaling pathway-plant than Badila. WGCNA analysis used to compile a gene regulatory network for ROC22 and Badila leaves exposed to drought stress revealed important candidate genes, including several classical transcription factors: NAC87, JAMYB, bHLH84, NAC21/22, HOX24 and MYB102, which are related to some antioxidants and trehalose, and other genes. These results provide new insights and resources for future research and cultivation of drought-tolerant sugarcane varieties.

Keywords: WGCNA; drought resistant; sugarcane; transcription factor; transcriptome.


Conflict of interest statement

The authors declare no conflict of interest.

Figures

Figure 1
Figure 1
Effect of 20% PEG6000 stress on sugarcane. (A) The 20% PEG6000 simulated the phenotypic changes of ROC22 and Badila under drought stress. (B) Broken line diagram the relative water content RWC (%) of leaves. (C) Broken line diagram net photosynthetic rate. (D) Broken line diagram of stomatal conductance of different samples. Different lowercase letters indicate that there is a significant difference between the mean values (one-way ANOVA with Ducan’s multiple range test, p ≤ 0.05). CK, control group, DT4h, drought treatment for 4 h, DT8h, drought treatment for 8 h, DT16h, drought treatment for 16 h and DT32h, drought treatment for 32 h, n = 15.
Figure 2
Figure 2
Transcriptome differences between two genotypes of sugarcane (ROC22 and Badila). (A) PCA diagram of sample expression at different time points of ROC22 and Badila drought stress. (B) In the cluster heatmap of the correlation of the expression quantity of all samples, red indicates high correlation and blue indicates low correlation.
Figure 3
Figure 3
Temporal changes of response transcriptome in sugarcane leaves. (A) The number of DEGs of Badila and ROC22 after drought stress is compared between treated samples and untreated samples. 0 h (untreated samples), DT4h (drought treatment for 4 h), DT8h (drought treatment for 8 h), DT16h (drought treatment for 16 h), DT32h (drought treatment for 32 h). (B) Venn diagram of DEGs of Badila and ROC22 under drought stress. (C) The differentially expressed genes KEGG and GO of the two materials are enriched. B (Badila), R (ROC22); 0 h indicates the DEGs between ROC22 and Badila without treatment, 4 h, 8 h, 16 h, 32 h indicates the DEGs drought treatment for 4 h, 8 h, 16 h and 32 h; orange on the left is the annotation of up-regulated genes, green on the right is the annotation of down-regulated genes; the red line indicates the GO terms, the blue line indicates the KEGG pathway.
Figure 4
Figure 4
WGCNA analysis of differentially expressed genes in sugarcane. The module sample correlation and corresponding p values are shown in parentheses. The panel on the left shows 17 modules. The color code on the right shows the module feature correlation −1 (blue) to 1 (red).
Figure 5
Figure 5
Complex signal transduction pathways under drought stress. (AC) The expression patterns of genes related to plant hormone biosynthesis and signal transduction under drought stress. (D) The expression patterns of DEGs involved in MAPK signal cascade were mapped by log2(FC), and row standardized. Red is up-regulated expression and blue is down-regulated expression.
Figure 6
Figure 6
Antioxidant defense system of sugarcane under drought stress. (A) CAT enzyme activities of Badila and ROC22 under different drought stress treatment times. (B) POD enzyme activity. (C) MDA content. (D) Hydrogen peroxide content. Different lowercase letters indicate significant differences, p ≤ 0.05. (E) The expression patterns of genes related to antioxidant enzyme in sugarcane under drought stress were mapped by log2(FC), and the data were row standardized. Red was the up-regulated expression and blue was the down-regulated expression.
Figure 7
Figure 7
Carbohydrate metabolism related genes in sugarcane under drought stress. (A) Glycolysis. (B) Starch and Sucrose metabolism. (C) Trehalose and Raffinose metabolism. (D) Sugar Transpoter. The mapping data is by log2(FC), and the data were row standardized. Red is the up-regulated expression and blue is the down-regulated expression.
Figure 8
Figure 8
Lipid metabolism-related genes in sugarcane under drought stress. (A) Membrane lipid peroxidation. (B) Cuticle wax. (C) Phosphatidylic acid signal. The mapping data is by log2(FC), and the data were row standardized. Red is the up-regulated expression and blue is the down-regulated expression.
Figure 9
Figure 9
Co-expression network of transcription factors and structural genes related to drought stress response in sugarcane. (A) The co-expression network of transcription factors (yellow triangle) and structural genes (orange circle) related to the response process of drought stress, and the gray circle is the co-expression network of other genes related to transcription factors. (B) The heat map of drought stress related transcription factors and structural gene expression was drawn by qRT-PCR data. The data were standardized and logarithmic (the base number was 2). Red indicates high expression and blue indicates low expression. Student t test is used for significance test. All samples of Badila were compared with BCK, and all samples of ROC22 were compared with RCK, * indicates significant(p ≤ 0.05), ** indicates extremely significant(p ≤ 0.01).

References

    1. Fang Y., Xiong L. General mechanisms of drought response and their application in drought resistance improvement in plants. Cell. Mol. Life Sci. 2015;72:673–689. doi: 10.1007/s00018-014-1767-0. - DOI - PMC - PubMed
    1. Liu Q., Xie S., Zhao X., Liu Y., Xing Y., Dao J., Wei B., Peng Y., Duan W., Wang Z. Drought Sensitivity of Sugarcane Cultivars Shapes Rhizosphere Bacterial Community Patterns in Response to Water Stress. Front. Microbiol. 2021;12:732989. doi: 10.3389/fmicb.2021.732989. - DOI - PMC - PubMed
    1. Tardieu F., Simonneau T., Muller B. The Physiological Basis of Drought Tolerance in Crop Plants: A Scenario-Dependent Probabilistic Approach. Annu. Rev. Plant Biol. 2018;69:733–759. doi: 10.1146/annurev-arplant-042817-040218. - DOI - PubMed
    1. Blum A. Osmotic adjustment is a prime drought stress adaptive engine in support of plant production. Plant Cell Environ. 2017;40:4–10. doi: 10.1111/pce.12800. - DOI - PubMed
    1. Mahmood T., Khalid S., Abdullah M., Ahmed Z., Shah M.K.N., Ghafoor A., Du X. Insights into Drought Stress Signaling in Plants and the Molecular Genetic Basis of Cotton Drought Tolerance. Cells. 2019;9:105. doi: 10.3390/cells9010105. - DOI - PMC - PubMed

LinkOut - more resources