. 2021 Dec 25;11(1):61.
doi: 10.3390/plants11010061.

The Omics Hunt for Novel Molecular Markers of Resistance to Phytophthora infestans

Affiliations

The Omics Hunt for Novel Molecular Markers of Resistance to Phytophthora infestans

Hana Dufková et al. Plants (Basel). .

Abstract

Wild Solanum accessions are a treasured source of resistance against pathogens, including oomycete Phytophthora infestans, causing late blight disease. Here, Solanum pinnatisectum, Solanum tuberosum, and the somatic hybrid between these two lines were analyzed, representing resistant, susceptible, and moderately resistant genotypes, respectively. Proteome and metabolome analyses showed that the infection had the highest impact on leaves of the resistant plant and indicated, among others, an extensive remodeling of the leaf lipidome. The lipidome profiling confirmed an accumulation of glycerolipids, a depletion in the total pool of glycerophospholipids, and showed considerable differences between the lipidome composition of resistant and susceptible genotypes. The analysis of putative resistance markers pinpointed more than 100 molecules that positively correlated with resistance including phenolics and cysteamine, a compound with known antimicrobial activity. Putative resistance protein markers were targeted in an additional 12 genotypes with contrasting resistance to P. infestans. At least 27 proteins showed a negative correlation with the susceptibility including HSP70-2, endochitinase B, WPP domain-containing protein, and cyclase 3. In summary, these findings provide insights into molecular mechanisms of resistance against P. infestans and present novel targets for selective breeding.

Keywords: Oomycetes; Oomycota; Phytophthora infestans; late blight; lipidome; metabolome; proteome; resistance; resistance markers.


Conflict of interest statement

The authors declare no conflict of interest.

Figures

Figure 1
Figure 1
Solanum genotypes employed in the experiment. Representative images of 12 week old plants (a), comparison of yields (grams per plant) (b), representative images of tubers (c), and effects of Phytophthora infestans inoculation in the detached leaf experiment 96 hai (d,e). Parental genotypes Solanum pinnatisectum (blue), S. tuberosum cv. Kerkovske rohlicky (red), and somatic hybrid SH1968 (magenta). The plots represent the mean and standard deviation of four harvests (b) and five biological replicates (d). Different letters indicate significant differences (Kruskal–Wallis test, p < 0.05).
Figure 2
Figure 2
Genotype-specific response to Phytophthora inoculation. (a) Separation of proteome profiles based on relative abundances of differentially abundant proteins including the means and standard deviations. (b) The overlap in identified differentially abundant proteins (compared to the mock) was visualized by DiVenn [26]. Red and blue dots represent significant increases and decreases in protein abundances, respectively. Yellow dots indicate the number of proteins with a contrasting response in different genotypes and/or time points. Only proteins with at least two unique peptides were evaluated. (c) Comparison of enriched GO categories in the sets of differentially abundant proteins. For the sake of clarity, categories with at least five proteins were included in the final analysis, and only filtered GO terms with the most significant contribution to the separation in PC1 or PC2 are labeled. K, S. tuberosum cv. Kerkovsky rohlicek; P, S. pinnatisectum; S, hybrid SH1968. For details, see Supplementary Materials Tables S1–S3.
Figure 3
Figure 3
Estimated Phytophthora protein content in inoculated leaves (a) and relative Phytophthora load (b) based on the qPCR determination of PiO8 normalized to PGSC0003DMG400023270. Results represent the mean and standard deviation (n = 5), and different letters indicate significant differences (Kruskal–Wallis, Conover test p < 0.05).
Figure 4
Figure 4
Metabolomic response to inoculation. The metabolic pathway impact based on 72 differentially abundant metabolites identified with confident identification, evaluated by MetaboAnalyst 5.0 [28], and visualized by PCA.
Figure 5
Figure 5
Lipidome profiling confirmed significant alterations in lipidome composition in response to P. infestans inoculation. (a) Separation of lipidome profiles by PCA, including the means and standard deviations, (b) estimated composition of S. tuberosum leaf lipidome, and (c) lipidome response to inoculation. Asterisks indicate statistically significant differences compared to the mock for lipid classes representing at least 2% of the estimated lipid content (Student’s t-test, p < 0.05). K, S. tuberosum cv. Kerkovsky rohlicek; P, S. pinnatisectum; S, hybrid SH1968; DG, diglyceride; TG, triglyceride; PC, phosphatidylcholine; PG, phosphatidylglycerol; PE, phosphatidylethanolamine; BisMePA, bis-methyl phosphatidic acid; MePC, methyl phosphatidylcholine; PI/PIP, phosphatidylinositol; PS, phosphatidylserine; PEt, phosphatidylethanol; PA, phosphatidic acid; Cer, ceramide; Hex2Cer, glycosphingolipids, simple Glc series; SM, sphingomyelin; phSM, sphingomyelin(phytosphingosine); CmE, campesterol ester; ChE, cholesterol ester; AcHexCmE, AcylGlcCampesterol ester; ZyE, zymosterol ester; SiE, sitosterol ester; WEs, wax esters; AcCa, acyl carnitine. For details, see Supplementary Materials, Table S4.
Figure 6
Figure 6
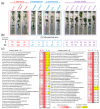
Identification of proteins, lipids, and metabolites correlating with Phytophthora resistance. Orthogonal partial least squares discriminant analysis (a) followed by VIP (variable importance in projection), (b) lists of identified metabolites, (c) and lipids (d) that separate the resistant genotype. Only metabolites with confident identification are shown with the corresponding HMDB metabolite identifier (https://hmdb.ca/; accessed on 10 December 2021). Heat maps represent the mean relative abundances of five biological replicates compared to S. pinnatisectum; letters represent the results of ANOVA and Fisher’s LSD post hoc analysis; asterisks indicate identification of lipid compounds with lower confidence. For details, see Supplementary Materials Tables S1, S3–S5. Putative protein markers are summarized in Figure 7.
Figure 7
Figure 7
Putative protein markers of resistance to Phytophthora and correlation of their abundances with resistance in 15 different genotypes. Proteins identified in the analyses outlined in Figure 6a,b were quantified in an independent analysis of 15 different genotypes with contrasting resistance to P. infestans. (a) Representative images of four-week-old plants collected for proteomics analysis (before inoculation) and (b) the percentage of infected leaf area (developed infection symptoms) two and 12 weeks after inoculation. For details, see Section 4. (c) The heat map representation of the mean relative protein abundances in the leaf inoculation experiment compared to S. pinnatisectum and correlation coefficients (r, Pearson correlation coefficient; rs, Spearman’s rank correlation coefficient) representing the correlation of protein abundance with susceptibility observed in all 15 genotypes. The correlation’s reliability (t-test) is indicated. The protein name represents the identification determined by the orthology search against the Arabidopsis protein database or protein family classification determined by InterPro 87.0 [30]. GI, gene identifier according to the Potato Genome Sequence Consortium (https://solgenomics.net/; accessed on 10 December 2021). The letters represent the results of ANOVA and Fisher’s LSD post hoc analysis. NA, proteins not found in the validation experiment. For details, see Supplementary Materials Tables S1 and S5.
Figure 8
Figure 8
Relative auxin content in the inoculated and mock-treated leaves. The results represent the means and standard deviations (n = 5), and the different letters indicate significant differences (Kruskal–Wallis, p < 0.05). K, S. tuberosum cv. Kerkovsky rohlicek; P, S. pinnatisectum; S, hybrid SH1968.

Similar articles

Cited by

References

    1. Savary S., Willocquet L., Pethybridge S.J., Esker P., McRoberts N., Nelson A. The global burden of pathogens and pests on major food crops. Nat. Ecol. Evol. 2019;3:430–439. doi: 10.1038/s41559-018-0793-y. - DOI - PubMed
    1. Fry W.E., Birch P.R.J., Judelson H.S., Grünwald N.J., Danies G., Everts K.L., Gevens A.J., Gugino B.K., Johnson D.A., Johnson S.B., et al. Five reasons to consider Phytophthora infestans a reemerging pathogen. Phytopathology. 2015;105:966–981. doi: 10.1094/PHYTO-01-15-0005-FI. - DOI - PubMed
    1. Leesutthiphonchai W., Vu A.L., Ah-Fong A.M.V., Judelson H.S. How does Phytophthora infestans evade control efforts? Modern insight into the late blight disease. Phytopathology. 2018;108:916–924. doi: 10.1094/PHYTO-04-18-0130-IA. - DOI - PubMed
    1. Nowicki M., Foolad M.R., Nowakowska M., Kozik E.U. Potato and tomato late blight caused by Phytophthora infestans: An overview of pathology and resistance breeding. Plant Dis. 2012;96:4–17. doi: 10.1094/PDIS-05-11-0458. - DOI - PubMed
    1. Machida-Hirano R. Diversity of potato genetic resources. Breed. Sci. 2015;65:26–40. doi: 10.1270/jsbbs.65.26. - DOI - PMC - PubMed