

Genome-Wide Association Analysis of Salt-Tolerant Traits in Terrestrial Cotton at Seedling Stage
- PMID: 35009100
- PMCID: PMC8747425
- DOI: 10.3390/plants11010097
Genome-Wide Association Analysis of Salt-Tolerant Traits in Terrestrial Cotton at Seedling Stage
Abstract
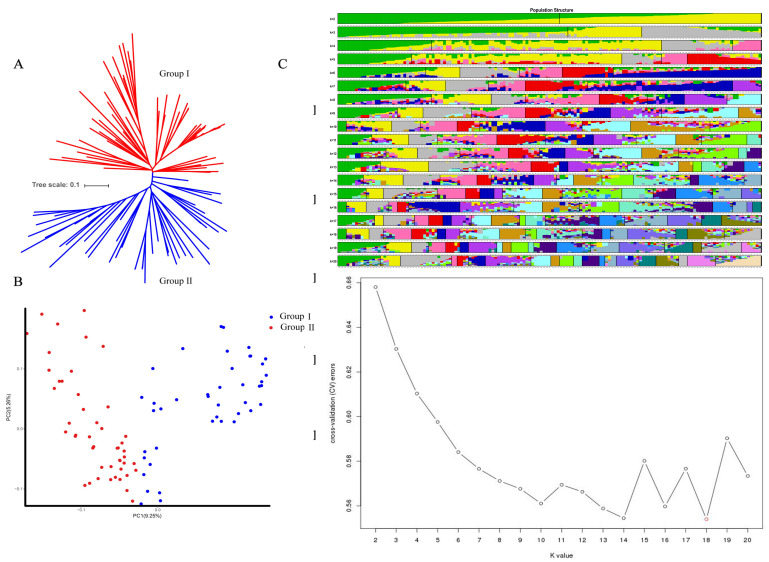
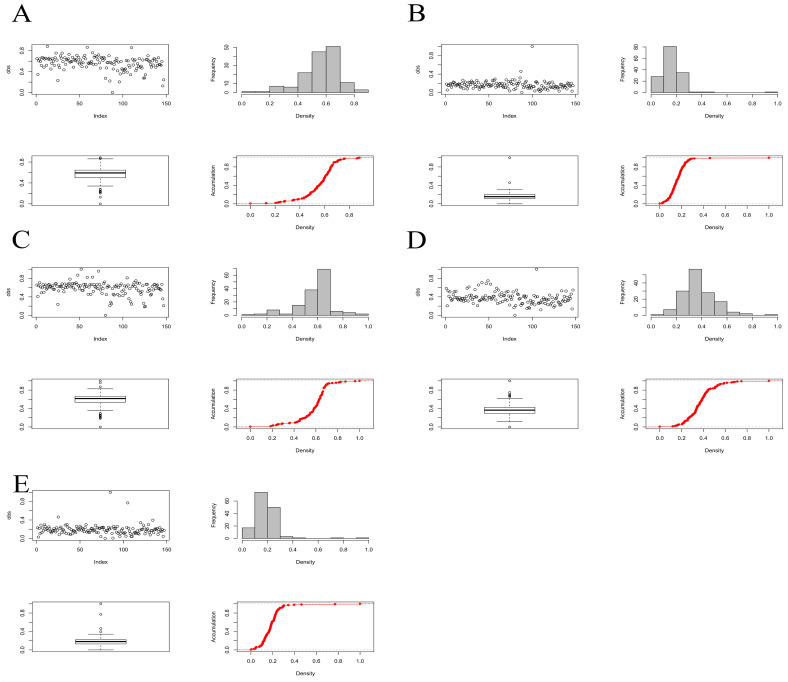
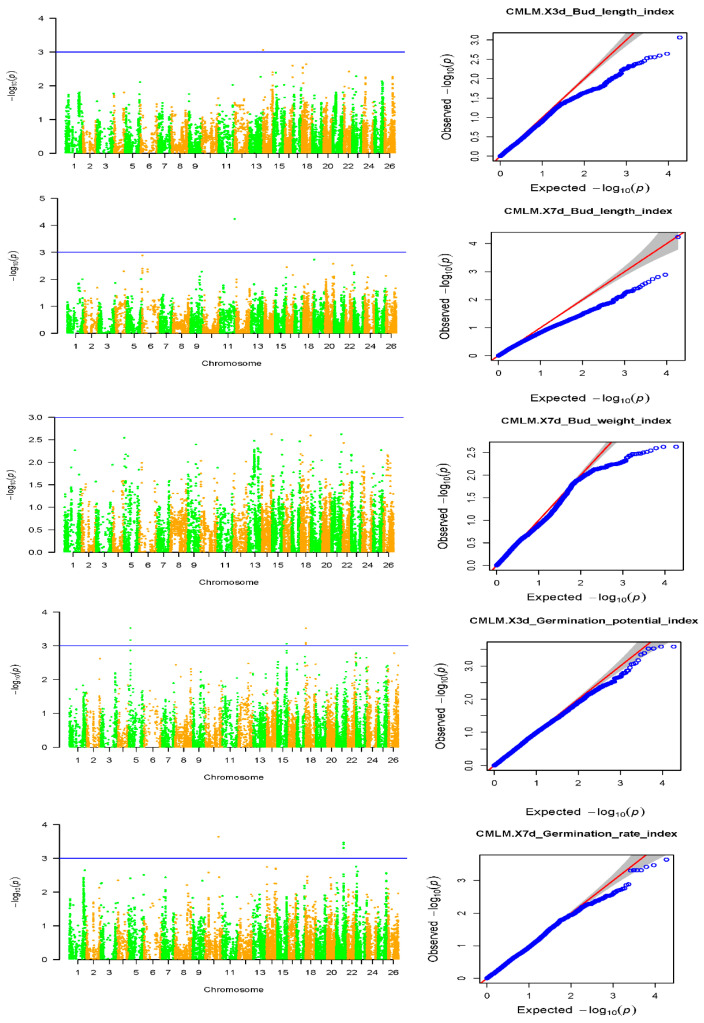
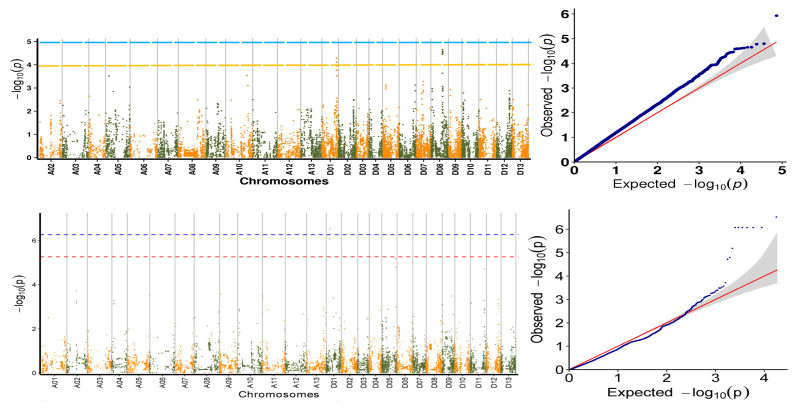
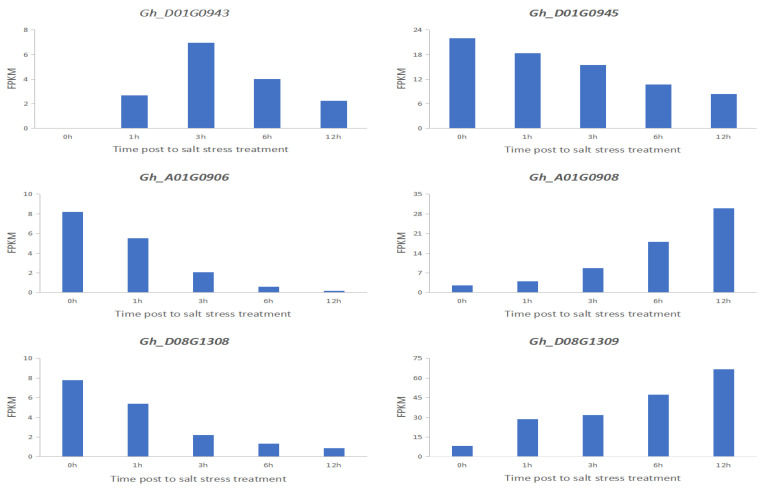
Soil salinization is the main abiotic stress factor affecting agricultural production worldwide, and salt stress has a significant impact on plant growth and development. Cotton is one of the most salt-tolerant crops. Therefore, the selection and utilization of salt-tolerant germplasm resources and the excavation of salt resistance genes play important roles in improving cotton production in saline-alkali soils. In this study, we analysed the population structure and genetic diversity of a total 149 cotton plant materials including 137 elite Gossypium hirsutum cultivar accessions collected from China and 12 elite Gossypium hirsutum cultivar accessions collected from around the world. Illumina Cotton SNP 70 K was used to obtain genome-wide single-nucleotide polymorphism (SNP) data for 149 elite Gossypium hirsutum cultivar accessions, and 18,430 highly consistent SNP loci were obtained by filtering. It was assessed by using PCA principal component analysis so that the 149 elite Gossypium hirsutum cultivar accessions could be divided into two subgroups, including subgroup 1 with 78 materials and subgroup 2 with 71 materials. Using the obtained SNP and other marker genotype test results, under salt stress, the salt tolerance traits 3d Germination potential, 3d Radicle length drop rate, 7d Germination rate, 7d Radicle length drop rate, 7d Germination weight, 3d Radicle length, 7d Radicle length, Relative Germination potential, Relative Germination rate, 7d Radicle weight drop rate, Salt tolerance index 3d Germination potential index, 3d Radicle length index, 7d Radicle length index, 7d Radicle weight index and 7d Germination rate index were evaluated by GWAS (genome-wide association analysis). A total of 27 SNP markers closely related to the salt tolerance traits and 15 SNP markers closely related to the salt tolerance index were detected. At the SNP locus associated with phenotyping, Gh_D01G0943, Gh_D01G0945, Gh_A01G0906, Gh_A01G0908, Gh_D08G1308 and Gh_D08G1309 related to plant salt tolerance were detected, and they were found to be involved in intracellular transport, sucrose synthesis, osmotic pressure balance, transmembrane transport, N-glycosylation, auxin response and cell amplification. This study provides a theoretical basis for the selection and breeding of salt-tolerant upland cotton varieties.
Keywords: GWAS; SNP; salt stress; salt tolerance gene; upland cotton.
Conflict of interest statement
No competing interest among all authors.
Figures
Similar articles
-
Genome-wide association and differential expression analysis of salt tolerance in Gossypium hirsutum L at the germination stage.BMC Plant Biol. 2019 Sep 11;19(1):394. doi: 10.1186/s12870-019-1989-2. BMC Plant Biol. 2019. PMID: 31510912 Free PMC article.
-
Identification of SNPs and Candidate Genes Associated With Salt Tolerance at the Seedling Stage in Cotton (Gossypium hirsutum L.).Front Plant Sci. 2018 Jul 11;9:1011. doi: 10.3389/fpls.2018.01011. eCollection 2018. Front Plant Sci. 2018. PMID: 30050555 Free PMC article.
-
High-density 80 K SNP array is a powerful tool for genotyping G. hirsutum accessions and genome analysis.BMC Genomics. 2017 Aug 23;18(1):654. doi: 10.1186/s12864-017-4062-2. BMC Genomics. 2017. PMID: 28835210 Free PMC article.
-
An overview of salinity stress, mechanism of salinity tolerance and strategies for its management in cotton.Front Plant Sci. 2022 Oct 7;13:907937. doi: 10.3389/fpls.2022.907937. eCollection 2022. Front Plant Sci. 2022. PMID: 36275563 Free PMC article. Review.
-
Genomic Dynamics and Functional Insights under Salt Stress in Gossypium hirsutum L.Genes (Basel). 2023 May 18;14(5):1103. doi: 10.3390/genes14051103. Genes (Basel). 2023. PMID: 37239463 Free PMC article. Review.
Cited by
-
Identification of novel candidate loci and genes for seed vigor-related traits in upland cotton (Gossypium hirsutum L.) via GWAS.Front Plant Sci. 2023 Sep 1;14:1254365. doi: 10.3389/fpls.2023.1254365. eCollection 2023. Front Plant Sci. 2023. PMID: 37719213 Free PMC article.
-
Integrative physiology and transcriptome sequencing reveal differences between G. hirsutum and G. barbadense in response to salt stress and the identification of key salt tolerance genes.BMC Plant Biol. 2024 Aug 21;24(1):787. doi: 10.1186/s12870-024-05515-5. BMC Plant Biol. 2024. PMID: 39164616 Free PMC article.
-
Salt and drought stress-mitigating approaches in sugar beet (Beta vulgaris L.) to improve its performance and yield.Planta. 2023 Jun 26;258(2):30. doi: 10.1007/s00425-023-04189-x. Planta. 2023. PMID: 37358618 Review.
-
JcSEUSS1 negatively regulates reproductive organ development in perennial woody Jatropha curcas.Planta. 2023 Sep 27;258(5):88. doi: 10.1007/s00425-023-04244-7. Planta. 2023. PMID: 37755517
-
Heavy Metal-Associated Proteins in Plants: Genome-Wide Identification and Functional Insights from Angiosperms and Ancestral Plants.J Mol Evol. 2025 Aug;93(4):527-542. doi: 10.1007/s00239-025-10260-w. Epub 2025 Aug 5. J Mol Evol. 2025. PMID: 40764426
References
-
- Long Enecker D.E. The influence of soil so linity upon fruiting and shedding, boll characteristics, fibre properties and yields of two cotton species. Soil Sci. 1973;115:294–302. doi: 10.1097/00010694-197304000-00005. - DOI
-
- Long Enecker D.E. The influence of high so dium in soil upon fruiting and shedding, boll characteristics, fibre properties and yields of two cotton species. Soil Sci. 1974;118:387–396. doi: 10.1097/00010694-197412000-00007. - DOI
-
- Razzouk S., Whittington W. Effects of salinity on cotton yield and quality. Field Crop Res. 1991;26:305–314. doi: 10.1016/0378-4290(91)90007-I. - DOI
Grants and funding
- 2021D14007/"Tianshan"Innovation team program the Xinjiang Uygur Autonomous of Region
- JZRC2019B0243/Doctoral Program of Cash Crops Research Institute of Xinjiang Academy of Agricultural Science
- No. 31760405/National Natural Science Foundation of China
- U1903204/National Natural Science Foundation of China
LinkOut - more resources
Full Text Sources
