

Physiological Characteristics of Cultivated Tepary Bean (Phaseolus acutifolius A. Gray) and Its Wild Relatives Grown at High Temperature and Acid Soil Stress Conditions in the Amazon Region of Colombia
- PMID: 35009119
- PMCID: PMC8747739
- DOI: 10.3390/plants11010116
Physiological Characteristics of Cultivated Tepary Bean (Phaseolus acutifolius A. Gray) and Its Wild Relatives Grown at High Temperature and Acid Soil Stress Conditions in the Amazon Region of Colombia
Abstract
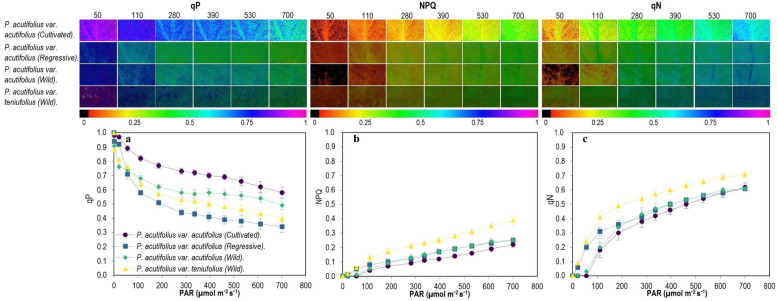
Common bean (Phaseolus vulgaris L.) is sensitive to different types of abiotic stresses (drought, high temperature, low soil fertility, and acid soil), and this may limit its adaptation and consequently to its yield under stress. Because of this, a sister species, tepary bean (Phaseolus acutifolius A. Gray), has recently gained attention in breeding for improved abiotic stress tolerance in common bean. In this study, we evaluated the adaptation of 302 accessions of tepary bean (Phaseolus acutifolius A. Gray) and its wild relatives (grouped in four types of tepary bean genetic resource: cultivated, acutifolius regressive, acutifolius wild, tenuifolius wild) when grown under high temperature and acid soil conditions with aluminum toxicity in the Amazon region of Colombia. Our objective was to determine differences among four types of tepary bean genetic resource in their morpho-phenological, agronomic, and physiological responses to combined high temperature and acid soil stress conditions. We found that cultivated P. acutifolius var acutifolius presented a greater number of pods per plant, as well as larger seeds and a greater number of seeds per pod. Some traits, such as root biomass, days to flowering and physiological maturity, specific leaf area, and stomatal density, showed significant differences between types of tepary bean genetic resource, probably contributing to difference in adaptation to combined stress conditions of high temperature and acid soil conditions. The photochemical quenching (qP) was higher in cultivated P. acutifolius var. acutifolius, while energy dissipation by non-photochemical quenching (NPQ) in the form of heat and the coefficient of non-photochemical dissipation (qN) were higher in acutifolius regressive and tenuifolius wild accessions. We have identified 6 accessions of cultivated and 19 accessions of tenuifolius wild that exhibited grain yields above 1800 kg ha-1. These accessions could be suitable to use as parents to improve dry seed production of tepary bean under combined stress conditions of high temperature and acid soil.
Keywords: agronomic characteristics; chlorophyll fluorescence; energy use; heat tolerance; yield.
Conflict of interest statement
The authors declare no conflict of interest.
Figures


Similar articles
-
First use of microsatellite markers in a large collection of cultivated and wild accessions of tepary bean (Phaseolus acutifolius A. Gray).Theor Appl Genet. 2012 Oct;125(6):1137-47. doi: 10.1007/s00122-012-1900-0. Epub 2012 Jun 8. Theor Appl Genet. 2012. PMID: 22678667
-
Allelic Diversity at Abiotic Stress Responsive Genes in Relationship to Ecological Drought Indices for Cultivated Tepary Bean, Phaseolus acutifolius A. Gray, and Its Wild Relatives.Genes (Basel). 2021 Apr 12;12(4):556. doi: 10.3390/genes12040556. Genes (Basel). 2021. PMID: 33921270 Free PMC article.
-
Interspecific common bean population derived from Phaseolus acutifolius using a bridging genotype demonstrate useful adaptation to heat tolerance.Front Plant Sci. 2023 May 12;14:1145858. doi: 10.3389/fpls.2023.1145858. eCollection 2023. Front Plant Sci. 2023. PMID: 37293677 Free PMC article.
-
Tepary bean (Phaseolus acutifolius).Methods Mol Biol. 2006;343:407-14. doi: 10.1385/1-59745-130-4:407. Methods Mol Biol. 2006. PMID: 16988363 Review.
-
[Characterization of the nutritional potential of tepari bean (Phaseolus acutifolius) grown in Mexico].Arch Latinoam Nutr. 1988 Dec;38(4):907-24. Arch Latinoam Nutr. 1988. PMID: 3154299 Review. Spanish.
Cited by
-
Bioactive Compounds and Antioxidant Activity in Seeds of Bred Lines of Common Bean Developed from Interspecific Crosses.Foods. 2023 Jul 27;12(15):2849. doi: 10.3390/foods12152849. Foods. 2023. PMID: 37569120 Free PMC article.
-
Exploiting genetic and genomic resources to enhance productivity and abiotic stress adaptation of underutilized pulses.Front Genet. 2023 Jun 16;14:1193780. doi: 10.3389/fgene.2023.1193780. eCollection 2023. Front Genet. 2023. PMID: 37396035 Free PMC article. Review.
-
Effect of Induced Mechanical Leaf Damage on the Yield and Content of Bioactive Molecules in Leaves and Seeds of Tepary Beans (Phaseolus acutifolius).Plants (Basel). 2022 Dec 15;11(24):3538. doi: 10.3390/plants11243538. Plants (Basel). 2022. PMID: 36559649 Free PMC article.
References
-
- Chmura H.E., Glass T.W., Williams C.T. Biologging physiological and ecological responses to climatic variation: New tools for the climate change era. Front. Ecol. Evol. 2018;6:92. doi: 10.3389/fevo.2018.00092. - DOI
-
- Masson-Delmotte V., Pörtner H., Skea J., Zhai P., Roberts D., Shukla P., Pirani A., Pidcock R., Chen Y., Moufouma-Okia W., et al. Resumen Para Responsables de Políticas. Intergovernmental Panel on Climate Change (IPCC); Geneva, Switzerland: 2019. Calentamiento global de 1.5 °C Informe especial del IPCC sobre los impactos del calentamiento global de 1.5 °C con respecto a los niveles preindustriales y las trayectorias correspondientes que deberían seguir las e.
-
- Porch T.G., Hall A.E. Genomics and Breeding for Climate-Resilient Crops. Volume 2. Springer; Berlin/Heidelberg, Germany: 2013. Heat tolerance; pp. 167–202. - DOI
LinkOut - more resources
Full Text Sources
Research Materials
