

Performance Evaluation of a Voice-Based Depression Assessment System Considering the Number and Type of Input Utterances
- PMID: 35009610
- PMCID: PMC8747535
- DOI: 10.3390/s22010067
Performance Evaluation of a Voice-Based Depression Assessment System Considering the Number and Type of Input Utterances
Abstract
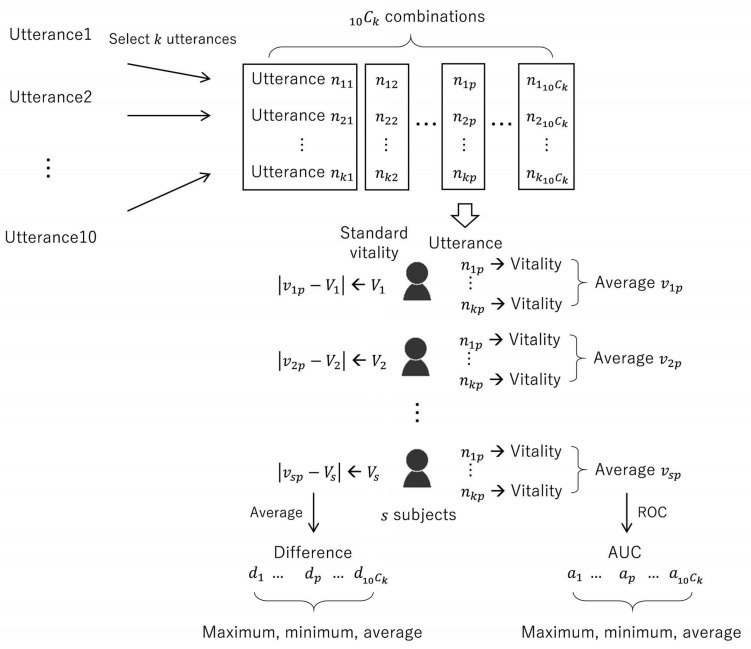
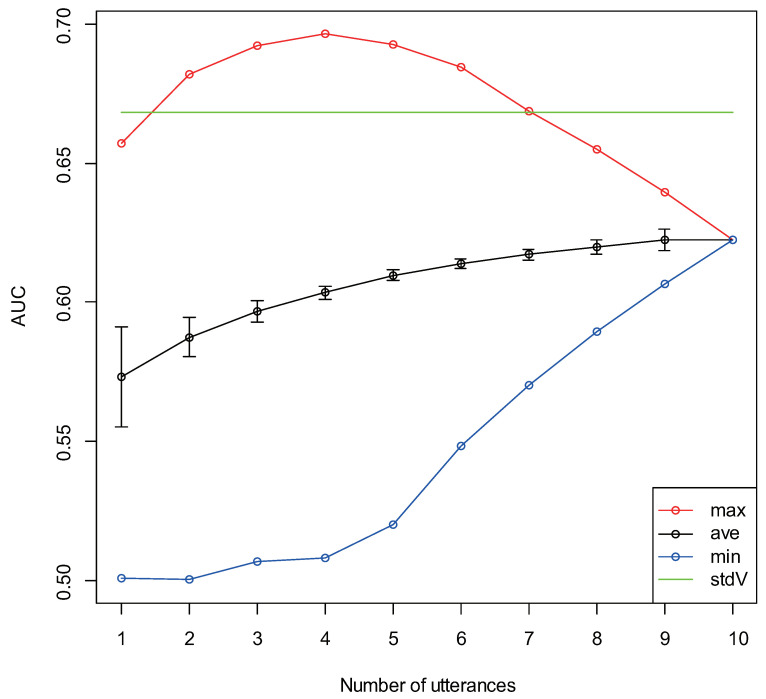
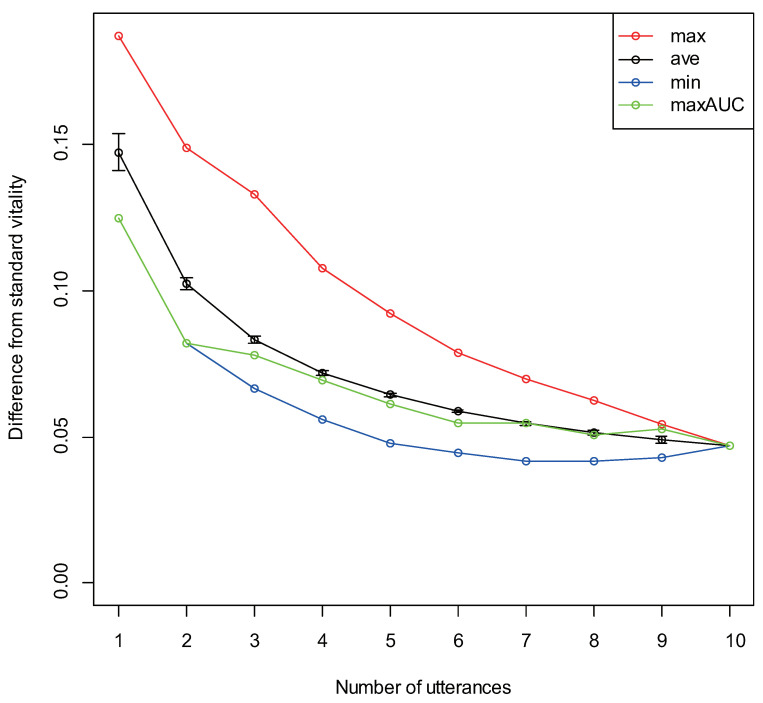
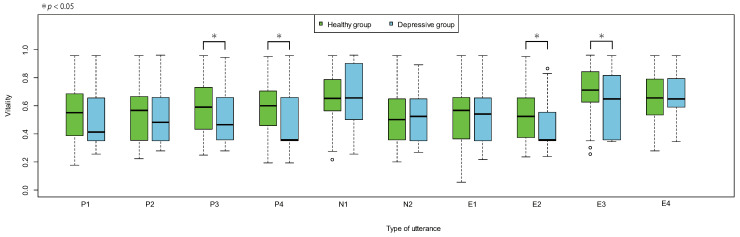
It is empirically known that mood changes affect facial expressions and voices. In this study, the authors have focused on the voice to develop a method for estimating depression in individuals from their voices. A short input voice is ideal for applying the proposed method to a wide range of applications. Therefore, we evaluated this method using multiple input utterances while assuming a unit utterance input. The experimental results revealed that depressive states could be estimated with sufficient accuracy using the smallest number of utterances when positive utterances were included in three to four input utterances.
Keywords: mental health; mood change by positive utterances; voice biomarker.
Conflict of interest statement
M.H., M.N. and S.T. had received financial support from PST Inc. until 2019 and currently report no financial support from the company. All other authors declare no conflict of interest.
Figures
Similar articles
-
Depressive Mood Assessment Method Based on Emotion Level Derived from Voice: Comparison of Voice Features of Individuals with Major Depressive Disorders and Healthy Controls.Int J Environ Res Public Health. 2021 May 19;18(10):5435. doi: 10.3390/ijerph18105435. Int J Environ Res Public Health. 2021. PMID: 34069609 Free PMC article.
-
Speech utterance clustering based on the maximization of within-cluster homogeneity of speaker voice characteristics.J Acoust Soc Am. 2006 Sep;120(3):1631-45. doi: 10.1121/1.2225570. J Acoust Soc Am. 2006. PMID: 17004485
-
The relationship between appraisals of voices (auditory verbal hallucinations) and distress in voice-hearers with schizophrenia-spectrum diagnoses: A meta-analytic review.Schizophr Res. 2021 Apr;230:38-47. doi: 10.1016/j.schres.2021.02.013. Epub 2021 Mar 2. Schizophr Res. 2021. PMID: 33667857 Review.
-
[Ventriloquism and audio-visual integration of voice and face].Brain Nerve. 2012 Jul;64(7):771-7. Brain Nerve. 2012. PMID: 22764349 Review. Japanese.
Cited by
-
The Association between Depression Severity, Prosody, and Voice Acoustic Features in Women with Depression.ScientificWorldJournal. 2023 Dec 5;2023:9928446. doi: 10.1155/2023/9928446. eCollection 2023. ScientificWorldJournal. 2023. PMID: 38089742 Free PMC article.
References
-
- Cohen S., Kessler R.C., Gordon L.U. Measuring Stress: A Guide for Health and Social Scientists. Oxford University Press; Oxford, UK: 1997.
-
- Perkins A. Saving money by reducing stress. Harvard Bus. Rev. 1994;72:12.
-
- Izawa S., Sugaya N., Shirotsuki K., Yamada K.C., Ogawa N., Ouchi Y., Nagano Y., Suzuki K., Nomura S. Salivary dehydroepiandrosterone secretion in response to acute psychosocial stress and its correlations with biological and psychological changes. Biol. Psychol. 2008;79:294–298. doi: 10.1016/j.biopsycho.2008.07.003. - DOI - PubMed
MeSH terms
Grants and funding
LinkOut - more resources
Full Text Sources
Medical
