. 2021 Dec 24;22(1):104.
doi: 10.3390/s22010104.

A Real-Time Wearable Physiological Monitoring System for Home-Based Healthcare Applications

Affiliations

A Real-Time Wearable Physiological Monitoring System for Home-Based Healthcare Applications

Jin-Woo Jeong et al. Sensors (Basel). .

Abstract

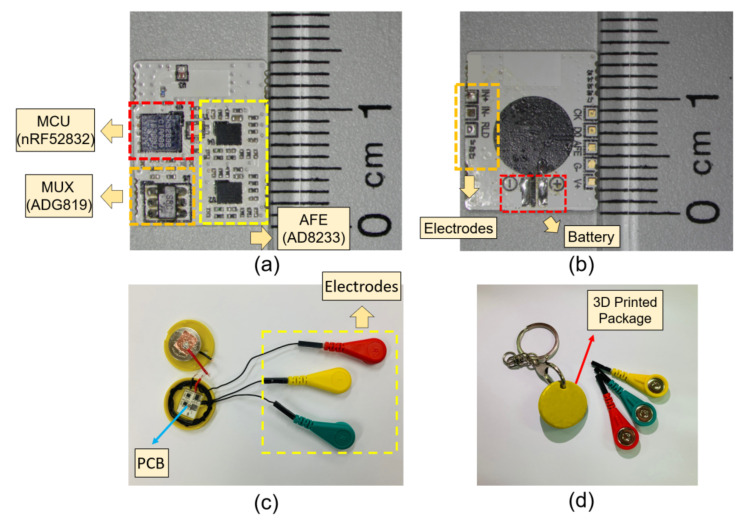
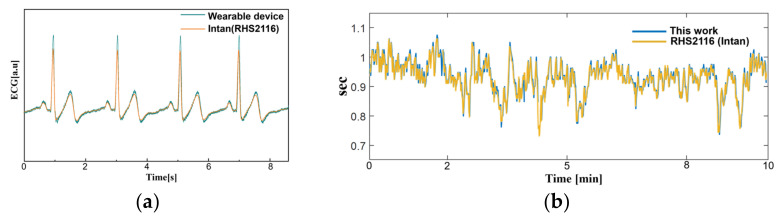
The acquisition of physiological data are essential to efficiently predict and treat cardiac patients before a heart attack occurs and effectively expedite motor recovery after a stroke. This goal can be achieved by using wearable wireless sensor network platforms for real-time healthcare monitoring. In this paper, we present a wireless physiological signal acquisition device and a smartphone-based software platform for real-time data processing and monitor and cloud server access for everyday ECG/EMG signal monitoring. The device is implemented in a compact size (diameter: 30 mm, thickness: 4.5 mm) where the biopotential is measured and wirelessly transmitted to a smartphone or a laptop for real-time monitoring, data recording and analysis. Adaptive digital filtering is applied to eliminate any interference noise that can occur during a regular at-home environment, while minimizing the data process time. The accuracy of ECG and EMG signal coverage is assessed using Bland-Altman analysis by comparing with a reference physiological signal acquisition instrument (RHS2116 Stim/Recording System, Intan). Signal coverage of R-R peak intervals showed almost identical outcome between this proposed work and the RHS2116, showing a mean difference in heart rate of 0.15 ± 4.65 bpm and a Wilcoxon's p value of 0.133. A 24 h continuous recording session of ECG and EMG is conducted to demonstrate the robustness and stability of the device based on extended time wearability on a daily routine.

Keywords: ECG/EMG sensing; physiological monitor; rehabilitation training; smart wearable device; wireless communication.


Conflict of interest statement

The authors declare no conflict of interest.

Figures

Figure 1
Figure 1
Block diagram of the monitoring system. The biopotentials are acquired from the electrodes and amplified by the analog front-end (AFE). The analog signals are sampled and wirelessly transmitted to the host device, where the signal is reconstructed in real-time for monitoring. This data are saved in the local device and stored in a cloud server via Wi-Fi or cellular communication.
Figure 2
Figure 2
Schematic of the analog front-end. Amplification channel is selected from the analog multiplexer (MUX) from the microcontroller. The 2nd-order analog notch filter eliminates the powerline interference and the analog signal is delivered to the ADC for sampling.
Figure 3
Figure 3
Flow chart of the proposed ECG monitoring system. Upon power up, the microcontroller initializes the BLE for standby. The host device pairs with the monitor device for mode selection (ECG, EMG). Once the measurement mode has been selected, the monitor device samples the incoming analog signal and transmits the data to the host device. The host device performs an additional filtering and displays a real-time plot. The data are saved in the local device and uploaded to cloud server for further analysis.
Figure 4
Figure 4
Images of the fabricated device. (a) Top view of the populated PCB; (b) bottom view of the PCB; (c) image of the device encapsulated in a button shaped container with the cap open; (d) the cap of the container is closed, ready for use.
Figure 5
Figure 5
The measurement setup and electrode location. (a) The ECG electrodes were placed in a lead II orientation; (b) EMG electrodes are placed to measure the surface EMG signals from activation signal at the right medial gastrocnemius muscle.
Figure 6
Figure 6
A noise comparison with the captured biopotential signals. (a) ECG acquired outdoors; (b) ECG at 30 cm away from the wall power; (c) EMG acquired outdoors; (d) EMG at 30 cm away from the wall power.
Figure 7
Figure 7
The biopotential signals with additional filtering. (a) Raw ECG acquired from the AFE at 30 cm away from the wall power; (b) ECG filtered with an analog notch filter (twin-T); (c) ECF filtered with an IIR digital filter; (d) ECG filtered with (b,c).
Figure 8
Figure 8
The biopotential signals with additional filtering. (a) Raw EMG acquired from the AFE at 30 cm away from the wall power; (b) EMG filtered with an analog notch filter (twin-T); (c) EMF filtered with an IIR digital filter; (d) EMG filtered with (b,c).
Figure 9
Figure 9
The spectrum of the biopotential signal. (a) Unfiltered ECG signals; (b) filtered ECG signals (analog notch and digital IIR filter); (c) unfiltered EMG; (d) filtered EMG signals (analog notch and digital IIR filter).
Figure 10
Figure 10
Mode selection and real-time signal monitoring from the host device.
Figure 11
Figure 11
A comparison between this work and RHS2116 Stim/Recording System (Intan). (a) Time domain ECG acquired from this work and reference instrument at lead II orientation. (b) The R-R peak interval (heart rate) acquired for 10 min.
Figure 12
Figure 12
Bland–Altman plot of the heart rate. The overall signal coverage of this work shows an almost perfect overlay compared to the reference instrument within a difference of 0.2 ± 4.65 bpm.
Figure 13
Figure 13
A comparison between this work and reference instrument. (a) Time domain EMG signals acquired from the right medial gastrocnemius muscle; (b) the Bland–Altman plot from EMGRMS.
Figure 14
Figure 14
A continuous 30 min averaged BPM for 24 h. The actual ECG signal is displayed for walking and running activity.
Figure 15
Figure 15
Heart rate variability in (a) time domain and (b) frequency domain.
Figure 16
Figure 16
A continuous 30 min averaged EMG intensity for 24 h. The actual EMG signal is displayed for running and walking activity.
Figure 17
Figure 17
Current consumption during continuous monitoring.

Similar articles

Cited by

References

    1. Mozaffarian D., Benjamin E.J., Go A.S., Arnett D.K., Blaha M.J., Cushman M., De Ferranti S., Després J.-P., Fullerton H.J., Howard V.J. Heart disease and stroke statistics—2015 update: A report from the American Heart Association. Circulation. 2015;131:e29–e322. doi: 10.1161/CIR.0000000000000152. - DOI - PubMed
    1. De Raedt S., De Vos A., De Keyser J. Autonomic dysfunction in acute ischemic stroke: An underexplored therapeutic area? J. Neurol. Sci. 2015;348:24–34. doi: 10.1016/j.jns.2014.12.007. - DOI - PubMed
    1. Steinhubl S.R., Waalen J., Edwards A.M., Ariniello L.M., Mehta R.R., Ebner G.S., Carter C., Baca-Motes K., Felicione E., Sarich T. Effect of a home-based wearable continuous ECG monitoring patch on detection of undiagnosed atrial fibrillation: The mSToPS randomized clinical trial. JAMA. 2018;320:146–155. doi: 10.1001/jama.2018.8102. - DOI - PMC - PubMed
    1. Dobkin B.H., Dorsch A. New evidence for therapies in stroke rehabilitation. Curr. Atheroscler. Rep. 2013;15:331. doi: 10.1007/s11883-013-0331-y. - DOI - PMC - PubMed
    1. Hong S., Kim D., Park H., Seo Y., Hussain I., Park S.J. Gait Feature Vectors for Post-stroke Prediction using Wearable Sensor. Sci. Emot. Sensib. 2019;22:55–64. doi: 10.14695/KJSOS.2018.22.3.55. - DOI

LinkOut - more resources