. 2021 Dec 27;22(1):167.
doi: 10.3390/s22010167.

Early Diagnosis of Multiple Sclerosis Using Swept-Source Optical Coherence Tomography and Convolutional Neural Networks Trained with Data Augmentation

Affiliations

Early Diagnosis of Multiple Sclerosis Using Swept-Source Optical Coherence Tomography and Convolutional Neural Networks Trained with Data Augmentation

Almudena López-Dorado et al. Sensors (Basel). .

Abstract

Background: The aim of this paper is to implement a system to facilitate the diagnosis of multiple sclerosis (MS) in its initial stages. It does so using a convolutional neural network (CNN) to classify images captured with swept-source optical coherence tomography (SS-OCT).

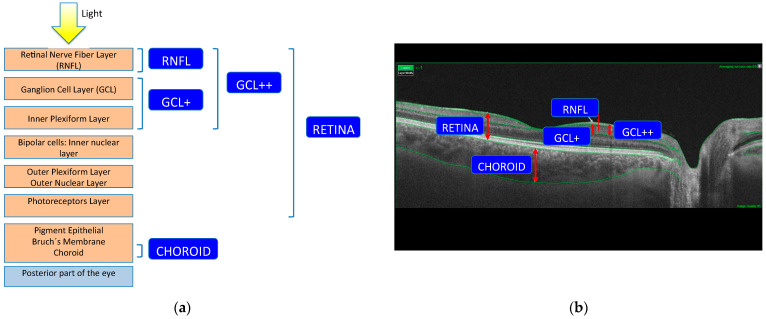
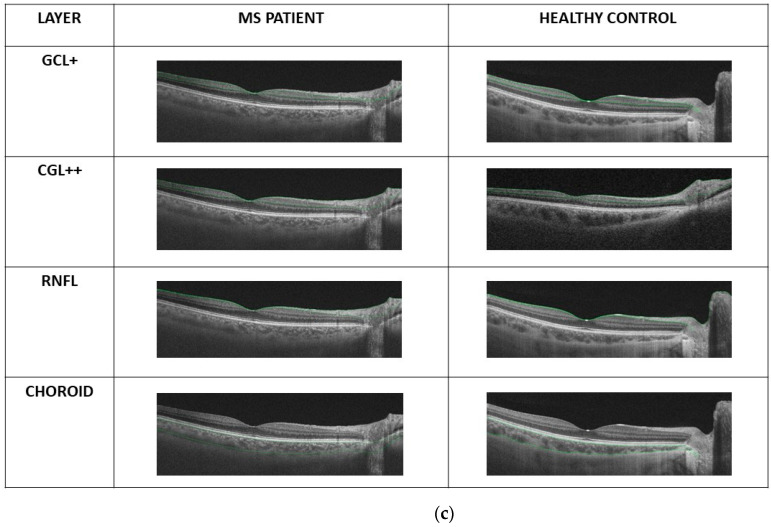
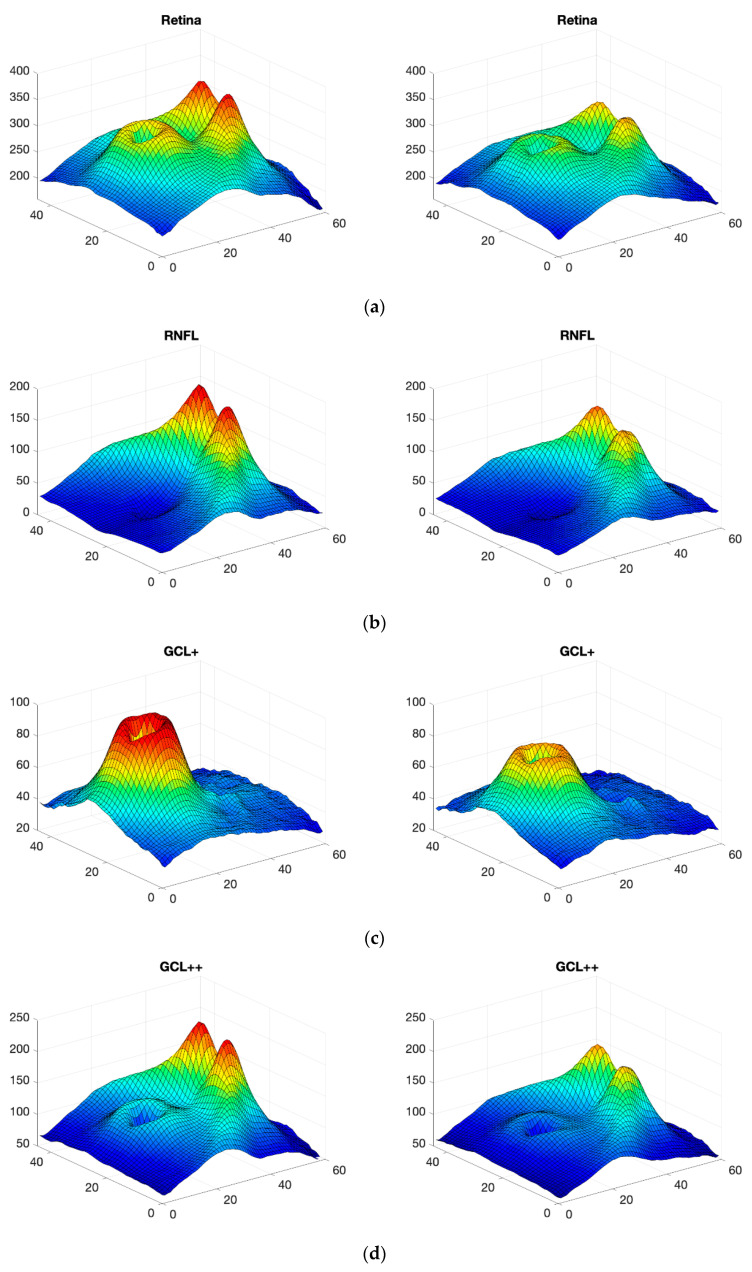
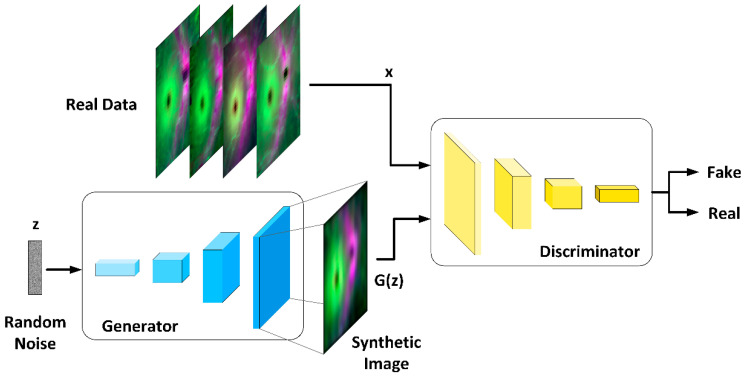
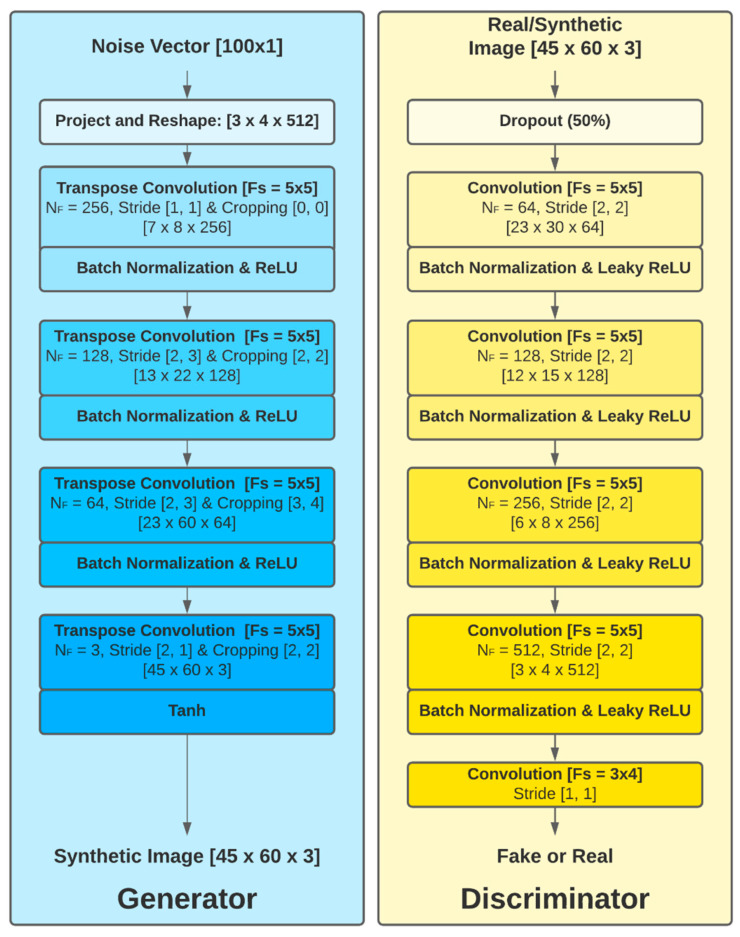
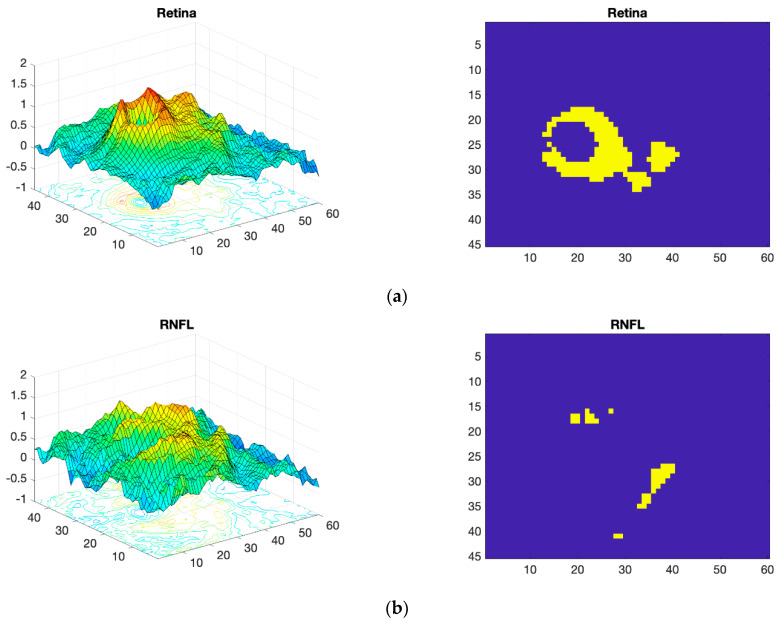
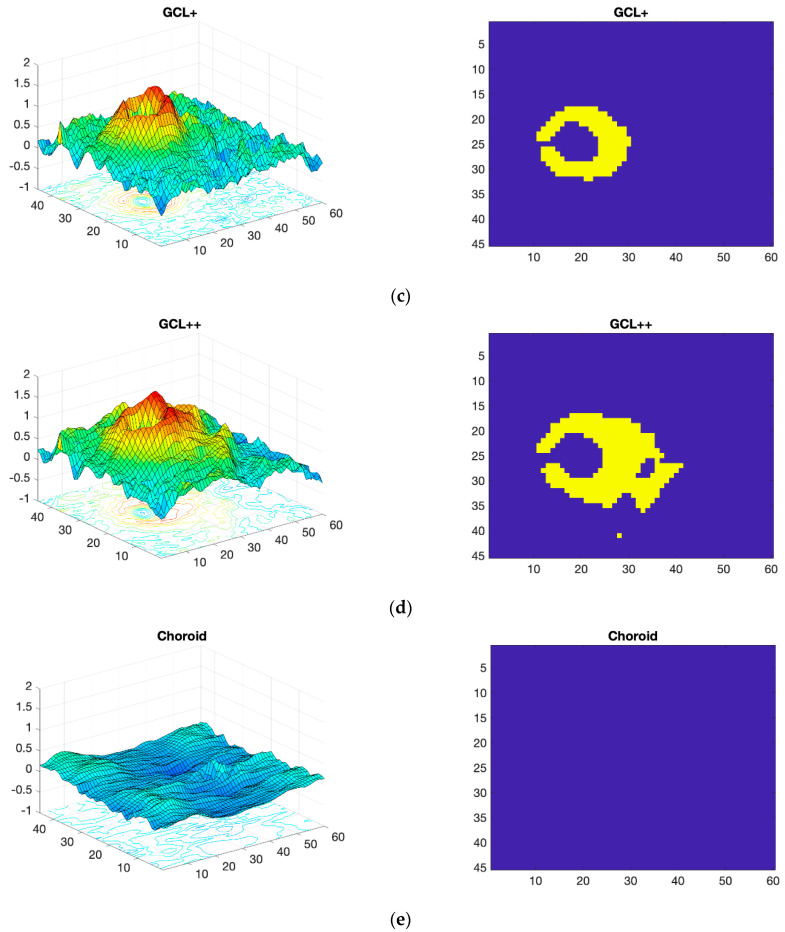
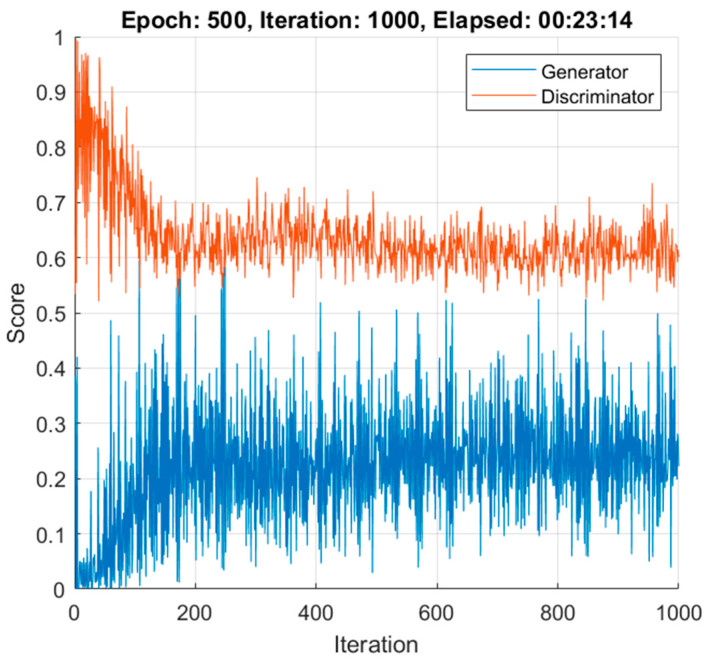
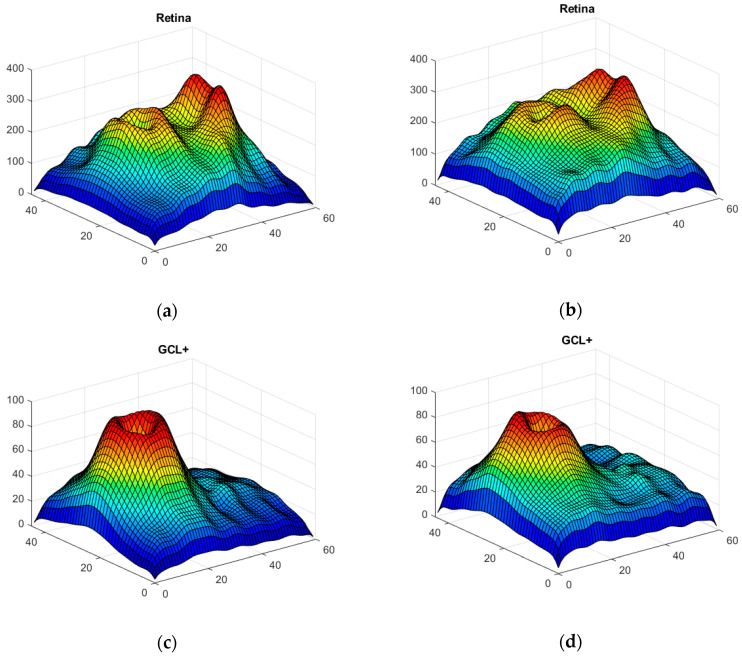
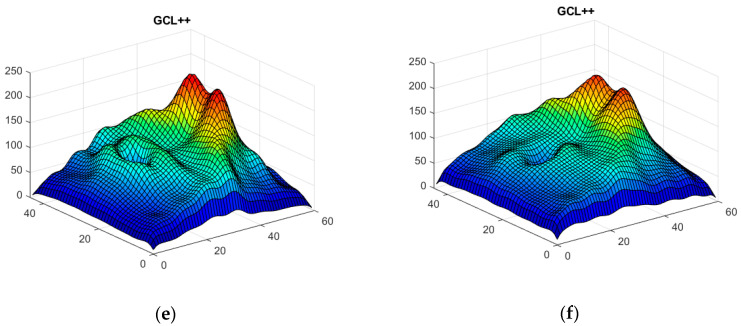
Methods: SS-OCT images from 48 control subjects and 48 recently diagnosed MS patients have been used. These images show the thicknesses (45 × 60 points) of the following structures: complete retina, retinal nerve fiber layer, two ganglion cell layers (GCL+, GCL++) and choroid. The Cohen distance is used to identify the structures and the regions within them with greatest discriminant capacity. The original database of OCT images is augmented by a deep convolutional generative adversarial network to expand the CNN's training set.

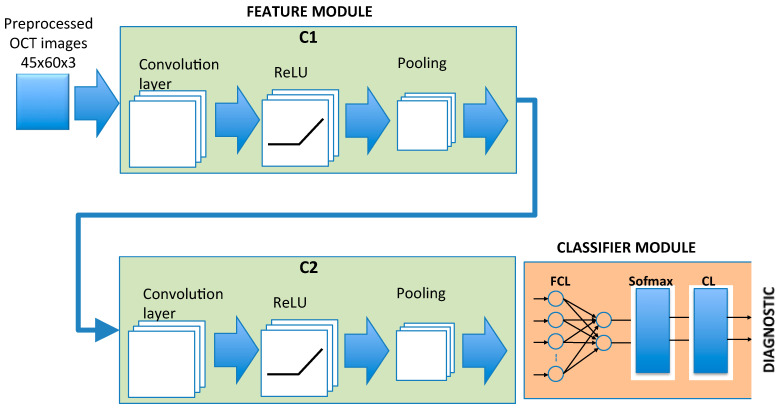
Results: The retinal structures with greatest discriminant capacity are the GCL++ (44.99% of image points), complete retina (26.71%) and GCL+ (22.93%). Thresholding these images and using them as inputs to a CNN comprising two convolution modules and one classification module obtains sensitivity = specificity = 1.0.

Conclusions: Feature pre-selection and the use of a convolutional neural network may be a promising, nonharmful, low-cost, easy-to-perform and effective means of assisting the early diagnosis of MS based on SS-OCT thickness data.

Keywords: convolutional neural network; generative adversarial network; multiple sclerosis; optical coherence tomography.


Conflict of interest statement

The authors declare no conflict of interest. The funders had no role in the design of the study; in the collection, analyses, or interpretation of data; in the writing of the manuscript, or in the decision to publish the results.

Figures

Figure 1
Figure 1
(a) Retinal layer measurements analyzed: RNFL, GCL+, GCL++, complete retina and choroid; (b) OCT scanning source slice image of a normal eye showing, in green, the boundaries of the layers into which the software segments the neuroretina image and the representation of the complexes measured; (c) representation of delimitation of the four retinal layers determined by the segmentation software of Triton OCT (optical coherence tomography) in a patient with multiple sclerosis and in a control subject: GCL+ (ganglion cell layer +: between the boundaries of the retinal nerve fiber layer and the inner nuclear layer, therefore including the GCL and the inner plexiform layer), GCL++ (between the boundaries of the inner limiting membrane and the inner nuclear layer, therefore including the retinal nerve fiber layer and the GCL+), RNFL (retinal nerve fiber layer: between the boundaries of the inner limiting membrane and the GCL) and CHOROID (from Bruch’s membrane to the choroidal-scleral interface).
Figure 1
Figure 1
(a) Retinal layer measurements analyzed: RNFL, GCL+, GCL++, complete retina and choroid; (b) OCT scanning source slice image of a normal eye showing, in green, the boundaries of the layers into which the software segments the neuroretina image and the representation of the complexes measured; (c) representation of delimitation of the four retinal layers determined by the segmentation software of Triton OCT (optical coherence tomography) in a patient with multiple sclerosis and in a control subject: GCL+ (ganglion cell layer +: between the boundaries of the retinal nerve fiber layer and the inner nuclear layer, therefore including the GCL and the inner plexiform layer), GCL++ (between the boundaries of the inner limiting membrane and the inner nuclear layer, therefore including the retinal nerve fiber layer and the GCL+), RNFL (retinal nerve fiber layer: between the boundaries of the inner limiting membrane and the GCL) and CHOROID (from Bruch’s membrane to the choroidal-scleral interface).
Figure 2
Figure 2
3D images of the 5 structures obtained with OCT in real subjects; mean value in all control subjects (left) and mean value in MS patients (right). (a) complete retina; (b) RNFL; (c) GCL+; (d) GCL++; (e) choroid.
Figure 2
Figure 2
3D images of the 5 structures obtained with OCT in real subjects; mean value in all control subjects (left) and mean value in MS patients (right). (a) complete retina; (b) RNFL; (c) GCL+; (d) GCL++; (e) choroid.
Figure 3
Figure 3
CNN architecture implemented. C1, C2: convolutional submodules. FCL: fully connected layer. CL: classification layer.
Figure 4
Figure 4
GAN framework workflow.
Figure 5
Figure 5
Generator and discriminator architecture. NF: number of filters; Fs = filter dimensions.
Figure 6
Figure 6
Processed OCT images of real subjects. Left: Cohen’s d value for the various structures. Right: the best regions, selected with a threshold of dTH = 1.02 (identical for all layers), are shown in yellow. (a) Complete retina; (b) RNFL; (c) GCL+; (d) GCL++; (e) choroid.
Figure 6
Figure 6
Processed OCT images of real subjects. Left: Cohen’s d value for the various structures. Right: the best regions, selected with a threshold of dTH = 1.02 (identical for all layers), are shown in yellow. (a) Complete retina; (b) RNFL; (c) GCL+; (d) GCL++; (e) choroid.
Figure 7
Figure 7
Generator and discriminator learning curve loss over time.
Figure 8
Figure 8
3D images of the 3 structures synthesized with DCGAN; mean value in all control subjects (left) and mean value in MS patients (right). (a,b) Complete retina; (c,d) GCL+ layer; (e,f) GCL++ layer.
Figure 8
Figure 8
3D images of the 3 structures synthesized with DCGAN; mean value in all control subjects (left) and mean value in MS patients (right). (a,b) Complete retina; (c,d) GCL+ layer; (e,f) GCL++ layer.

Similar articles

Cited by

References

    1. Ker J., Wang L., Rao J., Lim T. Deep Learning Applications in Medical Image Analysis. IEEE Access. 2018;6:9375–9389. doi: 10.1109/ACCESS.2017.2788044. - DOI
    1. Salem M., Valverde S., Cabezas M., Pareto D., Oliver A., Salvi J., Rovira A., Llado X. Multiple Sclerosis Lesion Synthesis in MRI Using an Encoder-Decoder U-NET. IEEE Access. 2019;7:25171–25184. doi: 10.1109/ACCESS.2019.2900198. - DOI
    1. McKinley R., Wepfer R., Grunder L., Aschwanden F., Fischer T., Friedli C., Muri R., Rummel C., Verma R., Weisstanner C., et al. Automatic detection of lesion load change in Multiple Sclerosis using convolutional neural networks with segmentation confidence. NeuroImage Clin. 2020;25:102104. doi: 10.1016/j.nicl.2019.102104. - DOI - PMC - PubMed
    1. Marzullo A., Kocevar G., Stamile C., Durand-Dubief F., Terracina G., Calimeri F., Sappey-Marinier D. Classification of Multiple Sclerosis Clinical Profiles via Graph Convolutional Neural Networks. Front. Neurosci. 2019;13:594. doi: 10.3389/fnins.2019.00594. - DOI - PMC - PubMed
    1. Litjens G., Ciompi F., Wolterink J.M., de Vos B.D., Leiner T., Teuwen J., Išgum I. State-of-the-Art Deep Learning in Cardiovascular Image Analysis. JACC Cardiovasc. Imaging. 2019;12:1549–1565. doi: 10.1016/j.jcmg.2019.06.009. - DOI - PubMed