. 2021 Dec 25;19(1):220.
doi: 10.3390/ijerph19010220.

SARS-CoV-2 Aerosol Transmission Indoors: A Closer Look at Viral Load, Infectivity, the Effectiveness of Preventive Measures and a Simple Approach for Practical Recommendations

Affiliations

SARS-CoV-2 Aerosol Transmission Indoors: A Closer Look at Viral Load, Infectivity, the Effectiveness of Preventive Measures and a Simple Approach for Practical Recommendations

Martin Kriegel et al. Int J Environ Res Public Health. .

Abstract

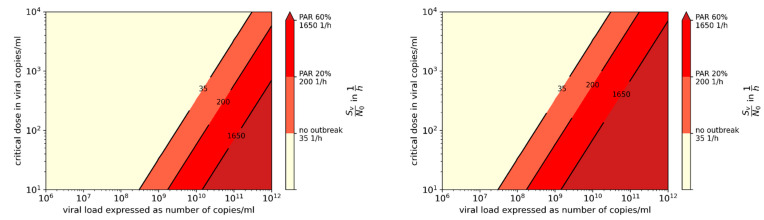
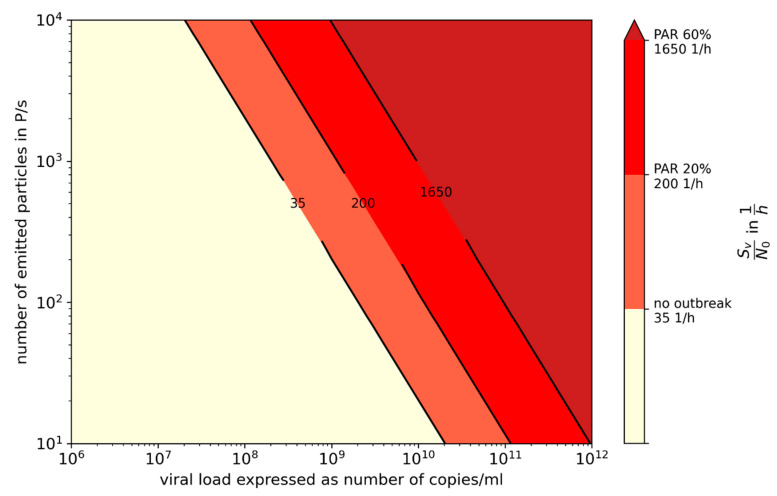
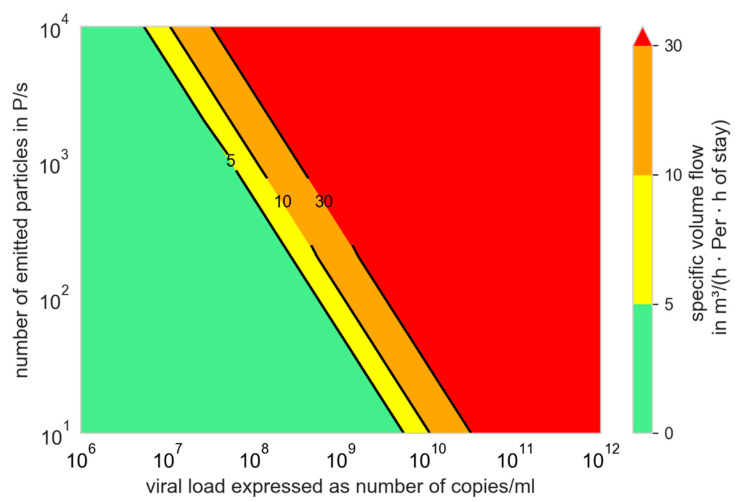
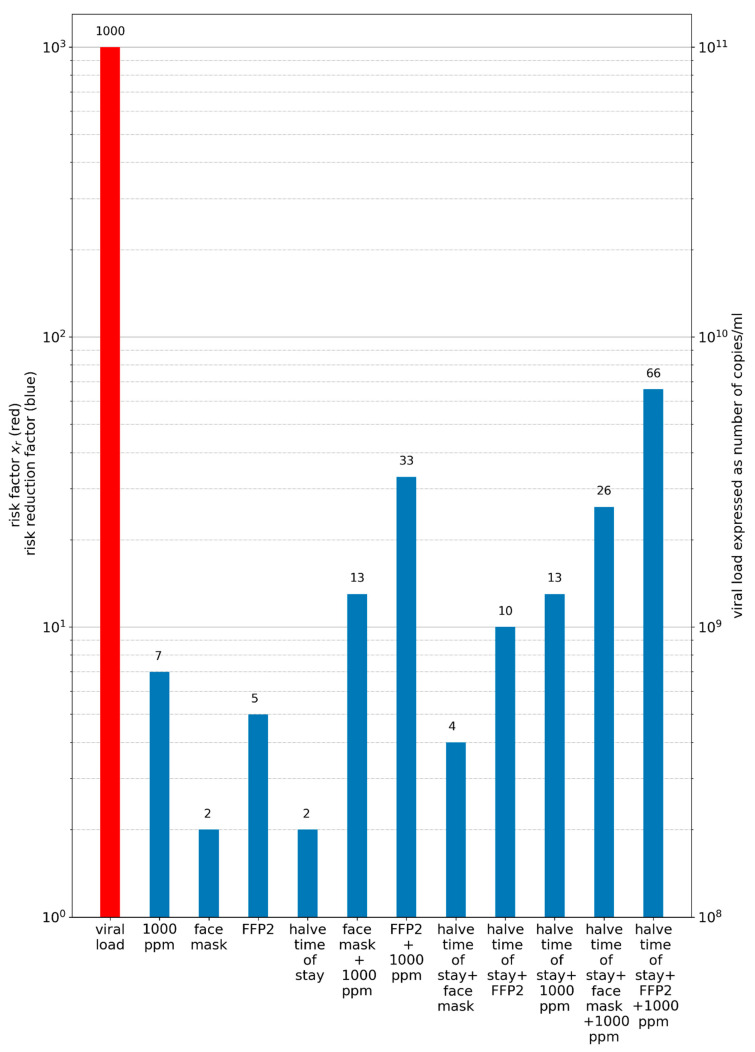
There is uncertainty about the viral loads of infectious individuals required to transmit COVID-19 via aerosol. In addition, there is a lack of both quantification of the influencing parameters on airborne transmission and simple-to-use models for assessing the risk of infection in practice, which furthermore quantify the influence of non-medical preventive measures. In this study, a dose-response model was adopted to analyze 25 documented outbreaks at infection rates of 4-100%. We show that infection was only possible if the viral load was higher than 108 viral copies/mL. Based on mathematical simplifications of our approach to predict the probable situational attack rate (PARs) of a group of persons in a room, and valid assumptions, we provide simplified equations to calculate, among others, the maximum possible number of persons and the person-related virus-free air supply flow necessary to keep the number of newly infected persons to less than one. A comparison of different preventive measures revealed that testing contributes the most to the joint protective effect, besides wearing masks and increasing ventilation. In addition, we conclude that absolute volume flow rate or person-related volume flow rate are more intuitive parameters for evaluating ventilation for infection prevention than air exchange rate.

Keywords: SARS-CoV-2; airborne transmission; infection prevention; risk assessment model; simplified approaches.


Conflict of interest statement

The authors declare no competing interest.

Figures

Figure 1
Figure 1
Relative concentration curve as a function of air change rate and time, based on the steady-state concentration.
Figure 2
Figure 2
Particle emission rates measured by some of the authors, for adults [35,37,38], for adolescents [39] and for children [41].
Figure 3
Figure 3
Virus factor (VF) for different viral loads and particle emission rates with N0 = 100 viral copies. The attack rates found in the investigated outbreaks are shown with the different colors; the markers show the amount of virus factor at assumed mean particle emission rate of the related activity according to Figure 2.
Figure 4
Figure 4
Virus factor (VF) for different viral loads and particle emission rates with N0 = 300 viral copies. The attack rates found in the investigated outbreaks are shown with the different colors; the markers show the amount of virus factor at assumed mean particle emission rate of the related activity according to Figure 2.
Figure 5
Figure 5
Specific volume flow depending on the number of emitted particles and the viral load to limit the number of newly infected persons to one; N0 = 100 viral copies, fM = 1, Qb,in = Qb,ex = 0.54 m3/h.
Figure 6
Figure 6
Comparison of the risk factor xr for different everyday life situations with a 0.5 h stay in a supermarket, wearing a mask as reference.
Figure 7
Figure 7
Virus factor for different viral loads and critical doses with a particle emission rate of 100 P/s, (left) and 1000 P/s (right); the attack rates found in the investigated outbreaks are shown with different colors.
Figure 8
Figure 8
Viral emission for different viral loads and particle emission rates with N0 = 67 viral copies; the attack rates found in the investigated outbreaks are shown with different colors.
Figure 9
Figure 9
Specific volume flow depending on the number of emitted, particles and the viral load to limit the number of newly infected persons to one; N0 = 67 viral copies, fM = 1, Qb,in = Qb,e = 0.54 m3/h.
Figure 10
Figure 10
Influence of different preventive measures on the risk of an outbreak. The red bar represents the viral load and the resulting risk factor (Equation (37)). The blue bars illustrate different combinations of preventive measures in the form of a risk reduction factor (also according to Equation (37)).

References

    1. Li Y., Qian H., Hang J., Chen X., Cheng P., Hong L., Liang P., Wang S., Liang P., Li J., et al. Probable airborne transmission of SARS-CoV-2 in a poorly ventilated restaurant. Build. Environ. 2021;196:107788. doi: 10.1016/j.buildenv.2021.107788. - DOI - PMC - PubMed
    1. Correia G., Rodrigues L., da Silva M.G., Gonçalves T. Airborne route and bad use of ventilation systems as non-neglible factors in SARS-CoV-2 transmission. Med. Hypotheses. 2020;141:109781. doi: 10.1016/j.mehy.2020.109781. - DOI - PMC - PubMed
    1. Ferretti L., Wymant C., Kendall M., Zhao L., Nurtay A., Abeler-Dörner L., Parker M., Bonsall D., Fraser C. Quantifying SARS-CoV-2 transmission suggests epidemic control with digital contact tracing. Science. 2020;368:eabb6936. doi: 10.1126/science.abb6936. - DOI - PMC - PubMed
    1. Greenhalgh T., Jimenez J.L., Prather K.A., Tufekci Z., Fisman D., Schooley R. Ten scientific reasons in support of airborne transmission of SARS-CoV-2. Lancet. 2021;397:1603–1605. doi: 10.1016/S0140-6736(21)00869-2. - DOI - PMC - PubMed
    1. Leung N.H. Transmissibility and transmission of respiratory viruses. Nat. Rev. Microbiol. 2021;19:528–545. doi: 10.1038/s41579-021-00535-6. - DOI - PMC - PubMed