. 2021 Dec 24;14(1):67.
doi: 10.3390/nu14010067.

Regulatory Effects of Quercetin on M1/M2 Macrophage Polarization and Oxidative/Antioxidative Balance

Affiliations

Regulatory Effects of Quercetin on M1/M2 Macrophage Polarization and Oxidative/Antioxidative Balance

Cheng-Fang Tsai et al. Nutrients. .

Abstract

Macrophage polarization plays essential and diverse roles in most diseases, such as atherosclerosis, adipose tissue inflammation, and insulin resistance. Homeostasis dysfunction in M1/M2 macrophage polarization causes pathological conditions and inflammation. Neuroinflammation is characterized by microglial activation and the concomitant production of pro-inflammatory cytokines, leading to numerous neurodegenerative diseases and psychiatric disorders. Decreased neuroinflammation can be obtained by using natural compounds, including flavonoids, which are known to ameliorate inflammatory responses. Among flavonoids, quercetin possesses multiple pharmacological applications and regulates several biological activities. In the present study, we found that quercetin effectively inhibited the expression of lipocalin-2 in both macrophages and microglial cells stimulated by lipopolysaccharides (LPS). The production of nitric oxide (NO) and expression levels of the pro-inflammatory cytokines, inducible nitric oxide synthase (iNOS) and cyclooxygenase (COX)-2, were also attenuated by quercetin treatment. Our results also showed that quercetin significantly reduced the expression levels of the M1 markers, such as interleukin (IL)-6, tumor necrosis factor (TNF)-α, and IL-1β, in the macrophages and microglia. The M1 polarization-associated chemokines, C-C motif chemokine ligand (CCL)-2 and C-X-C motif chemokine ligand (CXCL)-10, were also effectively reduced by the quercetin treatment. In addition, quercetin markedly reduced the production of various reactive oxygen species (ROS) in the microglia. The microglial phagocytic ability induced by the LPS was also effectively reduced by the quercetin treatment. Importantly, the quercetin increased the expression levels of the M2 marker, IL-10, and the endogenous antioxidants, heme oxygenase (HO)-1, glutamate-cysteine ligase catalytic subunit (GCLC), glutamate-cysteine ligase modifier subunit (GCLM), and NAD(P)H quinone oxidoreductase-1 (NQO1). The enhancement of the M2 markers and endogenous antioxidants by quercetin was activated by the AMP-activated protein kinase (AMPK) and Akt signaling pathways. Together, our study reported that the quercetin inhibited the effects of M1 polarization, including neuroinflammatory responses, ROS production, and phagocytosis. Moreover, the quercetin enhanced the M2 macrophage polarization and endogenous antioxidant expression in both macrophages and microglia. Our findings provide valuable information that quercetin may act as a potential drug for the treatment of diseases related to inflammatory disorders in the central nervous system.

Keywords: homeostasis; inflammation; macrophage; microglia; oxidative stress; quercetin.


Conflict of interest statement

The authors declare that they have no competing interests.

Figures

Figure 1
Figure 1
Inhibitory effects of quercetin on lipocalin-2 expression in macrophages and microglial cells. Mouse macrophage (RAW264.7) (A) and adult mouse microglial (IMG) (B) cells were stimulated with various concentrations of quercetin (1, 5, or 10 μM) for 30 min followed by stimulation with lipopolysaccharides (LPS) (50 ng/mL) for another 6 h. The mRNA levels of of lipocalin-2 were analyzed by real-time polymerase chain reaction (PCR) and normalized to β-actin. Each bar represents the mean ± standard error of the mean (SEM) (n = 3). Note: *** p < 0.005, ** p < 0.01 compared with the control group. ### p < 0.005, ## p < 0.01, # p < 0.05 compared with the LPS alone group.
Figure 2
Figure 2
Inhibitory effects of quercetin on inducible nitric oxide synthase (iNOS) and cyclooxygenase (COX)-2 expression levels in macrophages. RAW264.7 cells were stimulated with various concentrations of quercetin (1, 5, or 10 μM) for 30 min followed by stimulation with LPS (50 ng/mL) for another 24 h. iNOS and COX-2 protein levels were determined by western blotting analysis (A). Quantitative results are shown in (C,D). (B) The supernatant was collected to determine nitric oxide (NO) production by the Griess reaction. Each bar represents the mean ± SEM of n = 3–4. Note: *** p < 0.005, ** p < 0.01 compared with the control group. ### p < 0.005, ## p < 0.01 compared with the LPS alone group.
Figure 3
Figure 3
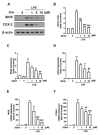
Inhibitory effects of quercetin on iNOS and COX-2 expression levels in microglial cells. IMG cells were stimulated with various concentrations of quercetin (1, 5, or 10 μM) for 30 min, followed by stimulation with LPS (50 ng/mL) for another 24 or 6 h. iNOS and COX-2 protein levels were determined by western blotting analysis (A). (B) The supernatant was collected to determine NO production by the Griess reaction. Quantitative results are shown in (C) and (D). mRNA levels of iNOS (E) and COX-2 (F) were analyzed by real-time PCR and normalized to β-actin. Each bar represents the mean ± SEM of n = 3–4. *** p < 0.005, ** p < 0.01 compared with the control group. Note: ### p < 0.005, ## p < 0.01, # p < 0.05 compared with the LPS alone group.
Figure 4
Figure 4
Inhibitory effects of quercetin on the expression of proinflammatory mediators in macrophages and microglial cells. RAW264.7 (A,C,E) and IMG (B,D,F) cells were stimulated with various concentrations of quercetin (1, 5, or 10 μM) for 30 min followed by stimulation with LPS (50 ng/mL) for another 6 h. mRNA levels of interleukin (IL)-1β (A,B), tumor necrosis factor (TNF)-α (C,D), and IL-6 (E,F) were analyzed by real-time PCR and normalized to β-actin. Each bar represents the mean ± SEM of n = 3–4. ***p < 0.005, **p < 0.01 compared with the control group. Note: ### p < 0.005, ## p < 0.01, # p < 0.05 compared with the LPS alone group.
Figure 5
Figure 5
Inhibitory effects of quercetin on the expression of inflammatory mediators in macrophages and microglial cells. RAW264.7 (A,B) and IMG (C,D) cells were stimulated with various concentrations of quercetin (1, 5, or 10 μM) for 30 min followed by stimulation with LPS (50 ng/mL) for another 6 h. mRNA levels of C-X-C motif chemokine ligand (CXCL)-10 (A,C) and C–C motif chemokine ligand (CCL)-2 (B,D) were analyzed by real-time PCR and normalized to β-actin. Each bar represents the mean ± SEM (n = 3). Note: *** p < 0.005 compared with the control group. ### p < 0.005, ## p < 0.01, # p < 0.05 compared with the LPS alone group.
Figure 6
Figure 6
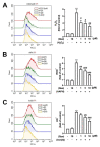
Effects of quercetin on reactive oxygen species (ROS) production in microglial cells. IMG cells were stimulated with various concentrations of quercetin (1, 5, or 10 μM) for 30 min followed by stimulation with 5 mM hydrogen peroxide (H2O2) (A), 5 mM 2, 2′-azobis (2-amidinopropane) hydrochloride (AAPH) (B), or 1 mM iron(II) plus 0.5 mM H2O2 (C) for another 90 min. Following incubation with 10 μM 2′, 7′-dichlorodihydrofluorescein diacetate (DCFH-DA) for 40 min, dichlorofluorescein (DCF) fluorescence intensity was detected by flow cytometry. Each bar represents the mean ± SEM (n = 4). *** p < 0.005 compared with the control group. Note: ### p < 0.005, ## p < 0.01, # p < 0.05 compared with the stimulated group alone.
Figure 7
Figure 7
Effects of quercetin on the phagocytic ability of microglial cells. (A) IMG cells were stimulated either with quercetin (10 μM) or LPS (10 ng/mL) alone for 24 h. In figure B to D, following LPS (10 ng/mL) stimulation, cells were also co-treated with quercetin (1 μM in (B); 5 μM in (C); 10 μM in (D)) for 24 h. By monitoring the degree of fluorescence intensity by flow cytometry, populations of microglia that engulfed 0, 1, 2, or more beads can be differentiated. The quantitative results were shown in (E). Each bar represents the mean ± SEM of n = 4. Note: *** p < 0.005, * p < 0.05 compared with the control group. ## p < 0.01, # p < 0.05 compared with the LPS alone group.
Figure 8
Figure 8
Effects of quercetin on the expression levels of anti-inflammation gene IL-10 in macrophages and microglial cells. RAW264.7 (A) and IMG (B) cells were stimulated with various concentrations of quercetin (1, 5, or 10 μM) for 6 h. The mRNA levels IL-10 were analyzed by real-time PCR and normalized to β-actin. Each bar represents the mean ± SEM (n = 3). Note: ** p < 0.01, * p < 0.05 compared with the control group.
Figure 9
Figure 9
Effects of quercetin on the expression levels of endogenous antioxidants in microglial cells. IMG cells were stimulated with various concentrations of quercetin (1, 5, or 10 μM) for 6 h. mRNA levels of heme oxygenase (HO)-1 (A), glutamate-cysteine ligase catalytic subunit (GCLC) (B), glutamate-cysteine ligase modifier subunit (GCLM) (C), and NAD(P)H quinone oxidoreductase-1 (NQO1) (D) were analyzed by real-time PCR and normalized to β-actin. Each bar represents the mean ± SEM of n = 3–4. Note: *** p < 0.005, ** p < 0.01, compared with the control group.
Figure 10
Figure 10
Quercetin promotes the expression of endogenous antioxidants in microglial cells. IMG cells were stimulated with various concentrations of quercetin (1, 5, or 10 μM) for 24 h. HO-1, GCLC, GCLM, and NQO1 protein levels were determined by western blotting analysis (A,B). The quantitative results of HO-1 (C), GCLC (D), GCLM (E), and NQO1 (F) were determined using ImageJ software. Each bar represents the mean ± SEM (n = 3). Note: *** p < 0.001, ** p < 0.01, * p < 0.05 compared with the control group.
Figure 11
Figure 11
AMP-activated protein kinase (AMPK) and Akt signaling pathways are involved in the expression of quercetin-upregulated endogenous antioxidants. IMG cells were treated with quercetin (10 μM) for the indicated time periods (30, 60, or 120 min). The phosphorylated levels of AMPK (A) and Akt (B) were determined by western blotting analysis. Cells were treated with the AMPK inhibitor compound C (15 μM) or Akt inhibitor (10 μM) for 30 min and then stimulated with quercetin (10 μM) for 6 h. mRNA levels of IL-10 (C), HO-1 (D), GCLC (E), GCLM (F), and NQO1 (G) were analyzed by real-time PCR and normalized to β-actin. Each bar represents the mean ± SEM of n = 3–4. *** p < 0.005 compared with the control group. Note: ### p < 0.005, ## p < 0.01 compared with the quercetin alone group.

References

    1. Gordon S., Martinez F.O. Alternative activation of macrophages: Mechanism and functions. Immunity. 2010;32:593–604. doi: 10.1016/j.immuni.2010.05.007. - DOI - PubMed
    1. Song M.G., Ryoo I.G., Choi H.Y., Choi B.H., Kim S.T., Heo T.H., Lee J.Y., Park P.H., Kwak M.K. NRF2 Signaling Negatively Regulates Phorbol-12-Myristate-13-Acetate (PMA)-Induced Differentiation of Human Monocytic U937 Cells into Pro-Inflammatory Macrophages. PLoS ONE. 2015;10:e0134235. doi: 10.1371/journal.pone.0134235. - DOI - PMC - PubMed
    1. Kim J.Y., Kim N., Yenari M.A. Mechanisms and potential therapeutic applications of microglial activation after brain injury. CNS Neurosci. Ther. 2015;21:309–319. doi: 10.1111/cns.12360. - DOI - PMC - PubMed
    1. Nakagawa Y., Chiba K. Diversity and plasticity of microglial cells in psychiatric and neurological disorders. Pharmacol. Ther. 2015;154:21–35. doi: 10.1016/j.pharmthera.2015.06.010. - DOI - PubMed
    1. Bagheri H., Ghasemi F., Barreto G.E., Sathyapalan T., Jamialahmadi T., Sahebkar A. The effects of statins on microglial cells to protect against neurodegenerative disorders: A mechanistic review. BioFactors (Oxf. Engl.) 2019;46:309–325. doi: 10.1002/biof.1597. - DOI - PubMed

MeSH terms