

Associations between Taste Perception Profiles and Empirically Derived Dietary Patterns: An Exploratory Analysis among Older Adults with Metabolic Syndrome
- PMID: 35011017
- PMCID: PMC8747383
- DOI: 10.3390/nu14010142
Associations between Taste Perception Profiles and Empirically Derived Dietary Patterns: An Exploratory Analysis among Older Adults with Metabolic Syndrome
Abstract
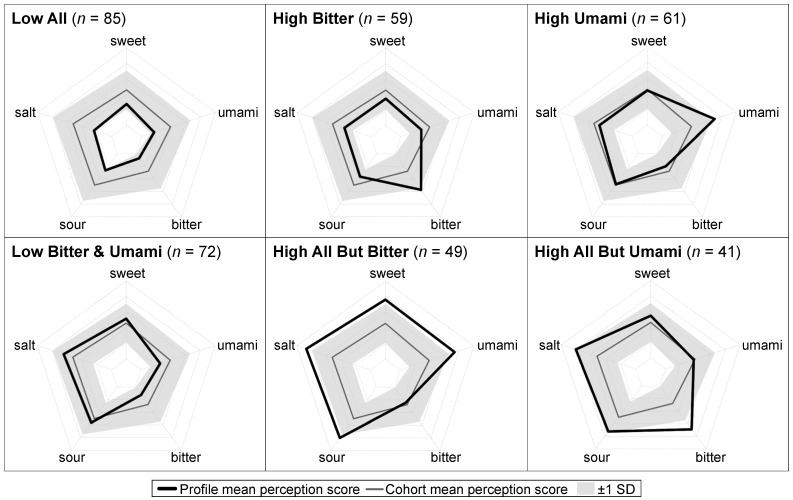
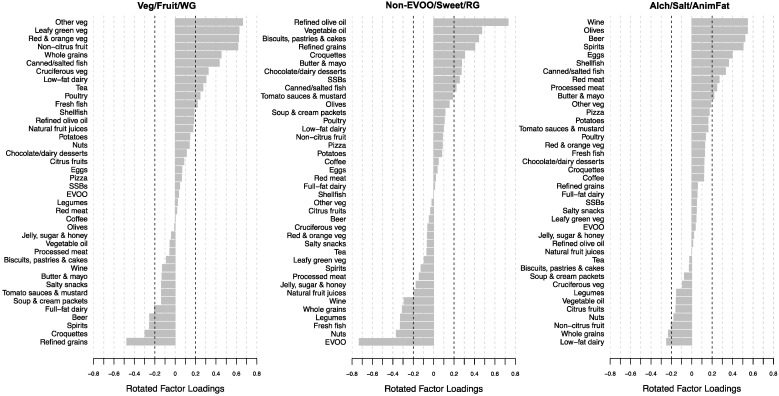
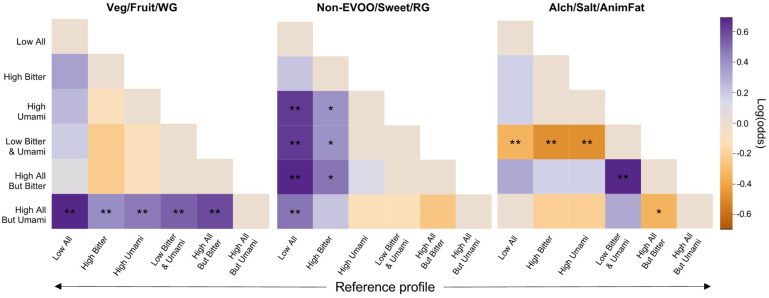
Taste perception is a primary driver of food choices; however, little is known about how perception of all five tastes (sweet, salt, sour, bitter, umami) collectively inform dietary patterns. Our aim was to examine the associations between a multivariable measure of taste perception-taste perception profiles-and empirically derived dietary patterns. The cohort included 367 community-dwelling adults (55-75 years; 55% female; BMI = 32.2 ± 3.6 kg/m2) with metabolic syndrome from PREDIMED-Plus, Valencia. Six taste perception profiles were previously derived via data-driven clustering (Low All, High Bitter, High Umami, Low Bitter and Umami, High All But Bitter, High All But Umami); three dietary patterns were derived via principal component analysis (% variance explained = 20.2). Cross-sectional associations between profiles and tertials of dietary pattern adherence were examined by multinomial logistic regression. Overall, there were several significant differences in dietary pattern adherence between profiles: the vegetables, fruits, and whole grains pattern was significantly more common for the High All But Umami profile (OR range for high vs. low adherence relative to other profiles (1.45-1.99; 95% CI minimum lower, maximum upper bounds: 1.05, 2.74), the non-extra virgin olive oils, sweets, and refined grains pattern tended to be less common for Low All or High Bitter profiles (OR range: 0.54-0.82), while the alcohol, salty foods, and animal fats pattern tended to be less common for Low Bitter and Umami and more common for High All But Bitter profiles (OR range: 0.55-0.75 and 1.11-1.81, respectively). In conclusion, among older adults with metabolic syndrome, taste perception profiles were differentially associated with dietary patterns, suggesting the benefit of integrating taste perception into personalized nutrition guidance.
Keywords: bitter; data-driven; dietary patterns; individual differences; personalized nutrition; salt; sour; sweet; taste; taste perception; umami.
Conflict of interest statement
The authors declare no conflict of interest. The funders had no role in the design of the study; in the collection, analyses, or interpretation of data; in the writing of the manuscript, or in the decision to publish the results.
Figures
References
-
- Afshin A., Sur P.J., Fay K.A., Cornaby L., Ferrara G., Salama J.S., Mullany E.C., Abate K.H., Abbafati C., Abebe Z., et al. Health Effects of Dietary Risks in 195 Countries, 1990–2017: A Systematic Analysis for the Global Burden of Disease Study 2017. Lancet. 2019;393:1958–1972. doi: 10.1016/S0140-6736(19)30041-8. - DOI - PMC - PubMed
-
- U.S. Department of Agriculture and U.S. Department of Health and Human Services . Dietary Guidelines for Americans, 2020–2025. 9th ed. US Government Publishing Office; Washington, DC, USA: 2020.
MeSH terms
Grants and funding
- PI16/00366/Spanish Ministry of Health (Instituto de Salud Carlos III) and the Ministerio de Economía y Competitividad-Fondo Europeo de Desarrollo Regional (FEDER)
- 00/Lynne Ausman Scholarship for Interdisciplinary Studies, Friedman School of Nutrition Science and Policy, Tufts University
- K22HL135075/NH/NIH HHS/United States
- 2018/The Rei Jaume I Award for Medical Research
- CIBER 06/03/the Spanish Ministry of Health (Instituto de Salud Carlos III) and the Ministerio de Economía y Competitividad-Fondo Europeo de Desarrollo Regional (FEDER)
- 58-80-50-9-004/USDA Non-Assistant Cooperative Agreement
- PI19/00781/Spanish Ministry of Health (Instituto de Salud Carlos III) and the Ministerio de Economía y Competitividad-Fondo Europeo de Desarrollo Regional (FEDER)
- P30 DK111022/DK/NIDDK NIH HHS/United States
- 00/Gerald Cassidy Student Innovation Award, Jean Mayer USDA Human Nutrition Research Center on Aging, Tufts University
- PI13/00728/Spanish Ministry of Health (Instituto de Salud Carlos III) and the Ministerio de Economía y Competitividad-Fondo Europeo de Desarrollo Regional (FEDER)
- SAF2016-80532-R/Spanish Ministry of Health (Instituto de Salud Carlos III) and the Ministerio de Economía y Competitividad-Fondo Europeo de Desarrollo Regional (FEDER)
- UJI-B2018-69/University Jaume I
- PID2019-108858RB-I00/AEI 10.13039/501100011033 and "ERDF A way of making Europe"
- R01AA028263/NH/NIH HHS/United States
- PROMETEO 2017/017/Generalitat Valenciana
- COGRUP/2016/06/University Jaume I
- PI06/1326/Spanish Ministry of Health (Instituto de Salud Carlos III) and the Ministerio de Economía y Competitividad-Fondo Europeo de Desarrollo Regional (FEDER)
LinkOut - more resources
Full Text Sources
Medical
