. 2021 Dec 24;11(1):42.
doi: 10.3390/cells11010042.

TNFα Mediates Inflammation-Induced Effects on PPARG Splicing in Adipose Tissue and Mesenchymal Precursor Cells

Affiliations

TNFα Mediates Inflammation-Induced Effects on PPARG Splicing in Adipose Tissue and Mesenchymal Precursor Cells

Simona Cataldi et al. Cells. .

Abstract

Low-grade chronic inflammation and reduced differentiation capacity are hallmarks of hypertrophic adipose tissue (AT) and key contributors of insulin resistance. We identified PPARGΔ5 as a dominant-negative splicing isoform overexpressed in the AT of obese/diabetic patients able to impair adipocyte differentiation and PPARγ activity in hypertrophic adipocytes. Herein, we investigate the impact of macrophage-secreted pro-inflammatory factors on PPARG splicing, focusing on PPARGΔ5. We report that the epididymal AT of LPS-treated mice displays increased PpargΔ5/cPparg ratio and reduced expression of Pparg-regulated genes. Interestingly, pro-inflammatory factors secreted from murine and human pro-inflammatory macrophages enhance the PPARGΔ5/cPPARG ratio in exposed adipogenic precursors. TNFα is identified herein as factor able to alter PPARG splicing-increasing PPARGΔ5/cPPARG ratio-through PI3K/Akt signaling and SRp40 splicing factor. In line with in vitro data, TNFA expression is higher in the SAT of obese (vs. lean) patients and positively correlates with PPARGΔ5 levels. In conclusion, our results indicate that inflammatory factors secreted by metabolically-activated macrophages are potent stimuli that modulate the expression and splicing of PPARG. The resulting imbalance between canonical and dominant negative isoforms may crucially contribute to impair PPARγ activity in hypertrophic AT, exacerbating the defective adipogenic capacity of precursor cells.

Keywords: PPARG splicing; TNFα; adipocyte precursors; dominant negative isoform; hypertrophic obesity; inflammation.


Conflict of interest statement

The authors declare no conflict of interests.

Figures

Figure 1
Figure 1
Inflammation affects Pparg expression and splicing in vitro and in vivo: (A) Relative mRNA quantification (qPCR) of canonical Pparg transcripts (cPparg), PpargΔ5 (left panel), PpargΔ5/cPparg ratio (right panel) and Pparγ target genes (i.e., Adipoq, Slc2a4 and Cd36, (B)) in epididymal adipose tissue of C57BL/6JB-LPS injected mice (n = 6). Epididymal adipose tissue from control mice (n = 7) was used as reference samples and 36b4 as reference gene. Data are reported as mean ± SEM of independent experiments. * p ≤0.05, ** p ≤ 0.01 and *** p ≤ 0.001. (C) Relative mRNA quantification (qPCR) of the PpargΔ5/cPparg ratio at different time points of 3T3-L1 adipocyte differentiation (i.e., 2, 4 and 8 days upon differentiation induction) carried out in presence of conditioned medium (CM) of J774.A1 macrophages (MΦ) activated and not with LPS. 3T3-L1 differentiated in mature adipocytes with control medium with or without LPS were used as reference samples. 36b4 was used as reference gene. Data are reported as mean ± SEM of at least six independent experiments. * p ≤ 0.05, ** p ≤ 0.01. (D) Representative images of 3T3-L1 differentiated in mature adipocytes (i.e., 8 days upon differentiation induction) in presence and not of CM collected from LPS activated J774.A1 MΦ (scale bar 25 µm). Lipid accumulation was measured by optical determination of Oil red O staining and reported in the bar graph. 3T3-L1 terminally differentiated in mature adipocytes with control medium plus LPS were used as reference samples. Data are reported as mean ± SEM of three independent experiments. ** p ≤ 0.01. (E) Relative mRNA quantification (qPCR) of Pparγ target genes (i.e., Adipoq, Slc2a4 and Cd36) at different time points of 3T3-L1 adipocyte differentiation (i.e., 2, 4 and 8 days upon differentiation induction) carried out in presence of CM of LPS activated J774.A1 cells. 3T3-L1 differentiated in mature adipocytes with control medium plus LPS were used as reference samples (dotted line) and 36b4 as reference gene. Data are reported as mean ± SEM of at least three independent experiments. * p ≤ 0.05, ** p ≤ 0.01 and *** p ≤ 0.001.
Figure 2
Figure 2
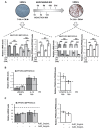
Human pro-inflammatory macrophages secretome perturbs PPARG splicing in human mesenchymal stem cells: (A) Representative images (upper panel) of human mesenchymal stem cells (hMSCs) at an undifferentiated stage (i.e., 0 h) and completely differentiated in mature adipocytes (i.e., 21 days upon differentiation induction) by using an induction and a maintaining mixes as reported on the timeline. hMSCs at 0 h and 21 d after adipocyte differentiation were treated for 24 h with conditioned medium (CM) of THP-1 macrophages (MΦ) activated and not with LPS. Below are reported relative mRNA levels (qPCR) of cPPARG, PPARGΔ5 and the PPARGΔ5/cPPARG ratio in hMSCs at 0 h (left panel) and in hMSCs at 21 d (right panel) treated with CM of MΦ. hMSCs at 0 h or at 21 d treated with control medium supplemented or not with LPS were used as reference samples and PPIA as reference gene. Data are reported as mean ± SEM of at least three independent experiments. * p ≤ 0.05, ** p ≤0.01 and *** p ≤ 0.001. (B) Relative mRNA quantification (qPCR) of cPPARG, PPARGΔ5 (left panel) and the PPARGΔ5/cPPARG ratio (right panel) in hMSCs at the undifferentiated stage treated for 24 h with the CM of primary monocyte-derived macrophages polarized in the pro-inflammatory (i.e., LPS/IFNγ-inducedMΦ) or anti-inflammatory (IL10-induced MΦ) type. hMSCs at 0 h treated with the CM of non-polarized primary monocyte-derived macrophages were used as a reference sample (dotted lines) and PPIA as a reference gene. Data are reported as mean ± SEM of at least three independent experiments. * p ≤ 0.05, ** p ≤ 0.01 and *** p ≤ 0.001. (C) Relative mRNA quantification (qPCR) of cPPARG, PPARGΔ5 (left panel) and the PPARGΔ5/cPPARG ratio (right panel) in hMSCs at 0 h treated for 3 h with 2 or 5 mg/mL of actinomycin D. hMSCs at 0h treated with vehicle (i.e., DMSO) were used as a reference sample (dotted lines). PPIA was used as reference gene. Data are reported as mean ± SEM of at least three independent experiments.
Figure 3
Figure 3
TNFα increases the PPARGΔ5/cPPARG ratio in adipocyte precursor cells and correlates with PPARGΔ5 expression in obese patients: (A) Relative mRNA quantification (qPCR) of cPPARG, PPARGΔ5 (left panel) and the PPARGΔ5/cPPARG ratio (right panel) in undifferentiated hMSCs treated for 24 h with 10 ng/mL of human recombinant TNFα, IL-6, IL-1β or IL-8 cytokines. hMSCs treated with vehicle (i.e., PBS) were used as reference samples (dotted lines) and PPIA as reference gene. Data are reported as mean ± SEM of at least three independent experiments. * p ≤ 0.051 and *** p ≤ 0.001. (B) Relative mRNA quantification (qPCR) of cPPARG, PPARGΔ5 (left panel) and the PPARGΔ5/cPPARG ratio (right panel) in hMSCs at undifferentiated stage treated for 24 h with 10 or 20 ng/mL of human recombinant TNFα cytokine. hMSCs treated with vehicle (i.e., PBS) were used as reference samples (dotted lines) and PPIA as reference gene. Data are reported as mean ± SEM of at least three independent experiments. * p ≤ 0.05, ** p ≤ 0.01 and *** p ≤ 0.001. (C) Relative mRNA quantification (qPCR) of cPPARG, PPARGΔ5 (left panel) and the PPARGΔ5/cPPARG ratio (right panel) in undifferentiated hMSCs treated for 24 h with conditioned medium (CM) of LPS-activated MΦ (THP-1) plus 0.5 mg/mL of human neutralizing antibody against TNFα or anti-IgG1 Isotype. hMSCs treated with control medium supplemented with antibody against anti-IgG1 Isotype were used as reference samples (dotted lines). PPIA was used as the reference gene. Data are reported as mean ± SEM of at least three independent experiments. * p ≤ 0.05 and *** p ≤ 0.001. (D) Boxplot showing TNFA levels in three different subgroups of individuals from the German cohort, classified according to their BMI in lean (n = 14), overweight (n = 17) and obesity (n = 24). Data are reported as 40-ΔCt value ± DEVST. RPS23 was used as reference gene. *** p ≤ 0.001.
Figure 4
Figure 4
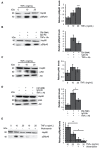
TNFα increases SRp40 phosphorylation through AKT: (A) Representative autoradiograph of Western blot analysis (left panel) of SRp40 phosphorylation (i.e., pSRp40) levels in hMSCSc at T = 0 h treated for 30 min with 10 or 20 ng/mL of TNFα cytokine or with vehicle (i.e., PBS). Hsp90 was used as a loading control. Bar graphs (right panel) report relative pSRp40 levels normalized on Hsp90 expression (pixel density analysis of Western blots). Data are representative of the mean ± SEM of three independent experiments. *** p ≤ 0.001. (B) Representative Western blot of pSRp40 (left panel) on lysates from undifferentiated hMSCs treated for 24 h with conditioned medium (CM) of LPS-activated MΦ (THP-1) or control medium plus 0.5 mg/mL of human neutralizing antibody against TNFα or anti-IgG1 Isotype. Hsp90 was used as loading control. Bar graphs (right panel) report relative pSRp40 levels normalized on Hsp90 expression (pixel density analysis of Western blots). Data are representative of the mean ±SEM of three independent experiments. ** p ≤ 0.01. (C) Representative immunoblotting of Akt phosphorylation (i.e., pAkt) and total Akt levels (right panel) in hMSCSc at T = 0 h treated for 30 min with 10 or 20 ng/mL of TNFα cytokine or with vehicle (i.e., PBS). Hsp90 was used as loading control. Bar graphs (right panel) report relative pAkt levels normalized on Hsp90 and total Akt expression (pixel density analysis of Western blots). Data are representative of the mean ± SEM of three independent experiments. (D) Representative autoradiograph of Western blot analysis (left panel) of pAkt and total Akt levels in undifferentiated hMScs treated for 24 h with the CM of LPS-activated MΦ (THP-1) or control medium plus 0.5 mg/mL of human neutralizing antibody against TNFα or anti-IgG1 Isotype. Hsp90 was used as loading control. Bar graphs (right panel) report relative pAkt levels normalized on Hsp90 and total Akt expression (pixel density analysis of Western blots). Data are representative of the mean ± SEM of at least three independent experiments. * p ≤ 0.05 and ** p ≤ 0.01. (E) Representative immunoblotting of pSRp40 (left panel) in undifferentiated hMSCs treated with Wortmannin or vehicle (i.e., DMSO) in combination and not with 10 or 20 ng/mL of TNFα cytokine. Hsp90 was used as loading control. Bar graphs (right panel) report relative pSRp40 levels normalized on Hsp90 expression (pixel density analysis of Western blots). Data are representative of the mean ± SEM of at least three independent experiments. * p ≤ 0.05 and ** p ≤ 0.01.
Figure 5
Figure 5
SRp40 is involved in the PPARG splicing modulation induced by TNFα: (A) Relative mRNA quantification (qPCR) of cPPARG, PPARGΔ5 (left panel) and the PPARGΔ5/cPPARG ratio (right panel) in hMSCs at the undifferentiated stage knock out for SRSF5 and treated for 24 h with 0, 10 or 20 ng/mL of human recombinant TNFα cytokine. hMSCs at 0 h transfected scrambled and treated for 24 h with 0, 10 or 20 ng/mL of human recombinant TNFα cytokine were used as reference samples (dotted lines). PPIA was used as the reference gene. Data are reported as mean ± SEM of at least three independent experiments. * p ≤ 0.05 and ** p ≤ 0.01. (B) Western blot of SRp40 phosphorylation (i.e., pSRp40; left panel) levels in hMSCs at T = 0 h treated with wortmannin or vehicle (i.e., DMSO) in combination and not with 10 or 20 ng/mL of TNFα cytokine. Hsp90 was used as loading control. Bar graphs (right panel) report relative pSRp40 levels normalized on Hsp90 expression (pixel density analysis of Western blot). (C) Relative mRNA quantification (qPCR) of cPPARG, PPARGΔ5 (left panel) and the PPARGΔ5/cPPARG ratio (right panel) in hMSCs at the undifferentiated stage treated with 10 or 20 ng/mL of human recombinant TNFα cytokine in combination or not with KHCB19 inhibitor. hMSCs at 0h treated for 24 h with 10 or 20 ng/mL of human recombinant TNFα cytokine and with vehicle (i.e., DMSO) were used as reference samples (dotted lines). PPIA was used as the reference gene. Data are reported as mean ±SEM of at least three independent experiments. * p ≤ 0.05. (D) Relative mRNA quantification (qPCR) of cPPARG, PPARGΔ5 (left panel) and the PPARGΔ5/cPPARG ratio (right panel) in hMSCs at the undifferentiated stage treated with 10 or 20 ng/mL of human recombinant TNFα cytokine and with or without Wortmannin inhibitor. hMSCs at 0 h treated for 24 h with 10 or 20 ng/mL of human recombinant TNFα cytokine and with vehicle (i.e., DMSO) were used as reference samples (dotted lines). PPIA was used as the reference gene. Data are reported as mean ± SEM of at least three independent experiments. * p ≤ 0.05 and ** p ≤ 0.01.

References

    1. Blüher M. Metabolically Healthy Obesity. Endocr. Rev. 2020;41:405–420. doi: 10.1210/endrev/bnaa004. - DOI - PMC - PubMed
    1. Bray G.A., Kim K.K., Wilding J.P.H., World Obesity Federation Obesity: A chronic relapsing progressive disease process. A position statement of the World Obesity Federation. Obes. Rev. 2017;18:715–723. doi: 10.1111/obr.12551. - DOI - PubMed
    1. Lumeng C.N., Saltiel A. Inflammatory links between obesity and metabolic disease. J. Clin. Investig. 2011;121:2111–2117. doi: 10.1172/JCI57132. - DOI - PMC - PubMed
    1. Olefsky J.M., Glass C.K. Macrophages, Inflammation, and Insulin Resistance. Annu. Rev. Physiol. 2010;72:219–246. doi: 10.1146/annurev-physiol-021909-135846. - DOI - PubMed
    1. Hotamisligil G.S. Inflammation and metabolic disorders. Nature. 2006;444:860–867. doi: 10.1038/nature05485. - DOI - PubMed

Publication types

MeSH terms