. 2021 Dec 24;11(1):49.
doi: 10.3390/cells11010049.

Altered Ca2+ Homeostasis in Red Blood Cells of Polycythemia Vera Patients Following Disturbed Organelle Sorting during Terminal Erythropoiesis

Affiliations

Altered Ca2+ Homeostasis in Red Blood Cells of Polycythemia Vera Patients Following Disturbed Organelle Sorting during Terminal Erythropoiesis

Ralfs Buks et al. Cells. .

Abstract

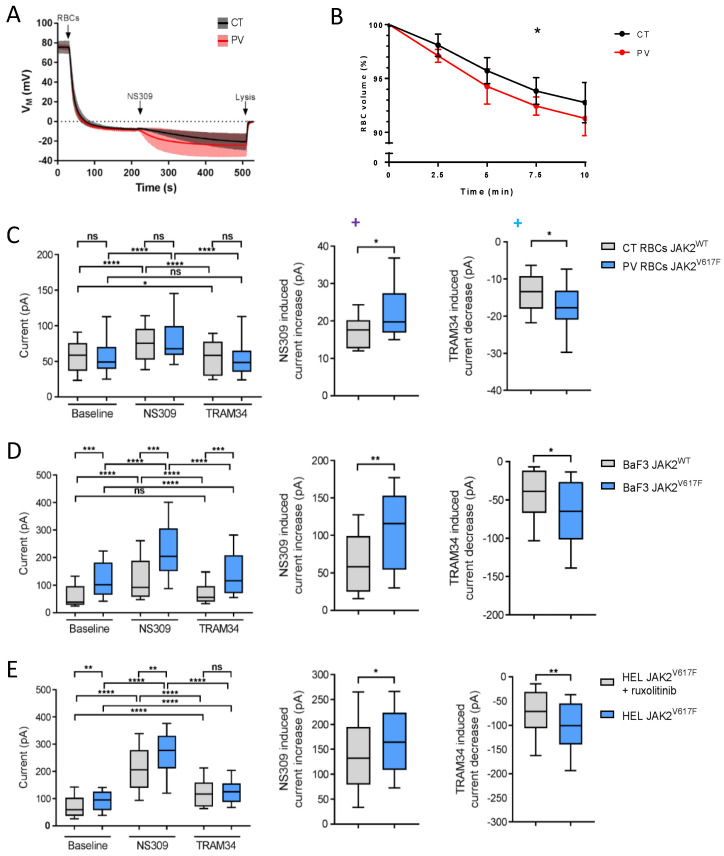
Over 95% of Polycythemia Vera (PV) patients carry the V617F mutation in the tyrosine kinase Janus kinase 2 (JAK2), resulting in uncontrolled erythroid proliferation and a high risk of thrombosis. Using mass spectrometry, we analyzed the RBC membrane proteome and showed elevated levels of multiple Ca2+ binding proteins as well as endoplasmic-reticulum-residing proteins in PV RBC membranes compared with RBC membranes from healthy individuals. In this study, we investigated the impact of JAK2V617F on (1) calcium homeostasis and RBC ion channel activity and (2) protein expression and sorting during terminal erythroid differentiation. Our data from automated patch-clamp show modified calcium homeostasis in PV RBCs and cell lines expressing JAK2V617F, with a functional impact on the activity of the Gárdos channel that could contribute to cellular dehydration. We show that JAK2V617F could play a role in organelle retention during the enucleation step of erythroid differentiation, resulting in modified whole cell proteome in reticulocytes and RBCs in PV patients. Given the central role that calcium plays in the regulation of signaling pathways, our study opens new perspectives to exploring the relationship between JAK2V617F, calcium homeostasis, and cellular abnormalities in myeloproliferative neoplasms, including cellular interactions in the bloodstream in relation to thrombotic events.

Keywords: Ca2+; JAK2V617F; enucleation; organelle sorting; polycythemia vera; red blood cells; reticulocytes.


Conflict of interest statement

The authors declare no conflict of interest.

Figures

Figure 1
Figure 1
PV RBCs show elevated free intracellular Ca2+ levels. (A) Representative histogram overlays from Fluo4 stained CT (healthy individual) and PV RBCs in an isotonic solution without extracellular Ca2+. (B) Percentage of Fluo4-positive RBCs (left panel) and mean fluorescence intensity (MFI) of the positive population (right panel) without extracellular Ca2+. Mean with SD, n = 9, Wilcoxon test, * p < 0.05.
Figure 2
Figure 2
PV RBCs show increased Gárdos channel activity. (A) CCCP method analysis of PV and CT RBC membrane potential changes upon 100 µM NS309 addition. At the end of the experiment, cells were lysed with 3M NaCl 1% Triton X lysis solution to obtain the zero membrane potential (pHi = pHo) for absolute calculation of membrane potential. CT (mean—black line; SD—grey) and PV (mean—red line; SD—pink) RBCs. Data are displayed as mean with 95% confidence interval; CT (n = 6) and PV (n = 8). (B) Cell volume assay on Gárdos activity; 0.05% RBCs suspension was prepared in PBS with a final concertation of 0.2% BSA, 1 mM CaCl2, and 100 µM NS309. RBC size was measured using CASY before and 2.5, 5, 7.5, and 10 min after 100 μM NS309 addition. Mean with SD, n = 6, Mann–Whitney test. (CE) Patch-clamp analysis. Upon cell catch external solution was added to the wells followed by 10 µM NS3623, 10 µM NS309, 5 µM TRAM-34, and 30 µM GdCl3. Currents were measured at room temperature applying −100 to +80 mV ramp voltage protocol for 300 ms, at a holding potential of −30 mV. The cell response was measured in pA at +80 mV. Statistical analysis of the currents at +80 mV in NS309 and TRAM-34 responding cells in (C) CT and PV RBCs (n = 17; n = 48, respectively), (D) BaF3 EpoR JAK2WT (n = 20) and BaF3 EpoR JAK2V617F (n = 48), and (E) HEL (n = 61) and HEL cells treated with 0.3 µM ruxolitinib for 24 h (n = 63). Cell was considered responsive if it displayed at least a 20% current change. The left panel represents the cell current upon the addition of NS3623 (baseline), NS309, and TRAM-34. The central panel displays NS309-induced current increase, while the right panels represent TRAM-34-induced current decrease. The data are presented as median and box plots (25–75%) with whiskers (10–90%). Mann–Whitney test or Wilcoxon test, * p < 0.05; ** p < 0.01; *** p < 0.001; **** p < 0.0001; ns—not significant.
Figure 3
Figure 3
JAK2V617F is associated with decreased erythroid cell size during mouse in vivo erythropoiesis. Representative forward scatter area (FCS-A) flow cytometry histogram of (A) (left panel) mature RBCs and (B) (left panel) reticulocytes from JAK2WT and JAK2V617F mice peripheral blood. Analysis of FCS-A (cell size) in (A) (right panel) mature RBCs and (B) (right panel) reticulocytes from JAK2WT and JAK2V617F mice peripheral blood. n = 7, mean with SD, Mann–Whitney test. (C) (left panel) Gating strategy and (right panel) representative images selecting the cells facing the camera (orange) out from the cells not facing the camera (purple) by imaging flow cytometry. M01–cell area mask (y-axis), cut-off of 12.8 on Ch01 (brightfield) object circularity using a tight cell size mask (x-axis). (D) Analysis of Hoechst neg/CD71neg (mature RBC) area of JAK2WT and JAK2V617F mice peripheral blood cells facing the camera. n = 6, mean with SD, Mann–Whitney test. Analysis of erythroid cell size area changes during terminal erythroid differentiation in vivo in mice Hoechstpos/CD71pos and Hoechstneg/CD71pos or neg populations of the cells facing the camera in (E) bone marrow and (F) spleen. n = 6, mean with SD, Mann–Whitney test, * p < 0.05; ** p < 0.01; *** p < 0.001; ns—not significant.
Figure 4
Figure 4
JAK2V617F is associated with higher organelle remnants in circulating mouse reticulocytes. (A) Representative flow cytometry histogram gating strategy selecting the thiazole orange-positive (reticulocyte) population in JAK2WT mouse peripheral blood. (B) Representative flow cytometry histograms of thiazole orange-positive populations between JAK2WT and JAK2V617F circulating reticulocytes. (C) Analysis of a thiazole orange-positive (reticulocyte) population in JAK2WT and JAK2V617F mouse peripheral blood. (D) Analysis of mean fluorescence intensity (MFI) of thiazole orange in circulating reticulocytes between JAK2WT and JAK2V617F mice. (C,D) n = 7, mean with SD, Mann–Whitney test. (E) Representative imaging flow cytometry example of a nucleated cell, reticulocyte, and a mature RBC from JAK2WT mouse peripheral blood stained with Hoechst and MitoFluor dyes. (F) Percentage of Hoechst-negative and MitoFluor-positive population (reticulocytes) in JAK2WT (n = 6) and JAK2V617F mice (n = 5) peripheral blood. Mean with SD, Mann–Whitney test. (G) Analysis of MFI of MitoFluor in JAK2WT (n = 6) and JAK2V617F mice (n = 5) circulating reticulocytes. Mean with SD, Mann–Whitney test, ** p < 0.01; *** p < 0.001.
Figure 5
Figure 5
Altered organelle sorting during enucleation of JAK2V617F mouse erythroblasts. Representative imaging flow cytometry images of (A) an enucleating orthoerythroblast and (B) an erythroblast and CD71high, medium, low, negative expressing reticulocytes in mice stained with Hoechst, Ter119, CD71, and MitoFluor. Analysis of MitoFluor mean pixel intensity in erythroblasts and CD71high, medium, low, negative expressing reticulocytes in JAK2WT and JAK2V617F mice; (B) (top panel) bone marrow and (bottom panel) spleen. n = 6, mean with SD, Mann–Whitney test, * p < 0.05; ** p < 0.01; ns—not significant.
Figure 6
Figure 6
Altered organelle sorting during enucleation of JAK2V617F mouse erythroblasts. (A) Gating strategy selecting mice enucleating erythroblasts by imaging flow cytometry. (Left) Selection of elongated Ter119+/Hoechst+ cells by a brightfield (BF) shape ratio range of 0.45–0.70, and a delta centroid Hoechst and BF range of 0–4. (Right) Enucleating cell selection from previously selected elongated cells by cell surface area. Nascent pyrenocyte area (x-axis) mask defined as the area covered by Hoechst positive staining, range 25–50 µm2. Nascent reticulocyte area (y-axis) mask defined as BF area without Hoechst area, range 20–30 µm2. (Bottom panel) Representative images of an enucleating erythroblast gated cell in BF, Ter119, Hoechst, MitoFluor, and Hoechst + MitoFluor images. (B) Representative area masks of an enucleating erythroblast developed for MitoFluor intensity measurements in nascent reticulocytes and nascent pyrenocytes. (C) Representative MitoFluor intensity histograms of enucleating erythroblasts (top), nascent reticulocytes (centre), and nascent pyrenocytes (bottom). (D) Analysis of MitoFluor intensity in JAK2V617F cells normalized by the MitoFluor intensity of JAK2WT cells. MitoFluor intensity in bone marrow nascent pyrenocytes (top left), spleen nascent pyrenocytes (top right), bone marrow nascent reticulocytes (bottom left), and spleen nascent reticulocytes (bottom right). n = 6, mean with SD, Mann–Whitney test, * p < 0.05; ** p < 0.01.
Figure 7
Figure 7
Higher ribosomal content and smaller red cell size in JAK2V617F PV and ET patients. (A) Representative flow cytometry histogram gating strategy selecting a thiazole orange-positive (reticulocyte) population in a reticulocyte-enriched population from peripheral blood of a healthy individual (CT). (B) Representative flow cytometry histogram of thiazole orange-positive populations between CT and PV JAK2V617F patient circulating reticulocytes. (C) Analysis of thiazole orange MFI in circulating reticulocytes from healthy individuals (n = 9) and non-treated PV JAK2V617F (n = 4), ET JAK2V617F (n = 10). Mean with SD, Mann–Whitney test. Representative forward scatter area (FCS-A) flow cytometry histogram of (D) mature RBCs and (E) reticulocytes from the peripheral blood of a healthy individual (CT) and a PV JAK2V617F patient. Analysis of FCS-A (cell size) in (F) mature RBCs and (G) reticulocytes from peripheral blood of CT (N = 9) and non-treated PV JAK2V617F (n = 4), ET JAK2V617F (n = 10). Mean with SD, Mann–Whitney test. (H) Projected RBC surface in PV and ET patients using imaging flow cytometry. Cells facing the camera were selected based on circularity (cutoff 12.1) and max thickness features (cutoff 8.1). JAK2V617F PV (n = 7), ET RBCs (n = 5), and CT RBCs (n = 15) mean with SD, Mann–Whitney test, * p < 0.05; ** p < 0.01; **** p < 0.0001; ns—not significant.

Similar articles

Cited by

References

    1. Nangalia J., Grinfeld J., Green A.R. Pathogenesis of Myeloproliferative Disorders. Annu. Rev. Pathol. 2016;11:101–126. doi: 10.1146/annurev-pathol-012615-044454. - DOI - PubMed
    1. Barbui T., Finazzi G., Falanga A. Myeloproliferative neoplasms and thrombosis. Blood. 2013;122:2176–2184. doi: 10.1182/blood-2013-03-460154. - DOI - PubMed
    1. Marchioli R., Finazzi G., Landolfi R., Kutti J., Gisslinger H., Patrono C., Marilus R., Villegas A., Tognoni G., Barbui T. Vascular and neoplastic risk in a large cohort of patients with polycythemia vera. J. Clin. Oncol. 2005;23:2224–2232. doi: 10.1200/JCO.2005.07.062. - DOI - PubMed
    1. Ji P. New insights into the mechanisms of mammalian erythroid chromatin condensation and enucleation. Int. Rev. Cell. Mol. Biol. 2015;316:159–182. doi: 10.1016/bs.ircmb.2015.01.006. - DOI - PubMed
    1. Brusson M., Cochet S., Leduc M., Guillonneau F., Mayeux P., Peyrard T., Chomienne C., Le Van Kim C., Cassinat B., Kiladjian J.-J., et al. Enhanced calreticulin expression in red cells of polycythemia vera patients harboring the JAK2V617F mutation. Haematologica. 2017;102:e241–e244. doi: 10.3324/haematol.2016.161604. - DOI - PMC - PubMed

Publication types

MeSH terms

LinkOut - more resources