. 2021 Dec 27;11(1):63.
doi: 10.3390/cells11010063.

Shift in G1-Checkpoint from ATM-Alone to a Cooperative ATM Plus ATR Regulation with Increasing Dose of Radiation

Affiliations

Shift in G1-Checkpoint from ATM-Alone to a Cooperative ATM Plus ATR Regulation with Increasing Dose of Radiation

Fanghua Li et al. Cells. .

Abstract

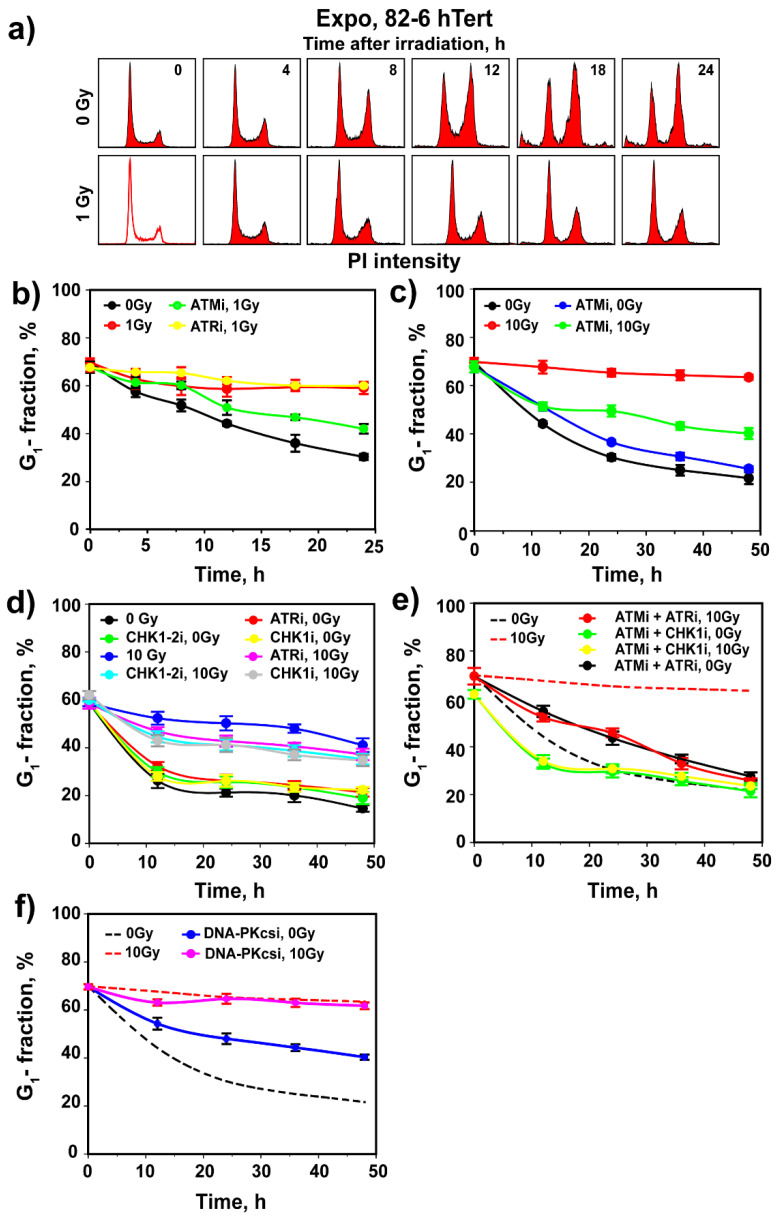
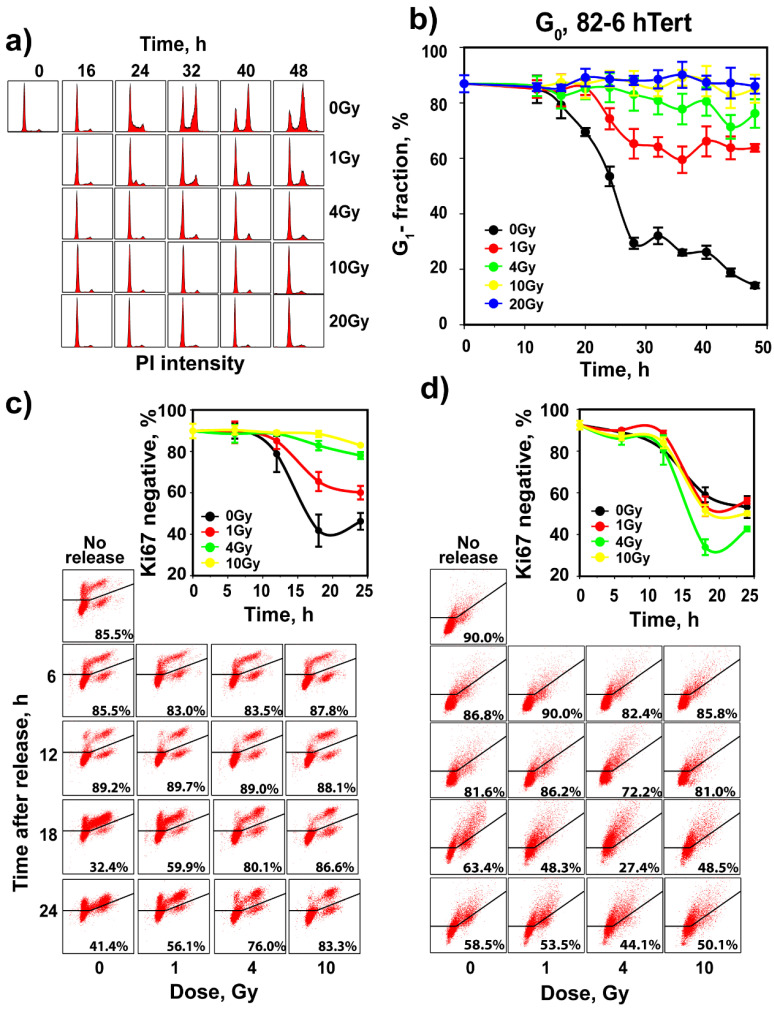
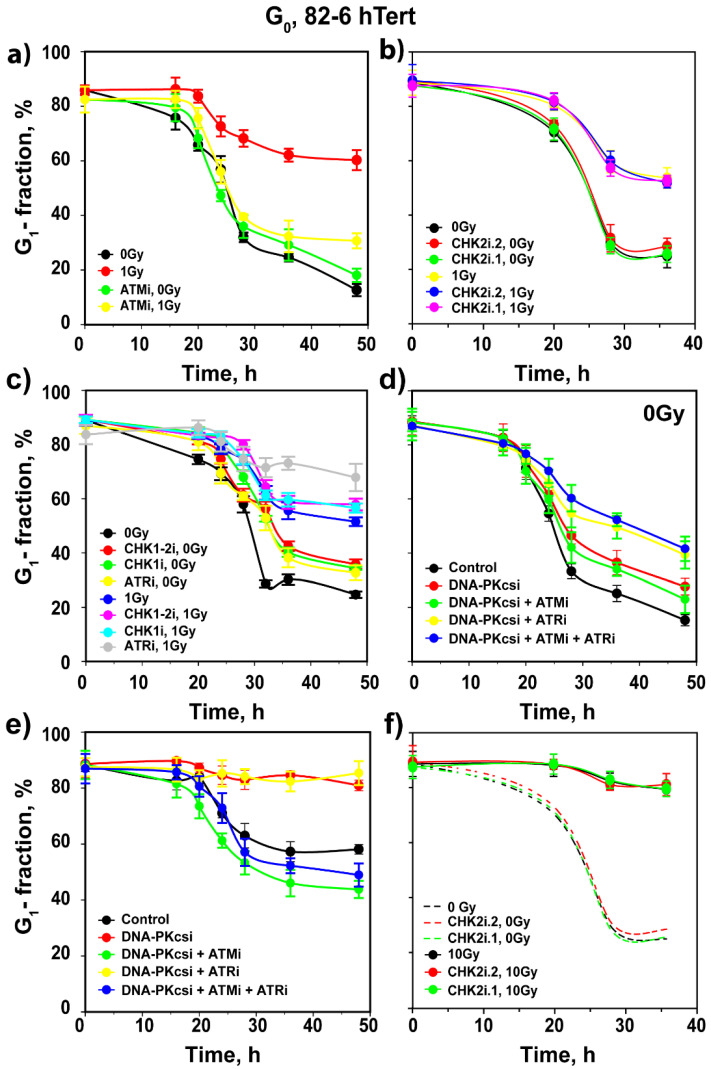
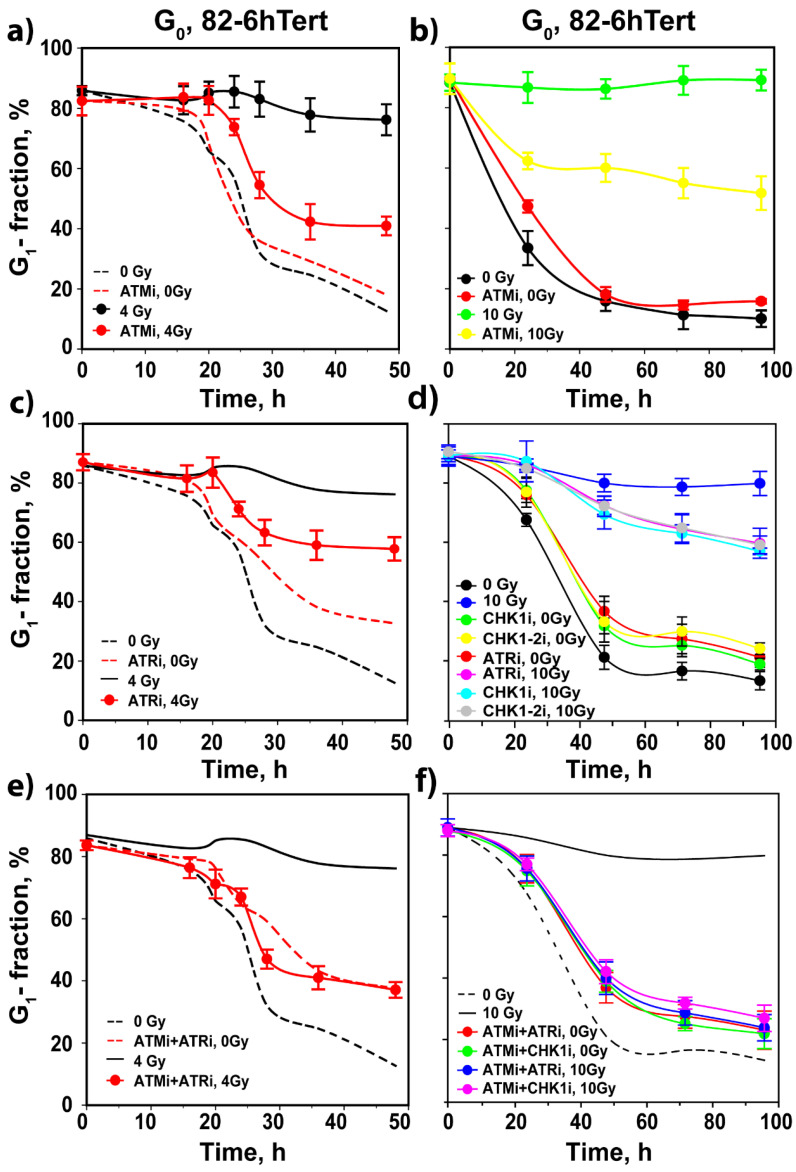
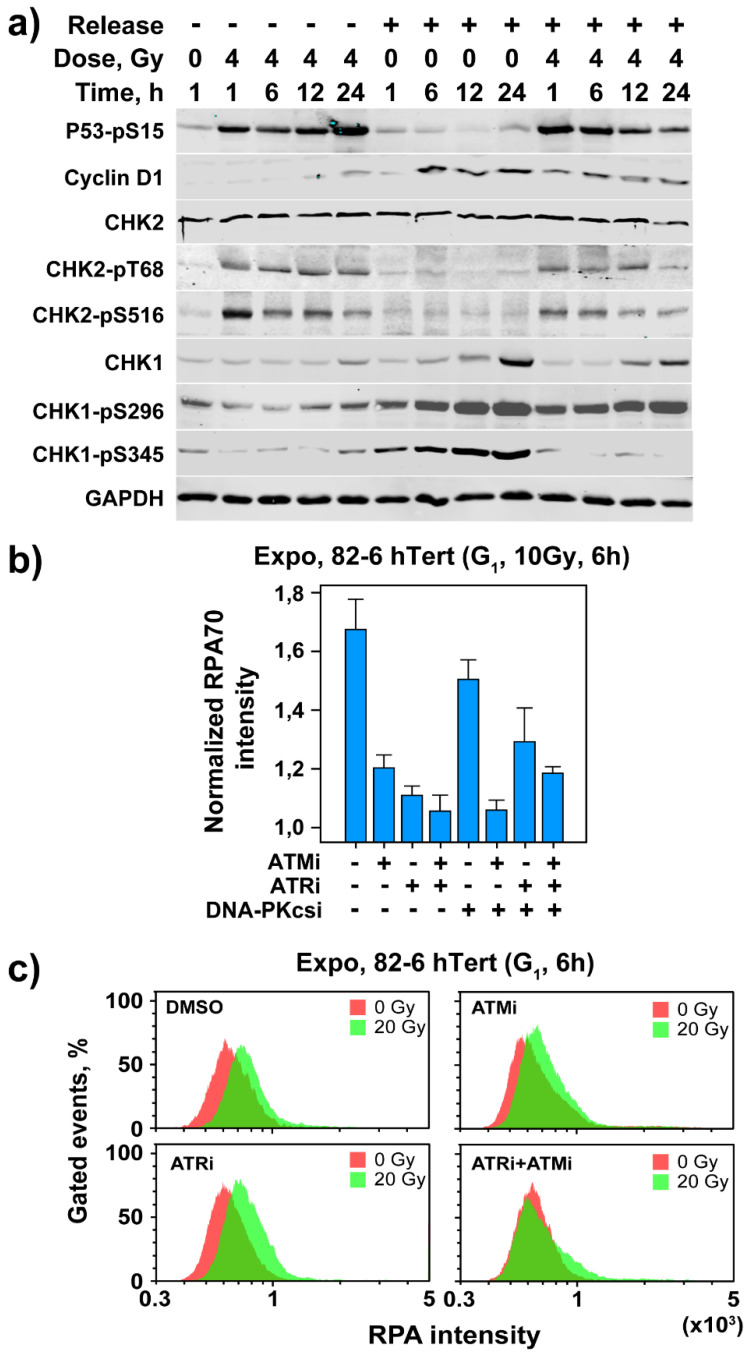
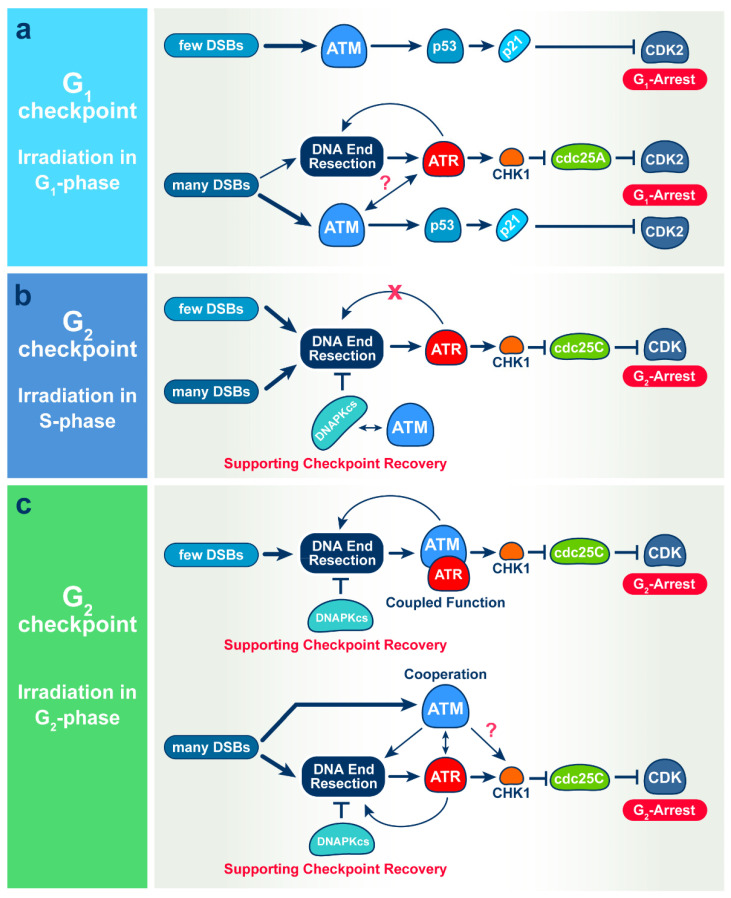
The current view of the involvement of PI3-kinases in checkpoint responses after DNA damage is that ATM is the key regulator of G1-, S- or G2-phase checkpoints, that ATR is only partly involved in the regulation of S- and G2-phase checkpoints and that DNA-PKcs is not involved in checkpoint regulation. However, further analysis of the contributions of these kinases to checkpoint responses in cells exposed to ionizing radiation (IR) recently uncovered striking integrations and interplays among ATM, ATR and DNA-PKcs that adapt not only to the phase of the cell cycle in which cells are irradiated, but also to the load of DNA double-strand breaks (DSBs), presumably to optimize their processing. Specifically, we found that low IR doses in G2-phase cells activate a G2-checkpoint that is regulated by epistatically coupled ATM and ATR. Thus, inhibition of either kinase suppresses almost fully its activation. At high IR doses, the epistatic ATM/ATR coupling relaxes, yielding to a cooperative regulation. Thus, single-kinase inhibition suppresses partly, and only combined inhibition suppresses fully G2-checkpoint activation. Interestingly, DNA-PKcs integrates with ATM/ATR in G2-checkpoint control, but functions in its recovery in a dose-independent manner. Strikingly, irradiation during S-phase activates, independently of dose, an exclusively ATR-dependent G2 checkpoint. Here, ATM couples with DNA-PKcs to regulate checkpoint recovery. In the present work, we extend these studies and investigate organization and functions of these PI3-kinases in the activation of the G1 checkpoint in cells irradiated either in the G0 or G1 phase. We report that ATM is the sole regulator of the G1 checkpoint after exposure to low IR doses. At high IR doses, ATM remains dominant, but contributions from ATR also become detectable and are associated with limited ATM/ATR-dependent end resection at DSBs. Under these conditions, only combined ATM + ATR inhibition fully abrogates checkpoint and resection. Contributions of DNA-PKcs and CHK2 to the regulation of the G1 checkpoint are not obvious in these experiments and may be masked by the endpoint employed for checkpoint analysis and perturbations in normal progression through the cell cycle of cells exposed to DNA-PKcs inhibitors. The results broaden our understanding of organization throughout the cell cycle and adaptation with increasing IR dose of the ATM/ATR/DNA-PKcs module to regulate checkpoint responses. They emphasize notable similarities and distinct differences between G1-, G2- and S-phase checkpoint regulation that may guide DSB processing decisions.

Keywords: ATM; ATR; DNA double-strand breaks; DNA end resection; DNA-PKcs; cell cycle; checkpoints; ionizing radiation.


Conflict of interest statement

The authors declare no conflict of interest.

Figures

Figure 1
Figure 1
Assessment of G1 checkpoint in irradiated G1 cells of exponentially growing 82-6 hTert cell cultures. (a) Histograms showing cell cycle distribution as a function of time after exposure to 0 or 1 Gy of X-rays. Owing to the addition of nocodazole in the growth medium just before IR exposure, cell cycle progression causes a progressive enrichment in cells with G2/M DNA content. Note that this enrichment is delayed after IR, owing to the activation of several checkpoints in the cell cycle. The reduction in the fraction of cells with G1 content as a function of time reflects the progression of G1 cells into S phase. Note that IR, as a consequence of the activation of G1 checkpoint, delays the rate of reduction in G1 fraction. Experiments are reproduced 3 times and a representative one is shown. (b) Plot of G1 fraction as a function of time obtained from flow cytometry histograms such as those shown in a. The reduction measured in non-irradiated cells (black circles) reflects the rate of progression of G1 cells into S phase; the strong reduction observed in this rate in cells exposed to 1 Gy (red circles) reflects the activation of G1 checkpoint. This checkpoint is reduced after treatment with ATMi (green circles) but remains unchanged after treatment with ATRi (yellow circles). (c) As in (b) for cells exposed to 0 or 10 Gy and treated with ATMi as indicated. (d) As in (b) for cells exposed to 0 or 10 Gy and treated with ATRi, CHK1i, and CHK1-2i as indicated. (e) As in (b) for cells exposed to 0 or 10 Gy and treated with combinations of ATMi, ATRi and CHK1i as indicated. (f) As in (b) for cells exposed to 0 or 10 Gy and treated with DNA-PKcsi as indicated. Broken lines show results from c without data points to avoid congestion. Plotted in b–f is the mean and standard error (SE) from three independent experiments. See also Table S1 for more information.
Figure 2
Figure 2
Validation of 82-6 hTert cell cultures for analysis IR-induced G1 checkpoint in cells irradiated in G0. (a) Proliferation of 82-6 hTert cells under normal growth conditions, as well as after transfer two days later to serum-free medium (serum deprivation, SD). Plotted is the mean and SE from three independent experiments. (b) Cell cycle distribution at the indicated times for cells growing as in A. Note the progressive enrichment in cells with G1/G0 content. (c) Characterization of cell cultures in A for Ki67 signal. (d) As in C for pyronin Y signal. In (bd), experiments are reproduced 3 times, and one representative is shown.
Figure 3
Figure 3
Assessment of G1 checkpoint in irradiated G0 cells of SD 82-6 hTert cell cultures. (a) Histograms showing cell cycle distribution as a function of time after exposure to different doses of X-rays. Cells are transferred to complete growth medium supplemented with nocodazole just before irradiation. Owing to the addition of nocodazole in the growth medium, cell cycle progression causes a progressive enrichment in cells with G2/M DNA content. The reduction in the fraction of cells with G0/G1 content as a function of time reflects the progression of G0 cells into the S phase. Here again, the reduction in this rate reflects the activation of G1 checkpoint. (b) As in Figure 1b for SD, 82-6 hTert cells exposed to the indicated doses of IR. (c) Analysis of Ki67 in the cell cultures analyzed in (b). (d) Analysis of pyronin Y in the cell cultures analyzed in (b). Plotted is the mean and SE from three independent experiments. See also Table S2 for more information.
Figure 4
Figure 4
Assessment of the effects of ATM, ATR and DNA-PKcs inhibitors on the activation of G1 checkpoint in irradiated G0 cells of SD 82-6 hTert cell cultures. (a) As in Figure 1b for cells exposed to 0 or 1 Gy in the presence of ATMi as indicated. (b) As in (a) for cells exposed to CHK2 inhibitors as indicated. (c) As in (a) for cells exposed to CHK1 inhibitors as indicated. (d) As in (a) for unirradiated cells treated with DNA-PKcsi in the presence or absence of ATMi and or ATRi. (e) As in (d) for cells exposed to 1 Gy of X-rays. (f) As in panel (a), for cells exposed to 0 or 10 Gy in the presence or absence of a CHK2 inhibitor as indicated. Broken lines show results from (b) without data point to avoid congestion. Plotted is the mean and SE from three independent experiments. See also Table S3 for more information.
Figure 5
Figure 5
Assessment of the effects of combined treatment with inhibitors of ATM, ATR and DNA-PKcs on the activation of the G1 checkpoint in irradiated G0 cells of SD 82-6 hTert cell cultures. (a) As in Figure 1b for cells exposed to 0 or 4 Gy in the presence or absence of ATMi as indicated. (b) As in (a) for cells exposed to 10 Gy. (c) As in (a) for cells exposed to ATRi. (d) As in (b) for cells exposed to ATRi, CHK1i, and CHK1-2i. (e) As in (a) for cells exposed to combined ATMi and ATRi. (f) As in (b) for cells exposed to the indicated combinations of ATMi, ATRi and CHK1i. Broken and solid lines without data points show results from Figure 4, Figure 5a or Figure 5d; symbols are omitted to avoid congestion. Plotted is the mean and SE from three independent experiments. See also Table S4 for more information.
Figure 6
Figure 6
Assessment of cell cycle and checkpoint proteins in irradiated and non-irradiated G0 cells of SD 82-6 hTert cell cultures with or without transfer to fresh growth medium; analysis of resection at DSBs in G1 cells of exponentially growing cultures. (a) Levels of indicated proteins as a function of time after exposure to 0 or 4 Gy (see text for details). Experiments are reproduced 3 times and a representative one is shown. (b) Analysis of DNA end resection at DSBs in G1 phase after exposure to 10 Gy in the presence or absence of ATMi, ATRi and DNA-PKcsi at the indicated combinations using QIBC as described under “Material and Methods” and RPA70 intensity as endpoint. Plotted is the mean and SE from three independent experiments. See also Table S5 for more information. (c) Analysis of DNA end resection at DSBs in G1 phase after exposure of cells to 20 Gy in the presence or absence of ATMi and/or ATRi as indicated, using flow cytometry as described under “Material and Methods” and RPA70 signal intensity as endpoint. Experiments are reproduced 3 times and a representative one is shown.
Figure 7
Figure 7
Mechanisms of IR-induced checkpoints in G1 (a), S (b) and G2 (c) phase of the cell cycles. See text for details.

Similar articles

Cited by

References

    1. Ferguson D.O., Alt F.W. DNA Double Strand Break Repair and Chromosomal Translocation: Lessons from Animal Models. Oncogene. 2001;20:5572–5579. doi: 10.1038/sj.onc.1204767. - DOI - PubMed
    1. Iliakis G., Mladenov E., Mladenova V. Necessities in the Processing of DNA Double Strand Breaks and Their Effects on Genomic Instability and Cancer. Cancers. 2019;11:1671. doi: 10.3390/cancers11111671. - DOI - PMC - PubMed
    1. Mladenov E., Magin S., Soni A., Iliakis G. DNA Double-Strand-Break Repair in Higher Eukaryotes and Its Role in Genomic Instability and Cancer: Cell Cycle and Proliferation-Dependent Regulation. Semin. Cancer Biol. 2016;37–38:51–64. doi: 10.1016/j.semcancer.2016.03.003. - DOI - PubMed
    1. Mladenov E., Magin S., Soni A., Iliakis G. DNA Double-Strand Break Repair as Determinant of Cellular Radiosensitivity to Killing and Target in Radiation Therapy. Front. Oncol. 2013;3:113. doi: 10.3389/fonc.2013.00113. - DOI - PMC - PubMed
    1. Jackson S.P., Bartek J. The DNA-Damage Response in Human Biology and Disease. Nature. 2009;461:1071–1078. doi: 10.1038/nature08467. - DOI - PMC - PubMed

Publication types

MeSH terms

Substances