. 2022 Jan 5;11(1):176.
doi: 10.3390/cells11010176.

Targeting PGM3 as a Novel Therapeutic Strategy in KRAS/LKB1 Co-Mutant Lung Cancer

Affiliations

Targeting PGM3 as a Novel Therapeutic Strategy in KRAS/LKB1 Co-Mutant Lung Cancer

Hyunmin Lee et al. Cells. .

Abstract

In non-small-cell lung cancer (NSCLC), concurrent mutations in the oncogene KRAS and tumor suppressor STK11 (also known as LKB1) confer an aggressive malignant phenotype, an unfavourability towards immunotherapy, and overall poor prognoses in patients. In a previous study, we showed that murine KRAS/LKB1 co-mutant tumors and human co-mutant cancer cells have an enhanced dependence on glutamine-fructose-6-phosphate transaminase 2 (GFPT2), a rate-limiting enzyme in the hexosamine biosynthesis pathway (HBP), which could be targeted to reduce survival of KRAS/LKB1 co-mutants. Here, we found that KRAS/LKB1 co-mutant cells also exhibit an increased dependence on N-acetylglucosamine-phosphate mutase 3 (PGM3), an enzyme downstream of GFPT2. Genetic or pharmacologic suppression of PGM3 reduced KRAS/LKB1 co-mutant tumor growth in both in vitro and in vivo settings. Our results define an additional metabolic vulnerability in KRAS/LKB1 co-mutant tumors to the HBP and provide a rationale for targeting PGM3 in this aggressive subtype of NSCLC.

Keywords: KRAS and LKB1 co-mutations; O-GlcNAcylation; cancer metabolism; glycosylation; metabolic vulnerability; non-small cell lung cancer; the hexosamine biosynthesis pathway.


Conflict of interest statement

The authors declare no conflict of interest.

Figures

Figure 1
Figure 1
GFPT2 inhibition selectively reduces glycosylation of KL co-mutant NSCLC cells. (A) Schematic of the HBP, including azaserine, the GFPT inhibitor. Metabolites are in black and enzymes are in red. Metabolites in the glycosylation pathway are shaded in lilac and those in O-GlcNAcylation are shaded in light blue. F6P, fructose-6-phosphate; Gln, glutamine. (B) GFPT2 and LKB1 expression levels were measured in H2122 (left) and H460 (right) KL co-mutant cells depleted of GFPT2 using endoribonuclease-prepared siRNA (esiGFPT2). Actin was used as the loading control. (C) Schematic for cell-surface Sambucus nigra (SNA), Lycopersicon esculentum (LEA), phytohemagglutinin-L (L-PHA) lectins, and corresponding glycan structures, where each lectin interacts. Symbol nomenclature for glycans is shown. (D) Cell surface L-PHA lectin binding was measured by flow cytometry in empty vector (EV)- and LKB1-expressing H460 (left) and H2122 (right) KL co-mutant cells depleted of GFPT2 by esiGFPT2. (E) Cell surface L-PHA lectin binding was measured by flow cytometry in EV- and LKB1-expressing H460 (left) and H2122 (right) KL co-mutant cells treated with azaserine (1 µM, three days). (F) Cell-surface L-PHA lectin binding was measured by flow cytometry in shGFP- (control) and shLKB1-expressing H1373 K mutant cells treated with azaserine (1 µM, three days). Mean fluorescence intensity (MFI). (DF) Statistical significance was assessed using two-tailed Student’s t-test/each isogenic pair. n.s., not significant; * p < 0.05; ** p < 0.01; *** p < 0.001; **** p < 0.0001. FACS analyses were performed twice, and western blots were repeated three or more times.
Figure 2
Figure 2
PGM3 inhibition also selectively reduces glycosylation of KL co-mutant NSCLC cells. (A) Schematic of the HBP. Metabolites are in black and enzymes are in red. Metabolites in the glycosylation pathway are shaded in lilac, and those in O-GlcNAcylation are shaded in light blue. (B) PGM3 and LKB1 expression levels were measured in EV- and LKB1-expressing H2122 (left) and H460 (middle) KL co-mutant cells and in shGFP- and shLKB1-expressing H1373 (right) K mutant cells, depleted of PGM3 using esiRNA targeting PGM3. Vinculin was used as the loading control. (C) Abundance of hexosamine metabolites in an isogenic pair of H460 KL co-mutant cells depleted of PGM3 by esiPGM3. Area under curve (AUC). (D) Wheat germ agglutinin (WGA) coupled with agarose was used to precipitate glycosylated proteins from EV- and LKB1-expressing H460 (left) KL co-mutant cells depleted of PGM3 by esiPGM3. Precipitated proteins were subsequently separated by SDS-PAGE then imaged. Band intensity was quantified with Photoshop, and relative band intensity was obtained by calculating a ratio between each WGA pulldown and input control. Total protein extract before the addition of WGA was used as input control. (E,F) Cell-surface SNA (E) and L-PHA (F) lectin binding was measured by flow cytometry in EV- and LKB1-expressing H2122 (left) and H460 (middle) and in shGFP- and shLKB1-expressing H1373 (right) cells depleted of PGM3 by esiPGM3. Mean fluorescence intensity (MFI). (C,E,F) Statistical significance was assessed using two-tailed Student’s t-test/each isogenic pair. n.s., not significant; * p < 0.05; ** p < 0.01; *** p < 0.001; **** p < 0.0001. FACS analyses were performed three times. Targeted metabolomics and WGA pulldown assays were performed once.
Figure 3
Figure 3
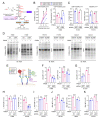
KL co-mutant NSCLC cells require PGM3 for survival. (A) Schematic of the HBP. Metabolites are in black and enzymes are in red. Metabolites in the glycosylation pathway are shaded in lilac and those in O-GlcNAcylation are shaded in light blue. (B,C) Sensitivity to PGM3 silencing in K mutant and KL co-mutant cells. Two isogenic pairs of KL co-mutant cells (B) and one isogenic pair of K mutant cells (C) were used. (DG) Effect of PGM3 silencing on cell death in NSCLC cells. (D,E) Representative dot plots of Annexin V/PI-stained cells with or without PGM3 silencing. (F,G) Quantified data from triplicates/cell line tested in (D,E,H); Left: abundance of PGM3 in parental and PGM3 knockout cells. Three KL co-mutant cells were used. Right: Effect of PGM3 knockout on anchorage-independent growth of KL co-mutant cells. Representative images of colony formation assay (n = 3). (I) Quantified data from (H). (B,C) Statistical significance was assessed using two-tailed Student’s t-test/each isogenic pair. **** p < 0.0001. (F,G) Statistical significance was assessed using one-way ANOVA with Tukey’s multiple comparisons test. # p < 0.0001, compared to EV, with control siRNA transfection (F) or shGFP with control siRNA transfection (G). $ p < 0.0001, compared to LKB1 with control siRNA transfection (F) or shLKB1 with control siRNA transfection (G). * p < 0.0001, compared to LKB1, with PGM3 siRNA transfection (F) or shLKB1 with PGM3 siRNA transfection (G). (I) Statistical significance was assessed using two-tailed Student’s t-test/each pair of cell line. * p < 0.05; ** p < 0.01. Western blots, FACS analyses, and soft agar assay were all performed twice.
Figure 4
Figure 4
PGM3 inhibitor FR054 reduces the HBP flow in both KL and K cells but selectively suppresses glyco-functionalization pathways in KL co-mutant NSCLC cells. (A) Schematic of the HBP, including FR054, the inhibitor of PGM3. [γ-15N]glutamine is depicted. (B) Left: time course of 15N labelling in UDP-HexNAc in EV- and LKB1-expressing H460 cells cultured with [γ-15N]glutamine, treated with either DMSO (a vehicle control) or FR054 (50 µM, 3 days). Right: an abundance of UDP-HexNAc from labeling assay was measured by summing mass isotopologues, followed by protein normalization. (C) Left: 15N labeling in UDP-HexNAc was measured in an isogenic pair of H1373 cells treated with either DMSO or FR054 (100 µM, 3 days). Right: 15N labeling in ManNAc was measured in an isogenic pair of H1373 cells treated with either DMSO or FR054 (100 µM, 3 days). Cells were cultured with [γ-15N] glutamine for 6 h. (D) Effect of FR054 treatment on protein O-GlcNAcylation. One KL isogenic pair and two K isogenic pairs were used. WGA pulldown was performed (left/each cell line), and total protein extract before the addition of WGA was used as the input control (right/each cell line). Band intensity was quantified with Photoshop, and relative band intensity was obtained by calculating a ratio between each WGA pulldown band and input control. (E) Schematic for lectins and glycan structures. (F,G) Cell-surface LEA lectin binding was measured by flow cytometry in three isogenic pair cell lines with or without FR054 treatment for 3 days. (H,I) Cell-surface L-PHA lectin binding was measured by flow cytometry in three isogenic pair cell lines with or without FR054 treatment for 3 days. (J,K) Cell-surface SNA lectin binding was measured by flow cytometry in three isogenic pair cell lines with or without FR054 treatment for 3 days. (B) (left panel) Statistical significance was assessed using two-way ANOVA, followed by Tukey’s multiple comparisons test. * p < 0.05 compared to EV-FR054; # p < 0.05 compared to LKB1-DMSO; $ p < 0.05 compared to LKB1-FR054. (B) (right panel) Statistical significance was assessed using two-tailed Student’s t-test/each isogenic pair. ** p < 0.01. (C,FK) Statistical significance was assessed using two-tailed Student’s t-test/each isogenic pair. n.s., not significant; * p < 0.05; ** p < 0.01; *** p < 0.001; **** p < 0.0001. Targeted metabolomics and isotope tracing experiments were performed once. FACS analyses were performed twice.
Figure 5
Figure 5
FR054 inhibits viability and clonogenicity of KL co-mutant NSCLC cells. (AC) Sensitivity to PGM3 silencing in K mutant and KL co-mutant cells. Two isogenic pairs of KL co-mutant cells (A), two isogenic pairs of K mutant cells (B), and murine NSCLC cells with either KRAS/LKB1 co-mutations (KL) or KRAS/TP53 co-mutations (KP) (C) were used. (D,E) Effect of FR054 treatment on cell death in K mutant cells and KL co-mutant cells. Three isogenic pairs were treated with either DMSO or FR054 (H460, 50 µM; H2122, 100 µM; H1373, 100 µM) for 3 days. Representative dot plots of FACS results/cell lines are shown. (F,G) Quantified FACS data from (D,E). (H) Effect of PGM3 knockout on anchorage-independent growth of K mutant cells and KL co-mutant cells (n = 3). FR054 concentration: H460, 50 µM; H2122, 100 µM; H1373, 100 µM. (FH) Statistical significance was assessed using one-way ANOVA, followed by Tukey’s multiple comparisons test. n.s., not significant; ** p < 0.01; *** p < 0.001; **** p < 0.0001. Cell viability assays (n = 6), FACS analysis, and soft agar assays were performed twice.
Figure 6
Figure 6
PGM3 inhibition reduces KL co-mutant NSCLC tumor growth in vivo. (A) Schematic diagram of the experimental procedure. shGFP-expressing H1373 cells (1 × 10⁶cells) were injected into the left flank of the mouse, and shLKB1-expressing H1373 cells (1 × 10⁶ cells) were injected into the right flank of the mouse. (B) Growth of shGFP- and shLKB1-expressing H1373 xenografts in the presence and absence of FR054 (500 mg/kg/dose, twice a day, 14 days total). Mean tumor volume and s.d. are shown for each group (n = 4). (C) Mouse weight with either vehicle control or FR054 at the day of euthanasia. (D) Representative Ki67 staining images of vehicle-treated and FR054-treated mice (n = 3/condition). Scale bar, 500 µm. (E) Ki67+ cells and total cells/tumor were quantified using Matlab. (F) Representative TUNEL staining of tumor tissues. 4′,6-diamidino-2-phenylindole (DAPI) was used to stain DNA. Scale bars, 100 μm. (G) TUNEL+ cells and total cells/tumor were quantified using Matlab. (H) Working model. Metabolic alterations mediated by concurrent mutations of KRAS and LKB1 created PGM3 dependence. (I) Kaplan-Meier plot associating PGM3 mRNA expression with NSCLC (LUAD, lung adenocarcinoma (left) and LUSC, lung squamous carcinoma (right)) patient survival. Dataset is from Lung Cancer Explore, generated by UTSW (https://lce.biohpc.swmed.edu/lungcancer/, accessed on 21 November 2021). (J) Kaplan-Meier plot associating PGM3 mRNA expression with bladder cancer (BLCA) and breast cancer (BRCA) patient survival. Dataset is from OncoLnc (http://www.oncolnc.org/, accessed on 21 November 2021). (B) Statistical significance was assessed using a two-way ANOVA with Tukey’s multiple comparisons test. * p < 0.05 compared to DMSO. (C) Statistical significance was assessed using paired Student’s t-test. n.s., not significant. (E,G) Statistical significance was assessed using one-way ANOVA with Tukey’s multiple comparisons test. * p < 0.05, compared to shGFP with vehicle treatment, # p < 0.05, compared to shGFP with FR054 treatment, $ p < 0.05, compared to shLKB1 with vehicle treatment. Tumor growth experiment was performed once.

Similar articles

Cited by

References

    1. Sung H., Ferlay J., Siegel R.L., Laversanne M., Soerjomataram I., Jemal A., Bray F. Global cancer statistics 2020: GLOBOCAN estimates of incidence and mortality worldwide for 36 cancers in 185 countries. CA: A Cancer J. Clin. 2021;71:209–249. doi: 10.3322/caac.21660. - DOI - PubMed
    1. Herbst R.S., Heymach J.V., Lippman S.M. Lung cancer. N. Engl. J. Med. 2008;359:1367–1380. doi: 10.1056/NEJMra0802714. - DOI - PMC - PubMed
    1. Travis W.D. Pathology of lung cancer. Clin. Chest Med. 2002;23:65–81. doi: 10.1016/S0272-5231(03)00061-3. - DOI - PubMed
    1. Canon J., Rex K., Saiki A.Y., Mohr C., Cooke K., Bagal D., Gaida K., Holt T., Knutson C.G., Koppada N., et al. The clinical KRAS(G12C) inhibitor AMG 510 drives anti-tumour immunity. Nature. 2019;575:217–223. doi: 10.1038/s41586-019-1694-1. - DOI - PubMed
    1. Ding L., Getz G., Wheeler D.A., Mardis E.R., McLellan M.D., Cibulskis K., Sougnez C., Greulich H., Muzny D.M., Morgan M.B., et al. Somatic mutations affect key pathways in lung adenocarcinoma. Nature. 2008;455:1069–1075. doi: 10.1038/nature07423. - DOI - PMC - PubMed

Publication types

MeSH terms

Substances