Review
. 2021 Dec 29;11(1):166.
doi: 10.3390/jcm11010166.

Gouty Arthropathy: Review of Clinical Manifestations and Treatment, with Emphasis on Imaging

Affiliations
Review

Gouty Arthropathy: Review of Clinical Manifestations and Treatment, with Emphasis on Imaging

Jennifer S Weaver et al. J Clin Med. .

Abstract

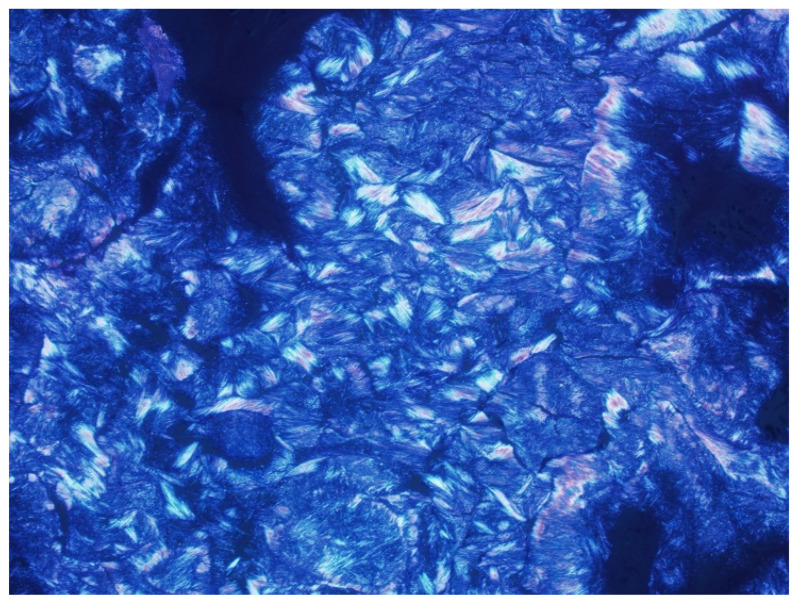
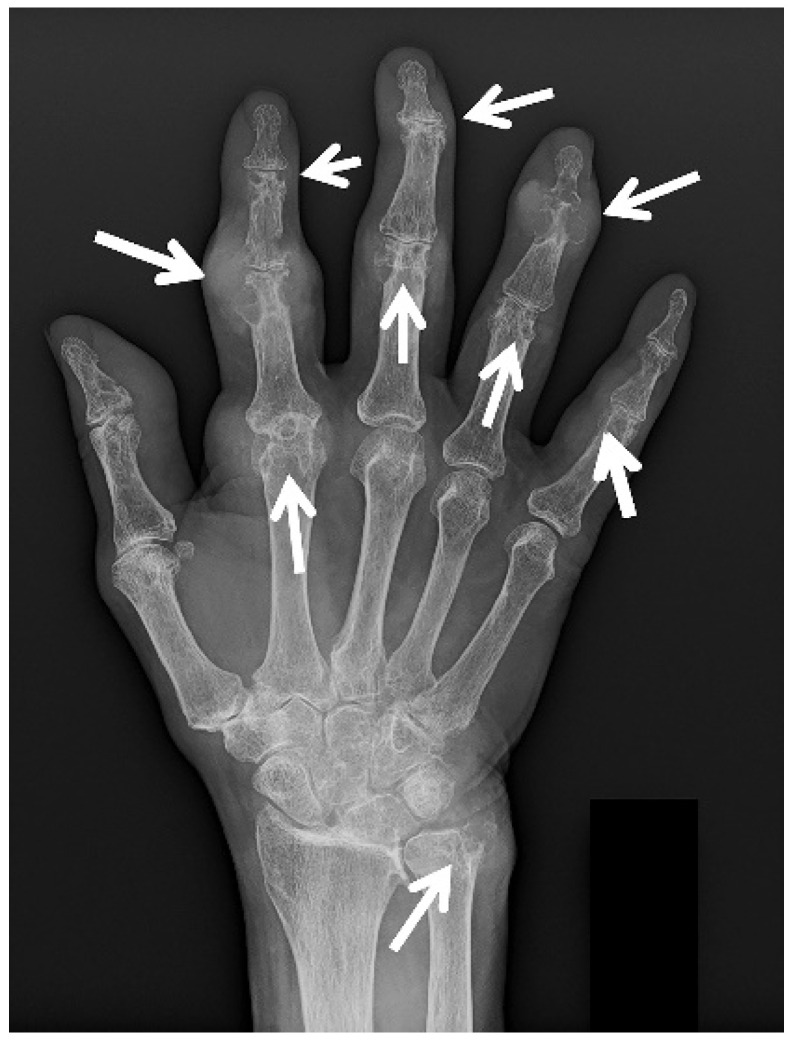
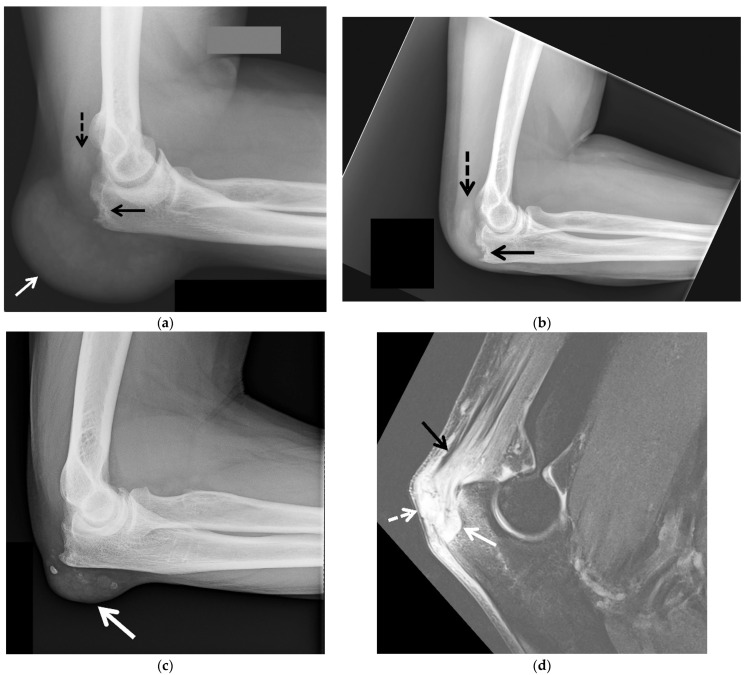
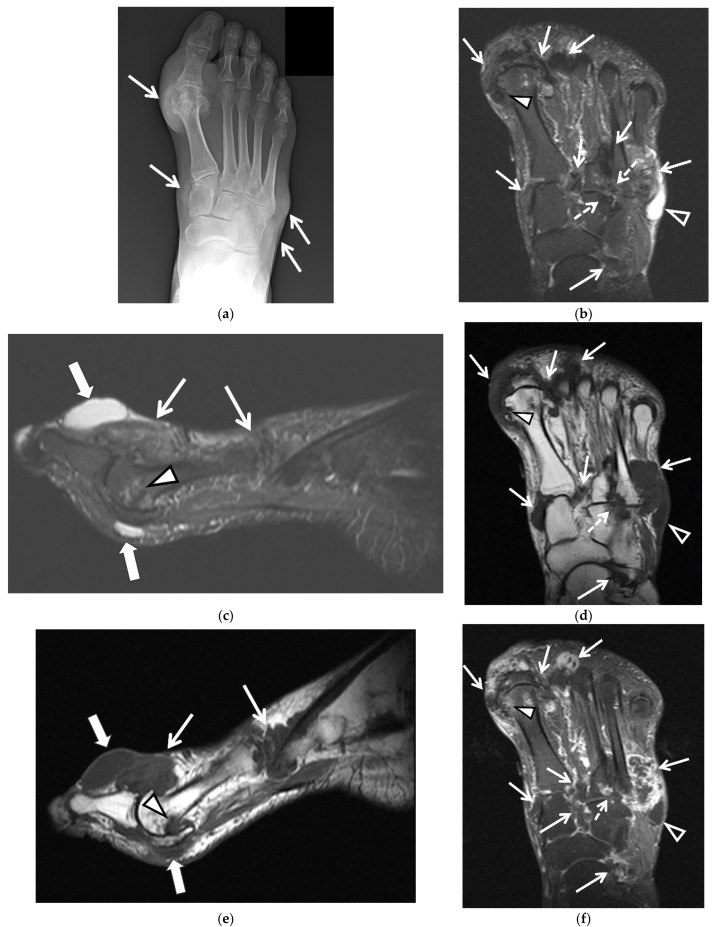
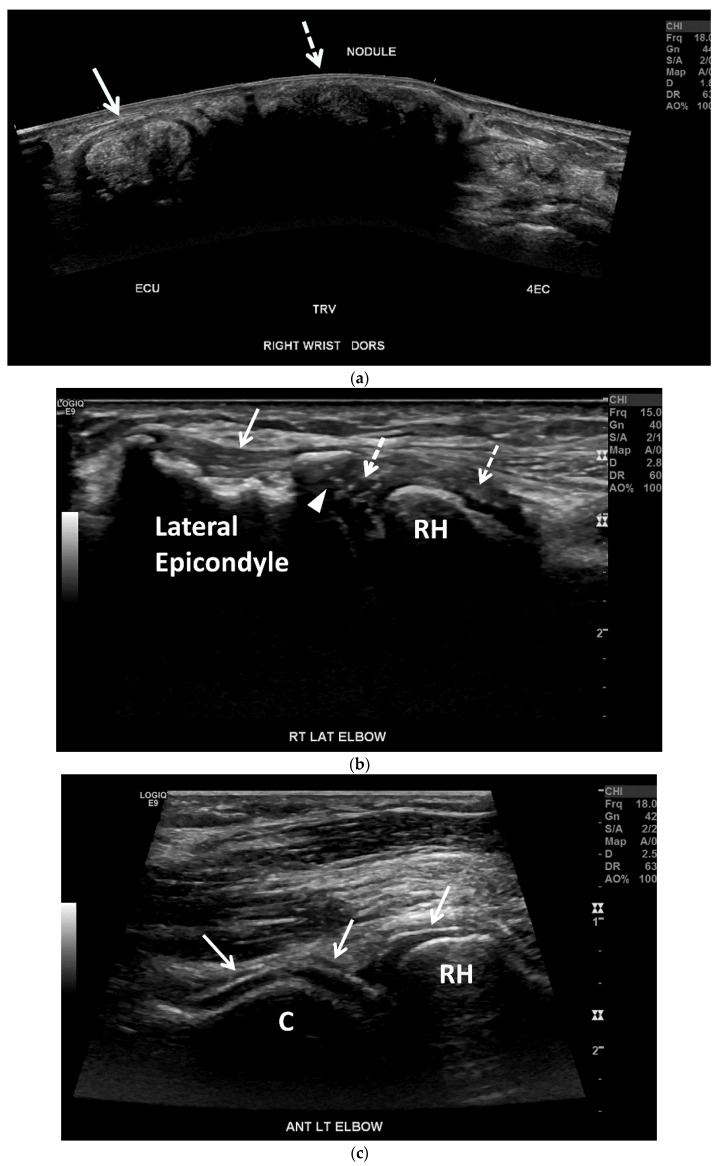
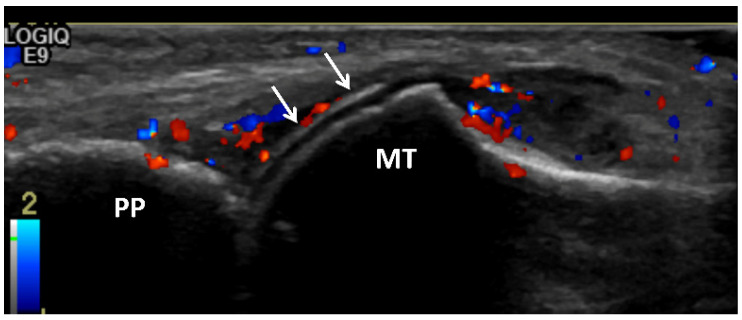
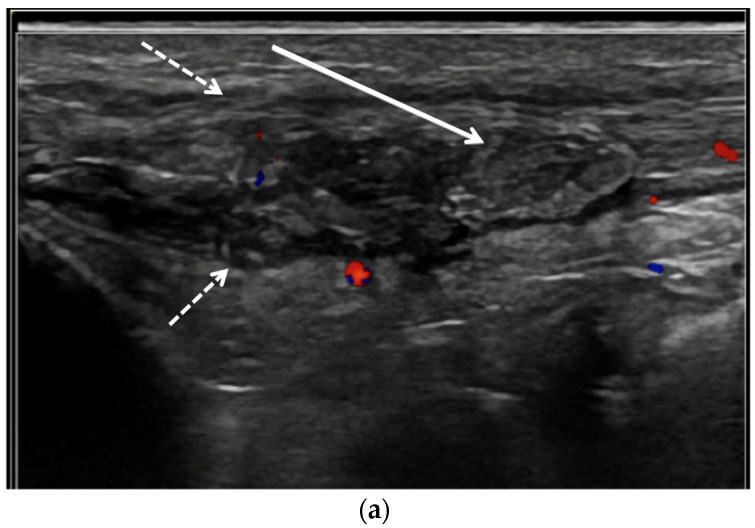
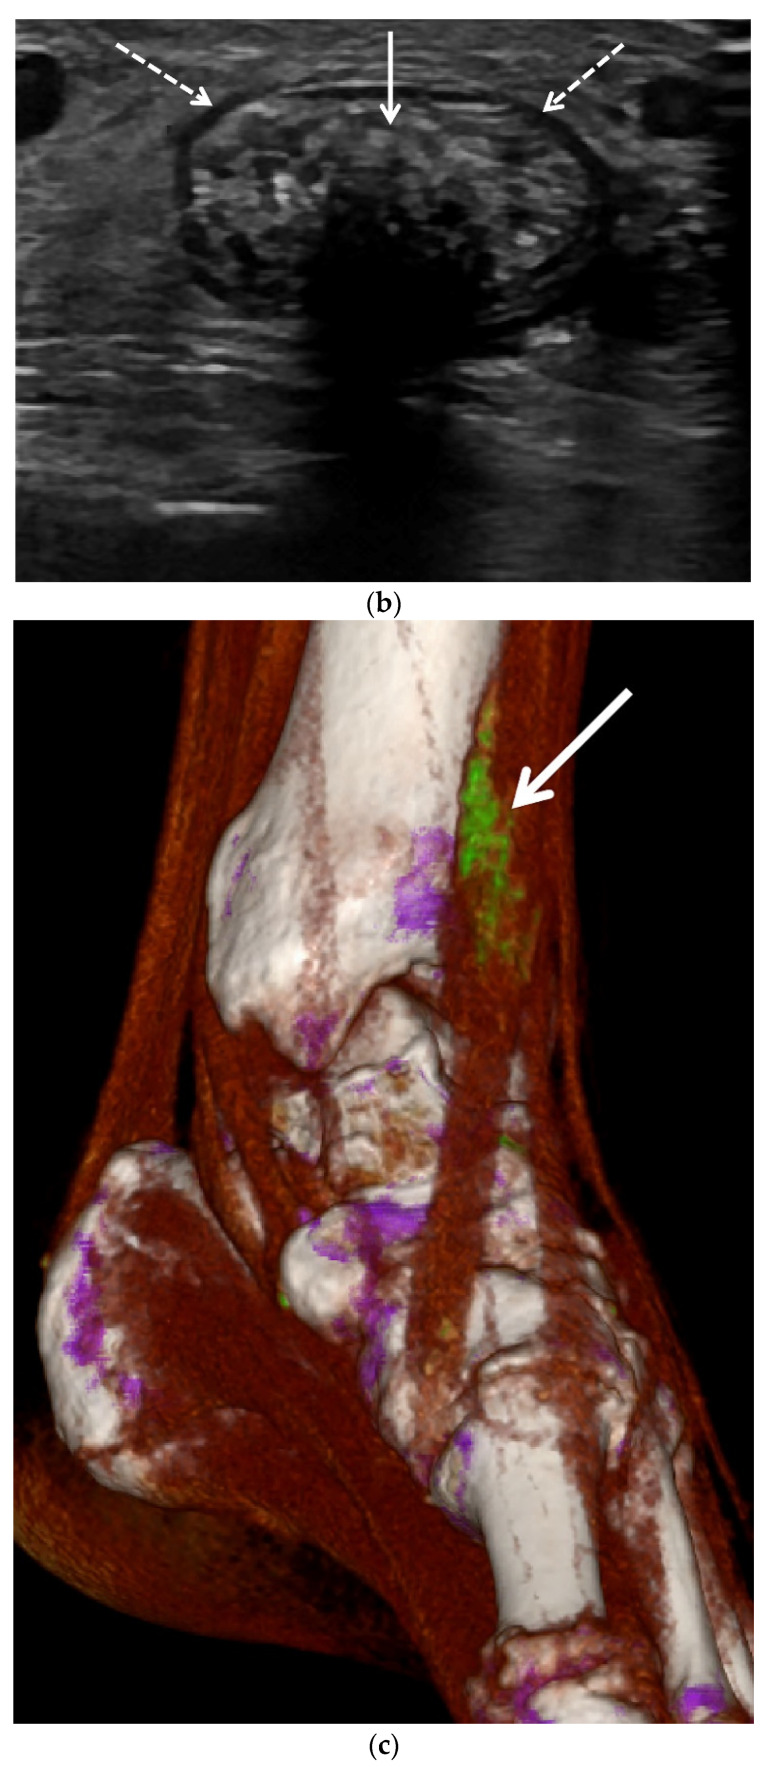
Gout, a crystalline arthropathy caused by the deposition of monosodium urate crystals in the articular and periarticular soft tissues, is a frequent cause of painful arthropathy. Imaging has an important role in the initial evaluation as well as the treatment and follow up of gouty arthropathy. The imaging findings of gouty arthropathy on radiography, ultrasonography, computed tomography, dual energy computed tomography, and magnetic resonance imaging are described to include findings of the early, acute and chronic phases of gout. These findings include early monosodium urate deposits, osseous erosions, and tophi, which may involve periarticular tissues, tendons, and bursae. Treatment of gout includes non-steroidal anti-inflammatories, colchicine, glucocorticoids, interleukin-1 inhibitors, xanthine oxidase inhibitors, uricosuric drugs, and recombinant uricase. Imaging is critical in monitoring response to therapy; clinical management can be modulated based on imaging findings. This review article describes the current standard of care in imaging and treatment of gouty arthropathy.

Keywords: CT; crystalline arthropathy; dual energy CT; gout; imaging; magnetic resonance imaging; monosodium urate crystals; radiography; sonography; treatment.


Conflict of interest statement

The authors declare no conflict of interest.

Figures

Figure 1
Figure 1
Image from polarizing microscopy 100× shows phagocytosed needle-shaped monosodium urate (MSU) crystals with strong negative birefringence. Image courtesy of Nadja Falk MD; Albuquerque, NM, USA.
Figure 2
Figure 2
A 74-year-old man with gouty arthropathy involving bilateral hands. PA radiograph of the right hand shows erosive and cyst-like changes about multiple joints of the hand and ulnar styloid with adjacent dense soft-tissue nodules (arrows) consistent with gouty arthropathy. Several erosions have overhanging edges, most notable at the radial aspect of the index finger proximal interphalangeal joint. Note faint calcifications within the nodular thickening adjacent to the ulnar styloid erosion.
Figure 3
Figure 3
Tophaceous gout of the posterior elbow in 3 different patients. (a) Initial lateral radiograph of the left elbow in a 57-year-old man shows cortical erosion of the posterior olecranon (black arrow) with marked distension and somewhat increased density of the overlying olecranon bursa (white arrow). Note increased density of the distal triceps tendon (dashed black arrow). (b) Lateral radiograph of the left elbow of the same patient obtained after surgical debridement redemonstrated cortical erosion at the posterior olecranon (black arrow) and increased density of the distal triceps tendon (dashed black arrow) with interval marked improvement of posterior soft-tissue thickening. (c) Lateral radiograph of the right elbow in a 62-year-old man shows a soft-tissue mass involving the olecranon bursa with associated calcifications (arrow). (d) Sagittal T2-weighted with fat saturation MR image in a 60-year-old man shows a large bone erosion involving the posterior olecranon (white arrow) with associated mild bone marrow edema subjacent to a markedly thickened and irregular distal triceps tendon of heterogeneous increased signal intensity (black arrow). Note mildly distended irregular shaped, heterogeneous, predominantly high-signal-intensity olecranon bursa extending into the distal triceps tendon (white arrow) and additional high-signal-intensity subcutaneous edema at the posterior aspect of the elbow.
Figure 4
Figure 4
60-year-old man with tophaceous gout of the right foot. (a) AP radiograph of the right foot shows dense nodular soft-tissue thickening at the medial aspect of the first metatarsophalangeal and first tarsometatarsal joints and at the lateral aspect of the fifth tarsometatarsal joint (arrows). (b) Axial and (c) sagittal STIR and (d) axial and (e) sagittal T1-weighted MR images show multiple areas of intermediate-to-low signal intensity in the periarticular regions of the forefoot and midfoot related to MSU deposits and tophaceous gout (white arrows), cortical erosion at the medial aspect of the first metatarsal head (white arrowheads) and cortical erosions between the third and fourth tarsometatarsal joints (dashed white arrows) which show heterogeneous enhancement on the (f) axial and (g) sagittal T1-weighted with fat saturation post-contrast MR images. In (b) note high-signal-intensity lobulated adventitial bursal collection at the lateral aspect of the proximal fifth metatarsal bone (open white arrowheads) which shows intermediate-to-low signal in (d) and rim enhancement in (f). Additional adventitial bursae (white block arrows) are seen at the dorsal and plantar aspect of the first metatarsophalangeal joint, which show high signal in (c), intermediate-to-low signal in (e) and rim enhancement in (g).
Figure 4
Figure 4
60-year-old man with tophaceous gout of the right foot. (a) AP radiograph of the right foot shows dense nodular soft-tissue thickening at the medial aspect of the first metatarsophalangeal and first tarsometatarsal joints and at the lateral aspect of the fifth tarsometatarsal joint (arrows). (b) Axial and (c) sagittal STIR and (d) axial and (e) sagittal T1-weighted MR images show multiple areas of intermediate-to-low signal intensity in the periarticular regions of the forefoot and midfoot related to MSU deposits and tophaceous gout (white arrows), cortical erosion at the medial aspect of the first metatarsal head (white arrowheads) and cortical erosions between the third and fourth tarsometatarsal joints (dashed white arrows) which show heterogeneous enhancement on the (f) axial and (g) sagittal T1-weighted with fat saturation post-contrast MR images. In (b) note high-signal-intensity lobulated adventitial bursal collection at the lateral aspect of the proximal fifth metatarsal bone (open white arrowheads) which shows intermediate-to-low signal in (d) and rim enhancement in (f). Additional adventitial bursae (white block arrows) are seen at the dorsal and plantar aspect of the first metatarsophalangeal joint, which show high signal in (c), intermediate-to-low signal in (e) and rim enhancement in (g).
Figure 5
Figure 5
A 60-year-old man with gouty arthropathy of the right first metatarsophalangeal joint, also known as podagra. (a) Oblique radiograph and (b) axial CT image of the right foot shows erosive bone changes at the medial aspect of the great toe metatarsal head and proximal phalangeal base with overlying mass-like dense soft-tissue nodularity with faint calcifications consistent with MSU crystal deposition (arrows). Similar less pronounced findings are seen at the lateral aspect of the first metatarsophalangeal joint.
Figure 6
Figure 6
A 54-year-old man with tophaceous gout of the right knee. (a) Patellofemoral radiograph shows a well-marginated osseous erosion at the anterior aspect of the patella (arrow) with overlying soft-tissue edema (dashed arrow). Sagittal (b) proton density-weighted with fat saturation and (c) T1-weighted MR images show osseous erosion with soft-tissue deposit at the anterior surface of the patella (arrows) subjacent to the thickened heterogeneous quadriceps continuation in continuity with the heterogeneous thickened patellar tendon (dashed arrows). The affected extensor mechanism and the soft-tissue deposit at the anterior patellar osseous erosion site show heterogeneous increased signal in (b) and heterogeneous decreased signal in (c) consistent with MSU crystal deposition.
Figure 7
Figure 7
Gouty arthropathy in a 66-year-old woman. (a) Long-axis power Doppler US image along the dorsal aspect of the third metacarpophalangeal joint shows a moderate distension of the joint capsule (arrows) with numerous small echogenic foci related to MSU crystals (dashed arrows), creating “snowstorm” appearance. Note associated mild-to-moderate hyperemia (red). MC = metacarpal head. PP = proximal phalanx. (b) Obliquely oriented power Doppler US image along the posterior aspect of the right olecranon shows a heterogenous moderately distended olecranon bursa (arrows) with numerous small echogenic foci related to MSU crystals (dashed arrows). Note associated mild hyperemia (red). The distal triceps tendon (TT) is hypoechoic with scattered tiny hyperechoic foci consistent with tendinopathy and MSU crystal deposition.
Figure 8
Figure 8
Tophaceous gout in a 73-year-old woman. (a) Panoramic transverse/short-axis gray-scale US image along the dorsal aspect of the right wrist shows markedly thickening and heterogeneous hyperechoic extensor carpi ulnaris tendon (ECU) related to tendinopathy with associated MSU crystal deposition (arrow). Note a large echogenic mass with posterior acoustic shadowing between the ECU and the fourth extensor compartment (4EC) related to a hard tophus (dashed arrow). (b) Long-axis gray-scale US image along the lateral aspect of the right elbow shows multiple small intra-articular echogenic foci related to MSU crystals (dashed arrows), undersurface erosion at the periphery of the capitellum (arrowhead) and cortical irregularity of the lateral humeral epicondyle subjacent to the heterogeneous common extensor tendon suggestive of chronic tendinopathy (arrow). C = capitellum. RH = radial head. (c) Long-axis gray-scale US image along the anterolateral aspect of the right elbow shows “double contour sign” along the radial head and capitellum articular cartilage related to MSU crystal deposition (arrows).
Figure 9
Figure 9
Gouty arthritis of the 1st metatarsophalangeal joint of 45-year-old male. Long-axis color Doppler US image along the dorsal aspect of the first metatarsophalangeal joint shows moderate distension of the joint capsule with moderate hyperemia consistent with synovitis. Note hyperechoic line that parallels the hyperechoic line of the subchondral bone, separated by anechoic cartilage along the metacarpal head (arrow) producing a “double contour” sign related to MSU crystal deposition. MT = metatarsal head. PP = proximal phalanx.
Figure 10
Figure 10
Gout of the tibialis anterior tendon. (a) Long-axis color Doppler US image along the dorsal aspect of the ankle and (b) short-axis gray scale US image of the tibialis anterior tendon in the same region show marked thickening and heterogeneous echogenicity of the tibialis anterior tendon consistent with severe tendinopathy and MSU crystal deposition (dashed arrows) with a more discrete echogenic focus of tophaceous gout (arrows) with posterior shadowing in (b). (c) A 3D reformatted dual energy CT (DECT) image of the ankle shows green encoded foci in the tibialis anterior tendon-related MSU crystal deposition concordant with US findings. DECT image acquired at 0.8–1.5 mm on a dual energy Siemens Somatom Force helical CT scanner using Syngovia post-processing software to demonstrate MSU crystals encoded in green.
Figure 10
Figure 10
Gout of the tibialis anterior tendon. (a) Long-axis color Doppler US image along the dorsal aspect of the ankle and (b) short-axis gray scale US image of the tibialis anterior tendon in the same region show marked thickening and heterogeneous echogenicity of the tibialis anterior tendon consistent with severe tendinopathy and MSU crystal deposition (dashed arrows) with a more discrete echogenic focus of tophaceous gout (arrows) with posterior shadowing in (b). (c) A 3D reformatted dual energy CT (DECT) image of the ankle shows green encoded foci in the tibialis anterior tendon-related MSU crystal deposition concordant with US findings. DECT image acquired at 0.8–1.5 mm on a dual energy Siemens Somatom Force helical CT scanner using Syngovia post-processing software to demonstrate MSU crystals encoded in green.
Figure 11
Figure 11
Tophaceous gout at the right second metatarsophalangeal joint in a 49-year-old man. (a) Long-axis gray-scale US image along the dorsal aspect of the second right metatarsophalangeal joint shows heterogeneous intra-articular gouty tophus (arrow) abutting the metatarsal head (MT). PP = proximal phalanx. (b) Color elastogram of the same region shows low shear-wave velocity (arrow) (mean, 3.54 m/s) consistent with a soft gouty tophus. SWE data were collected using an Acuson S3000 US scanner with an L9–4-MHz linear transducer.
Figure 12
Figure 12
A 58-year-old female with extensive gouty arthropathy of the bilateral ankles and feet and decreased burden of MSU crystal deposition on the post-treatment 13-month follow-up DECT study. Pre-treatment (a,b) 3D reformatted DECT images of the bilateral ankles and feet show multiple green encoded foci of periarticular and articular MSU crystal deposition in both feet and distal Achilles tendons (arrows). Note green encoded foci about the great and little toenails related to imaging artifact (dashed arrows). (c,d) Three-dimensional reformatted DECT images of the bilateral ankles and feet obtained 13 months after initiation of treatment show interval decreased burden of periarticular and articular MSU crystal deposition in the same regions (arrows). Note green encoded foci about the great toenails related to imaging artifact (dashed arrows). All images acquired at 0.8–1.5 mm on a dual energy Siemens Somatom Force helical CT scanner using Syngovia post-processing software to demonstrate MSU crystals encoded in green.
Figure 13
Figure 13
A 67-year-old male with extensive gouty arthropathy of both knees with decreased burden of MSU crystal deposition on the post-treatment 2-year follow-up DECT study. Pre-treatment (a) 3D and (b) 2D axial reformatted DECT images of the bilateral knees show multiple green encoded foci of extensive periarticular and articular MSU crystal deposition (arrows); (c) 3D and (d) 2D axial reformatted DECT images of the bilateral knees obtained 2 years after initiation of treatment show interval decreased burden of periarticular and articular MSU crystal deposition of both knees (arrows). All images acquired at 0.8–1.5 mm on a dual energy Siemens Somatom Force helical CT scanner using Syngovia post-processing software to demonstrate MSU crystals encoded in green.
Figure 14
Figure 14
A 65-year-old female with spinal gout. (a) Three-dimensional and (b) two-dimensional sagittal reformatted DECT images of the lumbar spine show numerous green encoded foci of MSU crystal deposition along the lumbar and visualized lower thoracic spine, sacrum and sacroiliac joints. All images acquired at 0.8–1.5 mm on a dual energy Siemens Somatom Force helical CT scanner using Syngovia post-processing software to demonstrate MSU crystals encoded in green.

References

    1. Kuo C.F., Grainge M.J., Zhang W., Doherty M. Global epidemiology of gout: Prevalence, incidence and risk factors. Nat. Rev. Rheumatol. 2015;11:649–662. doi: 10.1038/nrrheum.2015.91. - DOI - PubMed
    1. Neogi T., Chen C., Niu J., Chaisson C., Hunter D.J., Zhang Y. Alcohol quantity and type on risk of recurrent gout attacks: An internet-based case-crossover study. Am. J. Med. 2014;127:311–318. doi: 10.1016/j.amjmed.2013.12.019. - DOI - PMC - PubMed
    1. Neogi T., Jansen T.L., Dalbeth N., Fransen J., Schumacher H.R., Berendsen D., Brown M., Choi H., Edwards N.L., Janssens H.J., et al. 2015 Gout Classification Criteria: An American College of Rheumatology/European League Against Rheumatism collaborative initiative. Arthritis Rheumatol. 2015;67:2557–2568. doi: 10.1002/art.39254. - DOI - PMC - PubMed
    1. Taylor W.J., Fransen J., Jansen T.L., Dalbeth N., Schumacher H.R., Brown M., Louthrenoo W., Vazquez-Mellado J., Eliseev M., McCarthy G., et al. Study for Updated Gout Classification Criteria: Identification of Features to Classify Gout. Arthritis Care Res. (Hoboken) 2015;67:1304–1315. doi: 10.1002/acr.22585. - DOI - PMC - PubMed
    1. Low E., Ouellette H., Munk P.L. Tophaceous Gout. Ann. Acad. Med. Singap. 2020;49:931–933. doi: 10.47102/annals-acadmedsg.2020125. - DOI - PubMed

LinkOut - more resources