Clinical Trial
. 2022 Jan 10;15(1):5.
doi: 10.1186/s13045-021-01222-y.

Treatment with soluble CD24 attenuates COVID-19-associated systemic immunopathology

Affiliations
Clinical Trial

Treatment with soluble CD24 attenuates COVID-19-associated systemic immunopathology

No-Joon Song et al. J Hematol Oncol. .

Abstract

Background: Severe Acute Respiratory Syndrome Coronavirus 2 (SARS-CoV-2) causes coronavirus disease 2019 (COVID-19) through direct lysis of infected lung epithelial cells, which releases damage-associated molecular patterns and induces a pro-inflammatory cytokine milieu causing systemic inflammation. Anti-viral and anti-inflammatory agents have shown limited therapeutic efficacy. Soluble CD24 (CD24Fc) blunts the broad inflammatory response induced by damage-associated molecular patterns via binding to extracellular high mobility group box 1 and heat shock proteins, as well as regulating the downstream Siglec10-Src homology 2 domain-containing phosphatase 1 pathway. A recent randomized phase III trial evaluating CD24Fc for patients with severe COVID-19 (SAC-COVID; NCT04317040) demonstrated encouraging clinical efficacy.

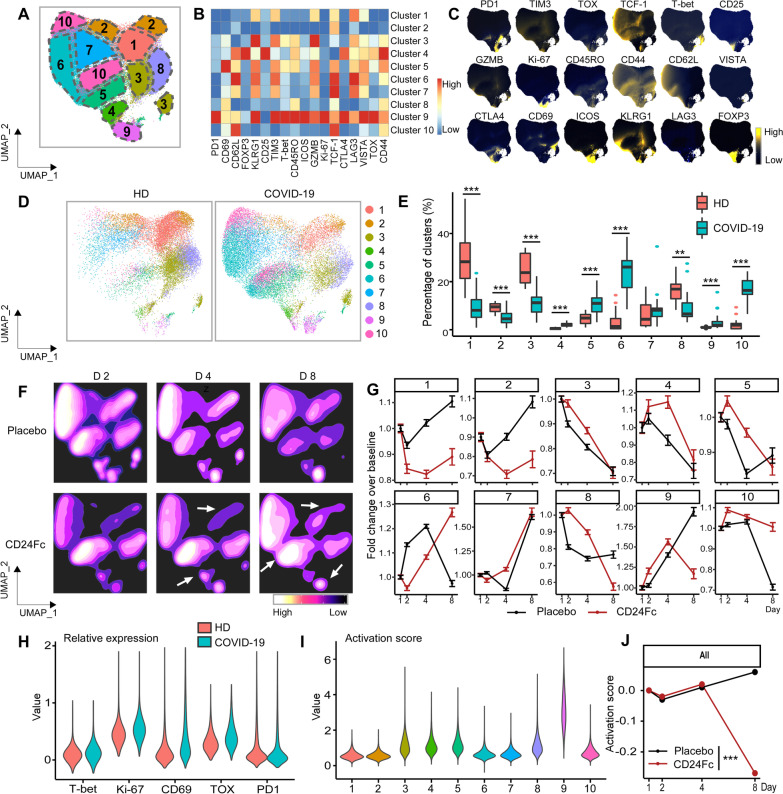
Methods: Using a systems analytical approach, we studied peripheral blood samples obtained from patients enrolled at a single institution in the SAC-COVID trial to discern the impact of CD24Fc treatment on immune homeostasis. We performed high dimensional spectral flow cytometry and measured the levels of a broad array of cytokines and chemokines to discern the impact of CD24Fc treatment on immune homeostasis in patients with COVID-19.

Results: Twenty-two patients were enrolled, and the clinical characteristics from the CD24Fc vs. placebo groups were matched. Using high-content spectral flow cytometry and network-level analysis, we found that patients with severe COVID-19 had systemic hyper-activation of multiple cellular compartments, including CD8+ T cells, CD4+ T cells, and CD56+ natural killer cells. Treatment with CD24Fc blunted this systemic inflammation, inducing a return to homeostasis in NK and T cells without compromising the anti-Spike protein antibody response. CD24Fc significantly attenuated the systemic cytokine response and diminished the cytokine coexpression and network connectivity linked with COVID-19 severity and pathogenesis.

Conclusions: Our data demonstrate that CD24Fc rapidly down-modulates systemic inflammation and restores immune homeostasis in SARS-CoV-2-infected individuals, supporting further development of CD24Fc as a novel therapeutic against severe COVID-19.

Keywords: CD24Fc; COVID-19; Cytokine score; Immunophenotyping; Soluble CD24.


Conflict of interest statement

The authors declare that they have no competing interests.

Figures

Fig. 1
Fig. 1
Population dynamics of peripheral blood mononuclear cells from healthy donors vs. patients with COVID-19 treated with placebo or CD24Fc. A total of 1,306,473 PBMCs from HD (n = 17) and COVID-19 patients (n = 22) were clustered using an unbiased multivariate t-mixture model, which identified 12 sub-clusters that reflect statistically distinct cell states. Visualization of the relative similarity of each cell and cell cluster on the two-dimensional UMAP space with a 10% downsampling (A). Cluster-by-marker heatmap characterizing the expression patterns of individual clusters (B). UMAP plots (C) and cluster frequencies (D) of HD vs. baseline COVID-19 patient samples (cluster 5, p = 0.03; cluster 6, p = 0.001; cluster 10, p < 0.001; cluster 11, p < 0.001; cluster 12, p = 0.01). Contour plots representing the density of cells throughout regions of the UMAP space from COVID-19 patients D2, D4, and D8 after CD24Fc vs. placebo treatment (E, white arrows indicate visual changes between CD24Fc vs. placebo contour plots). Cluster population dynamics as fold change over baseline for each group over time (F; p < 0.001 for cluster 1–12) (D2: placebo n = 12, CD24Fc n = 10; D4: placebo n = 11, CD24Fc n = 9; D8: placebo n = 4, CD24Fc n = 3). The p-value in D was calculated using the Wilcoxon rank-sum test. *p < 0.05; **p < 0.01; ***p < 0.001
Fig. 2
Fig. 2
Subcluster analysis of peripheral blood CD8+ T cells in COVID-19 patients: activation following SARS-CoV-2 infection is dampened by CD24Fc treatment. 1,466,822 CD8+ cells from HD (n = 17) and COVID-19 (n = 22) patients were clustered using an unbiased multivariate t-mixture model, which identified eight statistically distinct CD8+ sub-clusters that reflect different activation states. The relative similarity of each cell and cell cluster on the two-dimensional UMAP space were visualized with a 10% downsampling (A). Using median expression of flow cytometry markers, a cluster-by-marker heatmap was generated to characterize the subsets (B) and visualize individual marker expression patterns on the UMAP space (C). To understand the effect of SARS-CoV-2 infection on cell population dynamics, a comparison was made with UMAP plots (D) and cluster frequencies (E) of HD vs. baseline COVID-19 patient samples (p < 0.001 for clusters 1, 4, 5, 7, 8). The samples from COVID-19 patients 2, 4, and 8 days after CD24Fc vs. placebo are displayed using contour plots to represent density of cells throughout regions of the UMAP space (F, white arrows indicate visual changes between CD24Fc vs. placebo). Cluster population dynamics as fold change over baseline in each treatment group are shown (G; sample distribution described in Fig. 1F; p < 0.001 for cluster 1–8). To better characterize the activation status of CD8 T cells, a subset of markers (T-bet, Ki-67, CD69, TOX, GZMB) was linearly transformed to create a univariate cell-level activation score (H), where highly activated cell clusters (such as cluster 8) had highest activation scores (I). A GLMM was fit to the longitudinal cell-level activation scores to assess the effect of CD24Fc treatment on activation scores over time (J). The p-values in E and J were calculated using Wilcoxon rank-sum test and Kenward-Roger method, respectively. ***p < 0.001
Fig. 3
Fig. 3
Subcluster analysis of peripheral blood CD4+ T cells in COVID-19 patients: activation following SARS-CoV-2 infection is dampened by CD24Fc treatment. We clustered 1,203,034 CD4+ cells from HD (n = 17) and COVID-19 (n = 22) patients using an unbiased multivariate t-mixture model, which identified 10 CD4+ sub-clusters that reflect statistically distinct cell activation states. We visualized the relative similarity of each cell and cell cluster on the two-dimensional UMAP space with a 10% downsampling (A). Using median expression of flow cytometry markers, we generated a cluster-by-marker heatmap to characterize the subsets (B) and visualized individual marker expression patterns on the UMAP space (C). To understand the effect of SARS-CoV-2 infection on cell population dynamics, we compared UMAP plots (D) and cluster frequencies (E) of HD vs. baseline COVID-19 patient samples (p < 0.001 for clusters 1–6, 9, 10; cluster 8, p = 0.002). We visualized samples from COVID-19 patients D2, 4, and 8 after CD24Fc vs. placebo using contour plots to represent the density of cells throughout regions of the UMAP space (F). We describe cluster population dynamics as fold change over baseline in each group (G; sample distribution described in Fig. 1F; p < 0.001 for cluster 1–10). To better characterize the activation status of CD4 T cells, we linearly transformed a subset of markers (T-bet, Ki-67, CD69, TOX, PD1) to create a univariate cell-level activation score (H), where highly activated cell clusters (such as cluster 9) had highest activation scores (I). We fit a GLMM to our longitudinal cell-level activation scores to assess the effect of CD24Fc treatment on activation scores over time (J; p < 0.001). The p-values in E and J were calculated using the Wilcoxon rank-sum test and the Kenward–Roger method, respectively. **p < 0.01; ***p < 0.001
Fig. 4
Fig. 4
Subcluster analysis of peripheral blood Foxp3+ Treg cells in COVID-19 patients: activation following SARS-CoV-2 infection is dampened by CD24Fc treatment. We clustered 98,525 Foxp3+ Treg cells from HD (n = 17) and COVID-19 (n = 22) patients using an unbiased multivariate t-mixture model, which identified 8 Foxp3+ Treg sub-clusters that reflect statistically distinct cell activation states. We visualized the relative similarity of each cell and cell cluster on the two-dimensional UMAP space with a 10% downsampling (A). Using median expression of flow cytometry markers, we generated a cluster-by-marker heatmap to characterize the subsets (B) and visualized individual marker expression patterns on the UMAP space (C). To understand the effect of SARS-CoV-2 infection on cell population dynamics, we compared UMAP plots and cluster frequencies of HD vs. baseline COVID-19 patient samples (D and E; p < 0.001 for clusters 1–5, 7). We visualized samples from COVID-19 patients D2, 4, and 8 after CD24Fc vs. placebo using contour plots to represent the density of cells throughout regions of the UMAP space (F). We describe cluster population dynamics as fold change over baseline in each treatment group (G; sample distribution described in Fig. 1F; p < 0.001 for cluster 1, 4, 6–8; cluster 3, p = 0.004). To better characterize the activation status of Treg cells, we linearly transformed a subset of markers (Ki-67, TOX, CD25, ICOS, CTLA4) to create a univariate cell-level activation score (H), where highly activated cell clusters (such as clusters 6, 7, 8) had highest activation scores (I). We fit a GLMM to our longitudinal cell-level activation scores to assess the effect of CD24Fc on activation scores over time (J). The p-values in E and J were calculated using the Wilcoxon rank-sum test and the Kenward-Roger method, respectively. ***p < 0.001
Fig. 5
Fig. 5
Subcluster analysis of peripheral blood NK cells in COVID-19 patients: activation following SARS-CoV-2 infection is dampened by CD24Fc treatment. CD56+ cells (n = 783,623) from HD (n = 17) and COVID-19 (n = 22) patients were clustered using an unbiased multivariate t-mixture model, which identified 12 sub-clusters that reflect statistically distinct CD56+ T cell activation states. The relative similarity of each cell and cell cluster on the two-dimensional UMAP space were visualized with a 10% downsampling (A). Using median expression of flow cytometry markers, a cluster-by-marker heatmap was generated to characterize subsets (B) and visualize individual marker expression patterns on UMAP space (C). To understand effect of SARS-CoV-2 infection on NK population dynamics, we compared UMAP plots (D) and cluster frequencies (E; cluster 1, p = 0.04; cluster 2, p = 0.003; cluster 9, p = 0.002; cluster 12, p = 0.03; p < 0.01 for clusters 4–6, 8 and 11) of HD vs. baseline COVID-19 samples. D2, 4, 8 samples from placebo and CD24Fc-treated groups were visualized using contour plots to represent density of cells throughout regions of the UMAP space (F, white arrows indicate visual changes between CD24Fc vs. placebo). The cluster population dynamics as fold change over baseline in each group was shown (G; sample distribution described in Fig. 1; p < 0.001 for cluster 1, 3–12). To better characterize the activation status of NK cells, a subset of markers (TOX, GZMB, KLRG1, Ki-67, LAG-3) was linearly transformed to create a univariate cell-level activation score (H), where highly activated cell clusters (such as cluster 11) had highest activation scores (I). A GLMM was fit to the longitudinal cell-level activation scores to assess the effect of CD24Fc on activation scores over time (J). The p values in E and J were calculated using Wilcoxon rank-sum and Kenward–Roger method, respectively. *p < 0.05; **p < 0.01; ***p < 0.001
Fig. 6
Fig. 6
CD24Fc treatment downregulates systemic cytokine response in patients with COVID-19. Relative differences in plasma concentrations of cytokines/chemokines between HD (n = 25) and COVID-19 patients (n = 22) is shown. Values were log-transformed and evaluated using independent sample t-test. Significantly up- and down-regulated markers are shown (A). Heatmap analysis (B) visualized relative levels of cytokines/chemokines (Placebo: D1 n = 12, D2 n = 12, D4 n = 11, D8 n = 5; CD24Fc: D1 n = 10, D2 n = 10, D4 n = 9, D8 n = 3). Using log-10 transformation of cytokine concentrations (dots) and GLMM-predicted fixed effects trends (lines), changes in IL-10 (C; p = 0.05) and IL-15 (D; p = 0.002) in CD24Fc (red) and placebo (black) groups were revealed. Values and trend lines were centered at D1 mean. p-value was calculated using the Kenward–Roger method. The cytokine score was analyzed longitudinally using weighed sum approach (E; p < 0.001). Using Pearson correlation matrices (F) and network maps (G; weight of edge represents correlation coefficient), 30 plasma markers in HD (n = 25), COVID-19 baseline (D1, n = 22), placebo (pooled D2–D8, n = 28), and CD24Fc-treated (pooled D2–D8, n = 24) groups were visualized. Using these correlation coefficients, a density plot (H; D1 vs placebo, p = 0.07; D1 vs CD24Fc, p < 0.001; placebo vs CD24Fc, p < 0.001) was constructed. Kolmogorov–Smirnov test was used to evaluate equality of densities between groups. Analysis of connectivity (I) and centrality analysis of cytokine network (J) display the cytokine expression relationships. Network connectivity plots display highly correlated connections for each cytokine (i.e., node degree) and was evaluated using paired t-test. Centrality analysis of cytokine network used eigenvector centrality score that considers global network connectivity and correlation coefficients between cytokines (HD vs D1, p < 0.001; D1 vs placebo, p = 0.08; D1 vs CD24Fc, p < 0.001). Bartlett’s test evaluated the significance of variance of centrality scores (HD vs D1, p = 0.013; D1 vs placebo, p = 0.17; D1 vs CD24Fc, p = 0.008). Each dot in I and J represents a cytokine. *p < 0.05; **p < 0.01; ***p < 0.001
Fig. 7
Fig. 7
Patients with severe COVID-19 that require an ICU treatment display increased correlation and connectivity of the systemic cytokine network. We analyzed correlation (A) and connectivity (B) between circulating cytokines and chemokines in COVID-19 patients that either required (ICU patients), or did not require an ICU treatment (non-ICU patients). Cytokine measurements were obtained from previously published dataset [40]. Analysis was performed as described in Fig. 6. A density plot constructed based on connectivity between plasma cytokines is shown in C. D shows an association between the severity of COVID-19 infection and the degree of the connectivity between plasma cytokines with severe UCU cases displaying higher degree of connectivity. p-value was calculated using Wilcoxon Rank sum

Update of

References

    1. Hoffmann M, Kleine-Weber H, Schroeder S, Kruger N, Herrler T, Erichsen S, et al. SARS-CoV-2 cell entry depends on ACE2 and TMPRSS2 and is blocked by a clinically proven protease inhibitor. Cell. 2020;181(2):271–80. - PMC - PubMed
    1. Silva-Lagos LA, Pillay J, van Meurs M, Smink A, van der Voort PHJ, de Vos P. DAMPening COVID-19 severity by attenuating danger signals. Front Immunol. 2021;12:720192. - PMC - PubMed
    1. Land WG. Role of DAMPs in respiratory virus-induced acute respiratory distress syndrome-with a preliminary reference to SARS-CoV-2 pneumonia. Genes Immun. 2021;22(3):141–160. doi: 10.1038/s41435-021-00140-w. - DOI - PMC - PubMed
    1. Cicco S, Cicco G, Racanelli V, Vacca A. Neutrophil Extracellular Traps (NETs) and damage-associated molecular patterns (DAMPs): two potential targets for COVID-19 treatment. Mediators Inflamm. 2020;2020:7527953. doi: 10.1155/2020/7527953. - DOI - PMC - PubMed
    1. Cao X. COVID-19: immunopathology and its implications for therapy. Nat Rev Immunol. 2020;20(5):269–270. doi: 10.1038/s41577-020-0308-3. - DOI - PMC - PubMed

Publication types

MeSH terms

Associated data