. 2022 Jan 10;14(1):7.
doi: 10.1186/s13195-021-00951-z.

Artificial intelligence framework identifies candidate targets for drug repurposing in Alzheimer's disease

Affiliations

Artificial intelligence framework identifies candidate targets for drug repurposing in Alzheimer's disease

Jiansong Fang et al. Alzheimers Res Ther. .

Abstract

Background: Genome-wide association studies (GWAS) have identified numerous susceptibility loci for Alzheimer's disease (AD). However, utilizing GWAS and multi-omics data to identify high-confidence AD risk genes (ARGs) and druggable targets that can guide development of new therapeutics for patients suffering from AD has heretofore not been successful.

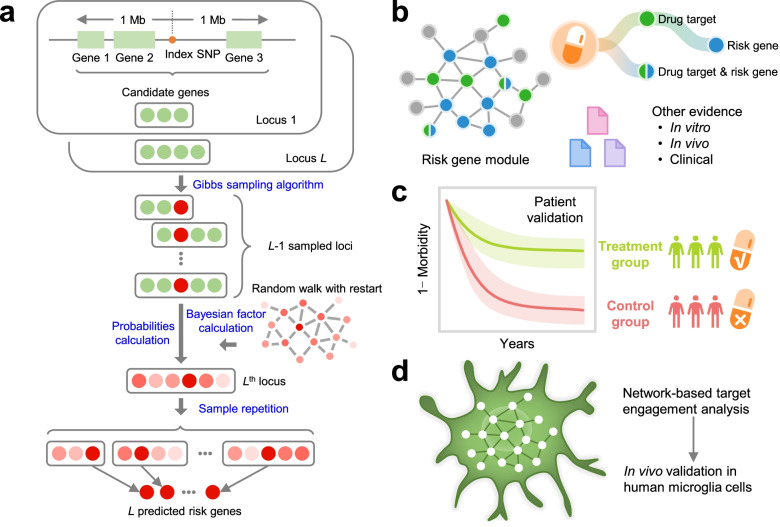
Methods: To address this critical problem in the field, we have developed a network-based artificial intelligence framework that is capable of integrating multi-omics data along with human protein-protein interactome networks to accurately infer accurate drug targets impacted by GWAS-identified variants to identify new therapeutics. When applied to AD, this approach integrates GWAS findings, multi-omics data from brain samples of AD patients and AD transgenic animal models, drug-target networks, and the human protein-protein interactome, along with large-scale patient database validation and in vitro mechanistic observations in human microglia cells.

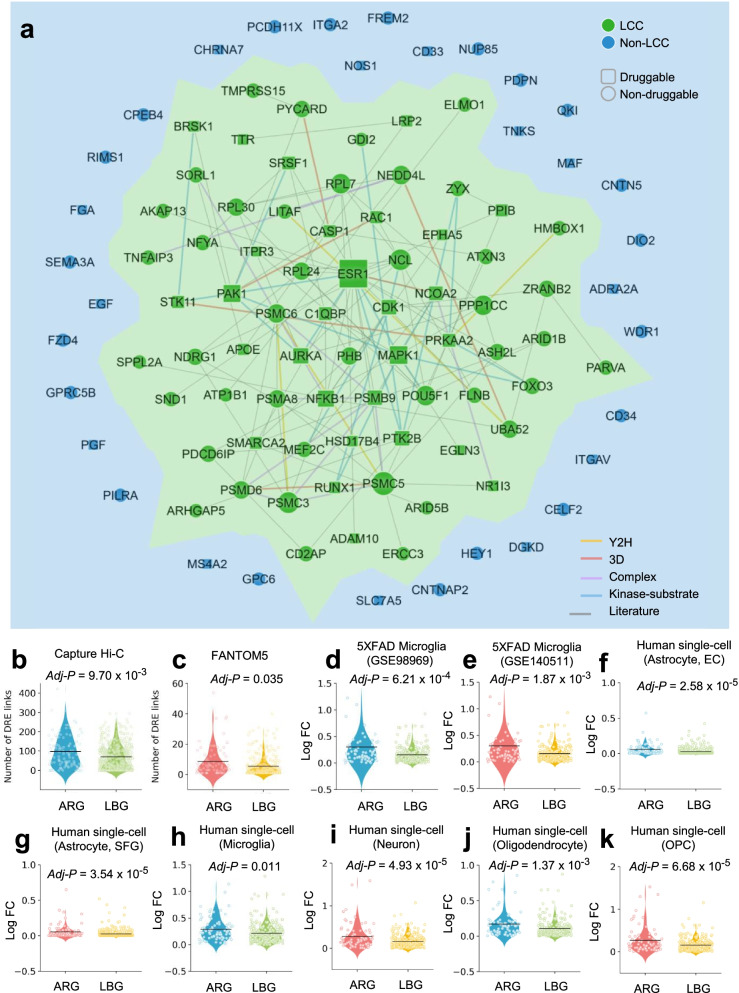
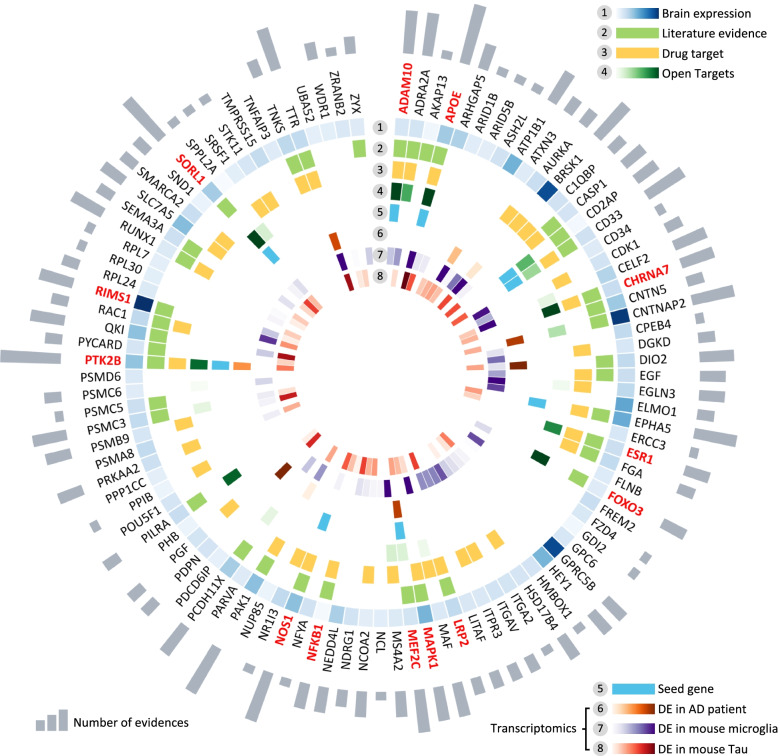
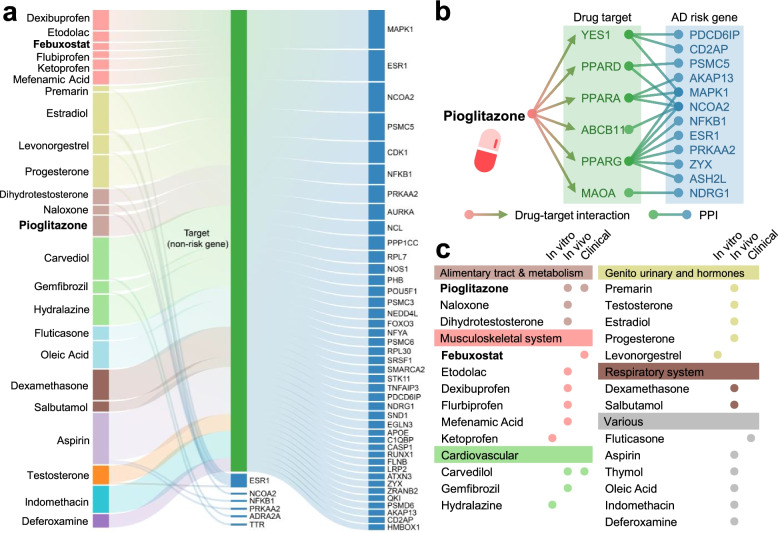
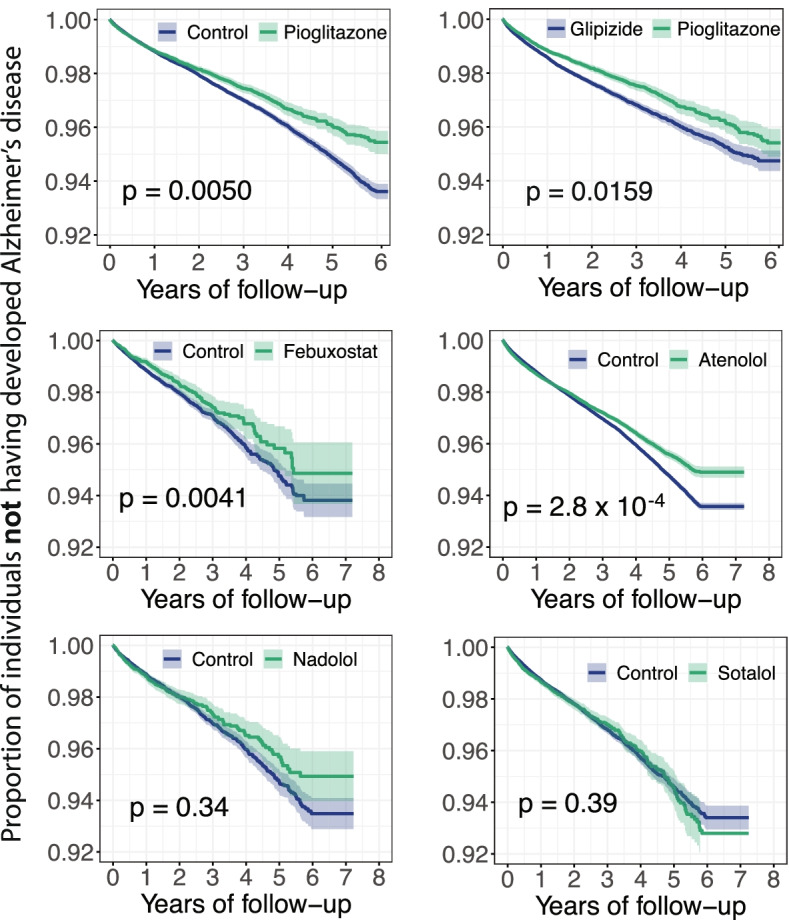
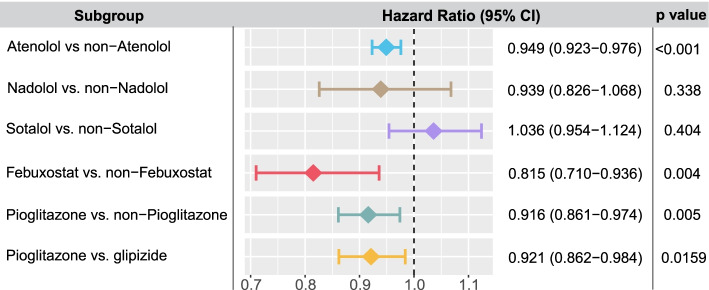
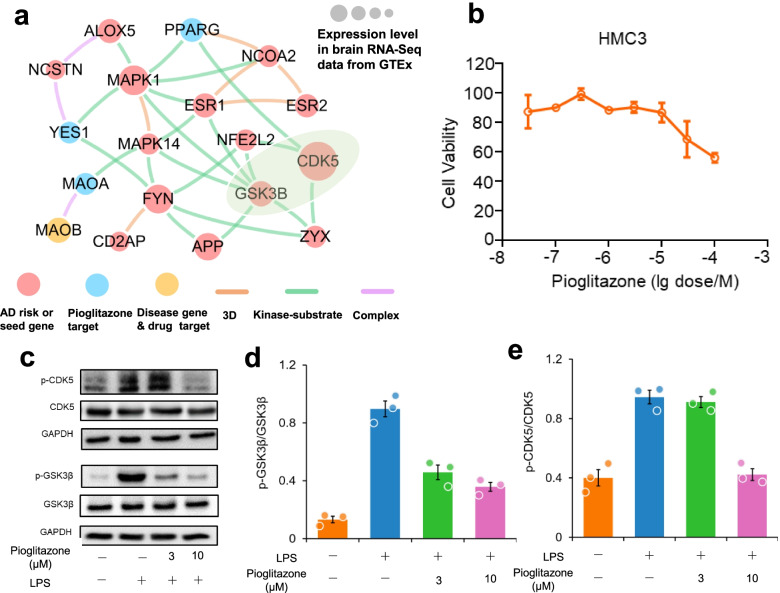
Results: Through this approach, we identified 103 ARGs validated by various levels of pathobiological evidence in AD. Via network-based prediction and population-based validation, we then showed that three drugs (pioglitazone, febuxostat, and atenolol) are significantly associated with decreased risk of AD compared with matched control populations. Pioglitazone usage is significantly associated with decreased risk of AD (hazard ratio (HR) = 0.916, 95% confidence interval [CI] 0.861-0.974, P = 0.005) in a retrospective case-control validation. Pioglitazone is a peroxisome proliferator-activated receptor (PPAR) agonist used to treat type 2 diabetes, and propensity score matching cohort studies confirmed its association with reduced risk of AD in comparison to glipizide (HR = 0.921, 95% CI 0.862-0.984, P = 0.0159), an insulin secretagogue that is also used to treat type 2 diabetes. In vitro experiments showed that pioglitazone downregulated glycogen synthase kinase 3 beta (GSK3β) and cyclin-dependent kinase (CDK5) in human microglia cells, supporting a possible mechanism-of-action for its beneficial effect in AD.

Conclusions: In summary, we present an integrated, network-based artificial intelligence methodology to rapidly translate GWAS findings and multi-omics data to genotype-informed therapeutic discovery in AD.

Keywords: Alzheimer’s disease; Drug repurposing; Genome-wide association studies (GWAS); Multi-omics; Network medicine; Pioglitazone.


Conflict of interest statement

Dr. Cummings has provided consultation to Acadia, Actinogen, Alkahest, Alzheon, Annovis, Avanir, Axsome, Biogen, BioXcel, Cassava, Cerecin, Cerevel, Cortexyme, Cytox, EIP Pharma, Eisai, Foresight, GemVax, Genentech, Green Valley, Grifols, Karuna, Merck, Novo Nordisk, Otsuka, Resverlogix, Roche, Samumed, Samus, Signant Health, Suven, Third Rock, and United Neuroscience pharmaceutical and assessment companies. Dr. Cummings has stock options in ADAMAS, AnnovisBio, MedAvante, and BiOasis. Dr. Leverenz has received consulting fees from Vaxxinity, grant support from GE Healthcare and serves on a Data Safety Monitoring Board for Eisai. The other authors declare that they have no competing interests.

Figures

Fig. 1
Fig. 1
A diagram illustrating a genotype-informed, network methodology and population-based validation for Alzheimer’s therapeutic discovery. a A framework of network-based Bayesian algorithm (see “Material and methods”) for identifying Alzheimer’ disease (AD) risk genes. Specifically, this algorithm integrates multi-omics data and gene networks to infer risk genes from AD GWAS loci. b Network-based drug repurposing by incorporating ARGs and the human interactome network. c Population-based validation to test the drug user’s relationship with AD outcomes. Comparison analyses were conducted to evaluate the predicted drug-AD association based on individual-level longitudinal patient data and the state-of-the-art pharmacoepidemiologic methods (see “Material and methods”). d Network-based mechanistic observation. Experimental validation of network-predicted drug’s proposed mechanism-of-action in human microglial cells. Specifically, target prioritization and drug repurposing were conducted using network models in addition to the Bayesian algorithm. In step 1, we predicted ARGs (AD risk genes) as potential drug targets from GWAS findings using the Bayesian algorithm. In step 2, we prioritized candidate drugs via quantifying network proximity score between drug targets and ARGs under the human protein–protein interactome network models
Fig. 2
Fig. 2
Network-based validation of predicted risk genes for Alzheimer’s disease (AD). a A subnetwork highlighting disease module formed by predicted AD risk genes (ARGs) in the human protein–protein interactome. This disease module includes 128 protein–protein interactions (PPIs) (edges or links) connecting 70 ARGs (nodes). Larger node size highlighting the high expression level in brain compared to other tissues. b–k Discovery of genomic features of 103 predicted ARGs implicated in AD. ARGs capture strong distal gene regulatory elements in Hi-C (b) and FANTOM5 data (c) compared to a set of local background genes (LBGs). d–k AGRs are more likely to be differentially expressed across 4 single-cell/nucleus RNA sequencing datasets (Table S3): d, e brain microglia cell of 5XFAD mouse model (GSE98969 [d] and GSE140511 [e]); f,g a human single-cell atlas (GSE147528) of entorhinal cortex (f) and the superior frontal gyrus (g) from individuals spanning the neuropathological progression of AD patient brain astrocyte cells; and a single-cell atlas (GSE138852) of entorhinal cortex from AD patients across four brain cell types: microglia [h], neuron [i], oligodendrocyte [j], oligodendrocyte progenitor cell (OPC) [k]. P value was computed by one-tail T-test. Adjusted P value (adj-P) was calculated based on the Benjamini−Hochberg approach. LCC: largest connected component; EC: entorhinal cortex; SFG: superior frontal gyrus
Fig. 3
Fig. 3
Multi-omics validation of network-predicted risk genes for Alzheimer’s disease (AD). Circle plot shows all 103 predicted AD risk genes validated by multiple-scale biological evidence. In total, 8 types of biological evidence were evaluated: (1) Brain-expression specificity derived from GTEx database (z-score > 0 as a high brain-specific expressed gene); (2) literature evidence validation for the gene associated with AD; (3) drug target information; (4) literature-derived experimental data from Open targets database; (5) high-quality experimentally validated AD-associated genes; (5–8) transcriptomics-based evidence (Table S3): (6) differential expression (DE) in AD patient brains; (7) differential expression in brain microglia cells of 5XFAD mouse model; (8) differential expression in brain hippocampus of Tg4510 mouse model. Gray bar denotes the number of biological evidence. A total of 13 selected risk genes involved in four AD key pathways are highlighted by red: including regulation of neurotransmitter transport, Aβ metabolic process, long-term synaptic potentiation, and oxidative stress
Fig. 4
Fig. 4
Risk gene-informed drug repurposing for Alzheimer’s disease (AD). a A Sankey diagram illustrates a global view of 25 repurposable drug candidates with published evidence for AD. These drugs are linked to their physical binding targets or neighborhood proteins derived from network-predicted AD risk genes. b Network proximity analysis measures the network distance between disease module and drug targets in the human interactome. A subnetwork indicates the molecular mechanism of pioglitazone implicated in AD, which targets six physical binding proteins of which neighborhoods are 12 predicted AD risk genes. c Drugs are grouped by their first-level Anatomical Therapeutic Chemical Classification (ATC) codes. The drugs with known anti-AD clinical status, in vitro and in vivo mouse model published data are given. Pioglitazone and febuxostat with anti-AD clinical evidence are highlighted
Fig. 5
Fig. 5
Longitudinal analyses reveal that pioglitazone reduces incidence of Alzheimer’s disease in patient data. Six comparison analyses were conducted including (i) pioglitazone (n = 101,650) vs. matched control population (n = 402,184); (ii) pioglitazone vs. glipizide (a diabetes drug, n = 191,656); (iii) febuxostat (n = 24,218) vs. control (n = 95,192); (iv) atenolol (n = 366,277) vs. control (n = 1,449,815); (v) nadolol (n = 19,253) vs. control (n = 76,136); and (vi) sotalol (n = 43,819) vs. control (n = 172,375). First, for each comparison, we estimated the propensity score by using the variables described in Table 2. Then, we estimated the unstratified Kaplan-Meier curves, conducted propensity score stratified (n strata = 10) log-rank test and Cox model. Using propensity score stratified survival analyses, non-exposures were matched to the exposures (ratio 4:1) by adjusting the initiation time of drug, enrollment history, age and gender, and disease comorbidities (hypertension, type 2 diabetes and coronary artery disease)
Fig. 6
Fig. 6
Hazard ratios and 95% confidence interval (CI) for six cohort studies. Six cohorts include the following: (i) pioglitazone (n = 101,650) vs. matched control population (n = 402,184), (ii) pioglitazone vs. glipizide (a diabetes drug, n = 191,656); (iii) febuxostat (n = 24,218) vs. control (n = 95,192), (iv) atenolol (n = 366,277) vs. control (n = 1,449,815); (v) nadolol (n = 19,253) vs. control (n = 76,136); and (vi) sotalol (n = 43,819) vs. control (n = 172,375). For each comparison, we estimated the propensity score for confounding factor (Table 2) adjustment as described in “Material and methods”
Fig. 7
Fig. 7
Experimental validation of pioglitazone’s proposed mechanism-of-action in Alzheimer’s disease (AD). a Network analysis highlighting the inferred mechanism-of-action for pioglitazone in AD. The potential molecular mechanisms of pioglitazone were inferred through integration of known drug targets and predicted AD risk or AD seed genes into brain-specific co-expressed protein–protein interactome network (see “Material and methods”). The green shadow emphasizes the two key proteins (GSK3B and CDK5) related to drug’s mechanism-of-action. Node size indicates the protein-coding gene expression level in brain compared with other 31 tissues from GTEx database (GTEx V8 release, 2020). Larger size highlighting the high expression level in brain compared with other tissues. We excluded the literature-derived protein–protein interactions. b Effects of pioglitazone on the cell viability of HMC3 cells. HMC3 cells were treated with indicated concentrations of pioglitazone for 48 h and cell viability was determined using MTT. Data are represented as mean ± SEM (n = 3) and each experiment was performed at least three times in duplicate. c Effects of pioglitazone on LPS-induced activation of GSK3β (d) and CDK5 (e) in human microglia HMC3 cells. HMC3 cells were pre-treated with pioglitazone and followed LPS treatment (1 μg/mL, 30 min). The total cell lysates were collected and subjected to Western blot analysis. Quantification data represent mean ± sd. of two independent experiments

References

    1. Long JM, Holtzman DM. Alzheimer disease: an update on pathobiology and treatment strategies. Cell. 2019;179(2):312-39. 10.1016/j.cell.2019.09.001 pmid: 31564456. - PMC - PubMed
    1. Masters CL, Bateman R, Blennow K, Rowe CC, Sperling RA, Cummings JL. Alzheimer's disease. Nat Rev Dis Primers. 2015;1:15056. 10.1038/nrdp.2015.56 pmid: 27188934. - PubMed
    1. Nichols E, Szoeke CEI, Vollset SE, Abbasi N, Abd-Allah F, Abdela J. Global, regional, and national burden of Alzheimer's disease and other dementias, 1990-2016: a systematic analysis for the Global Burden of Disease Study 2016. Lancet Neurol. 2019;18(1):88-106. 10.1016/s1474-4422(18)30403-4 pmid: 30497964. - PMC - PubMed
    1. Jung YJ, Kim YH, Bhalla M, Lee SB. Genomics: new light on Alzheimer's disease research. Int J Mol Sci. 2018;19(12):3771. 10.3390/ijms19123771 pmid: 30486438. - PMC - PubMed
    1. Cuyvers E, Sleegers K. Genetic variations underlying Alzheimer's disease: evidence from genome-wide association studies and beyond. Lancet Neurol. 2016;15(8):857-68. 10.1016/s1474-4422(16)00127-7 pmid: 27302364. - PubMed

Publication types