. 2022 Jan 10;71(10):2043-2068.
doi: 10.1136/gutjnl-2021-324994. Online ahead of print.

Extracellular Vesicles from Pancreatic Cancer Stem Cells Lead an Intratumor Communication Network (EVNet) to fuel tumour progression

Affiliations

Extracellular Vesicles from Pancreatic Cancer Stem Cells Lead an Intratumor Communication Network (EVNet) to fuel tumour progression

Carolina F Ruivo et al. Gut. .

Abstract

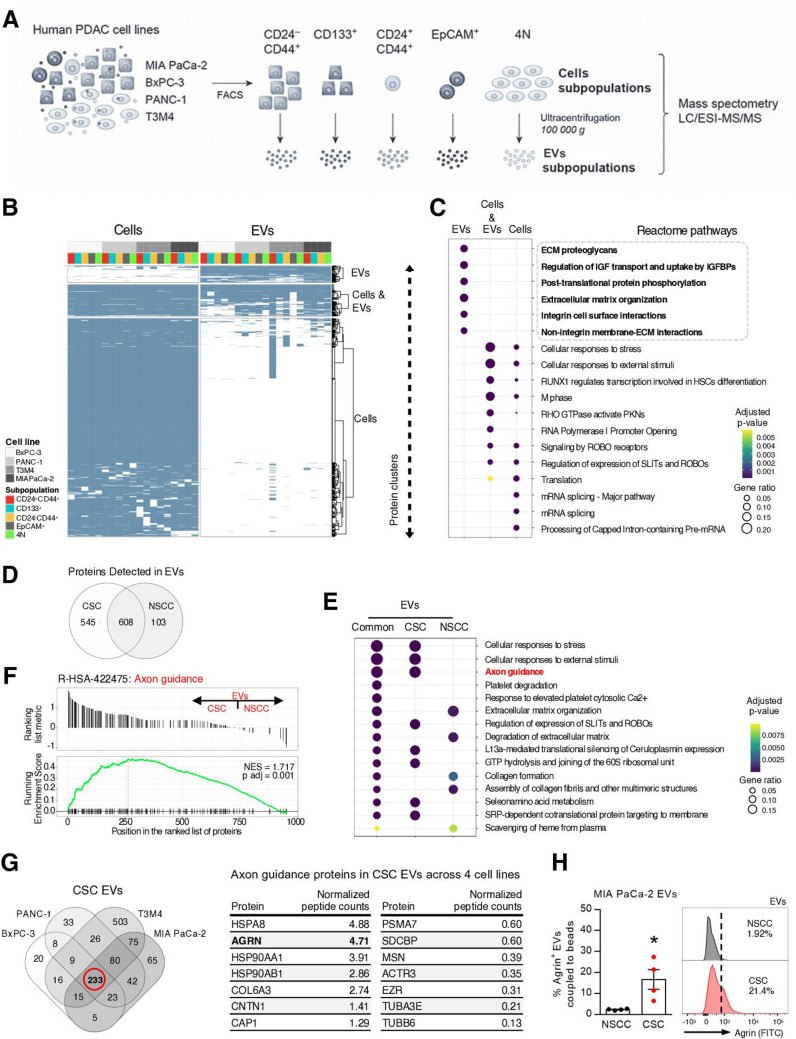
Objective: Intratumor heterogeneity drives cancer progression and therapy resistance. However, it has yet to be determined whether and how subpopulations of cancer cells interact and how this interaction affects the tumour.

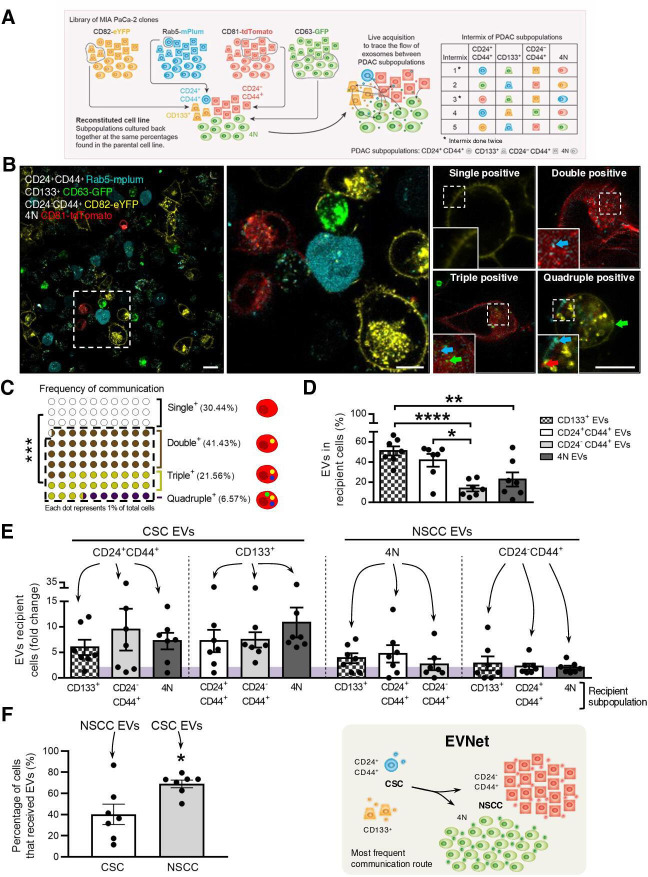
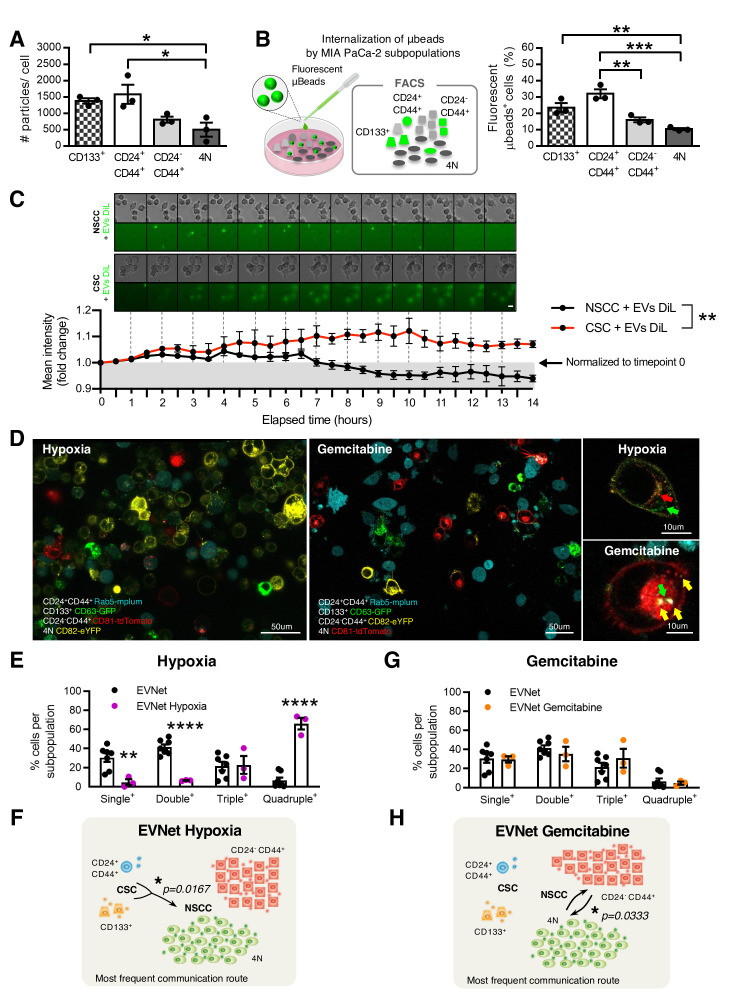
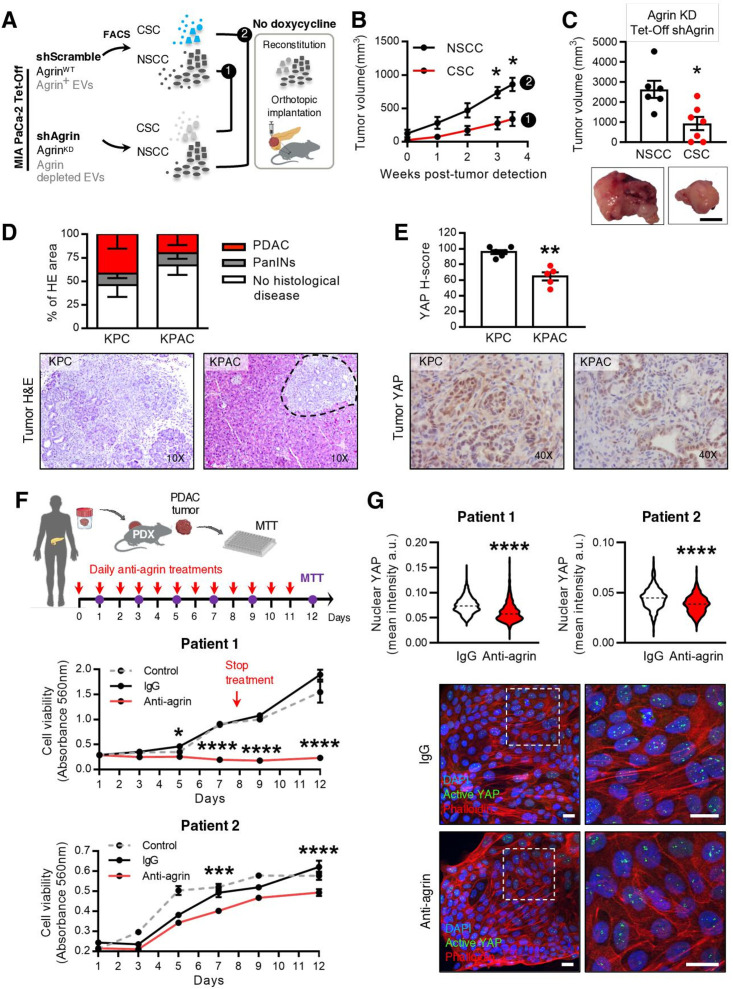
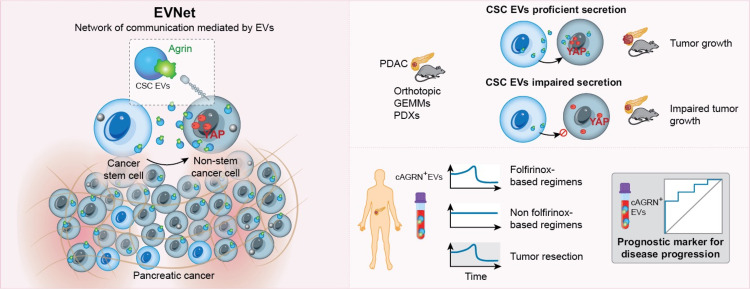
Design: We have studied the spontaneous flow of extracellular vesicles (EVs) between subpopulations of cancer cells: cancer stem cells (CSC) and non-stem cancer cells (NSCC). To determine the biological significance of the most frequent communication route, we used pancreatic ductal adenocarcinoma (PDAC) orthotopic models, patient-derived xenografts (PDXs) and genetically engineered mouse models (GEMMs).

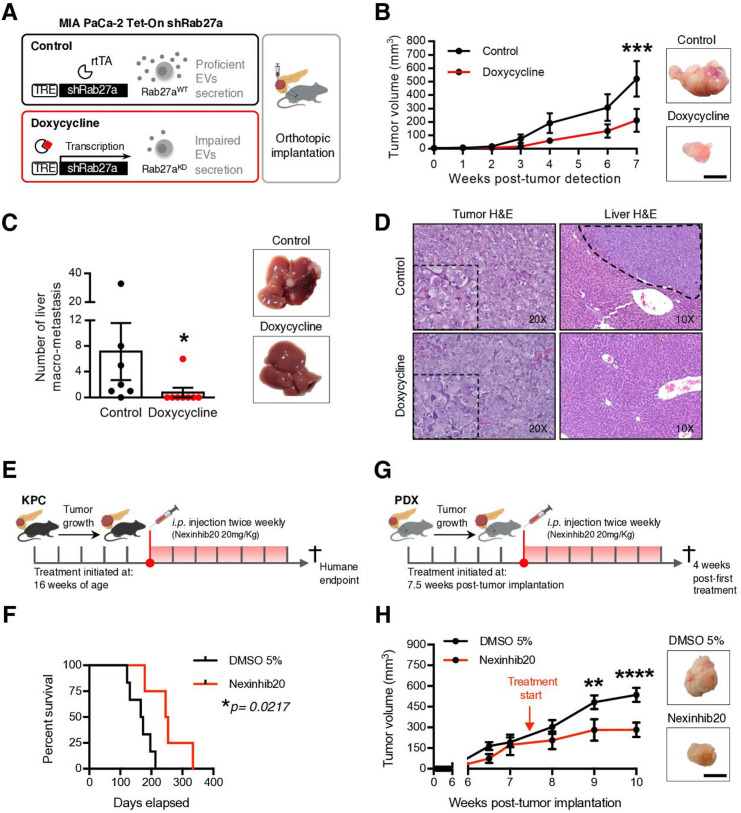
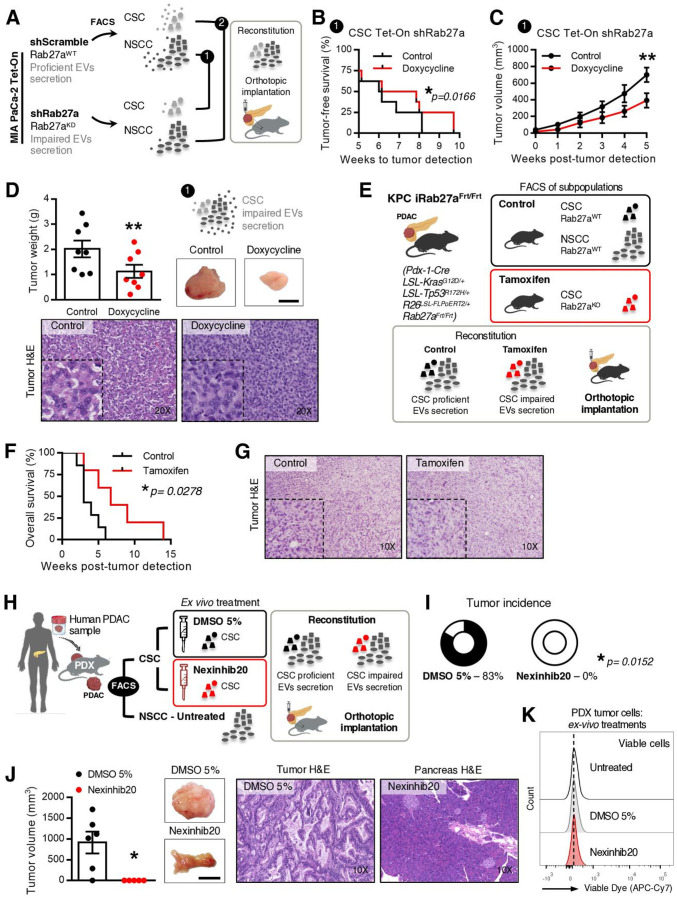
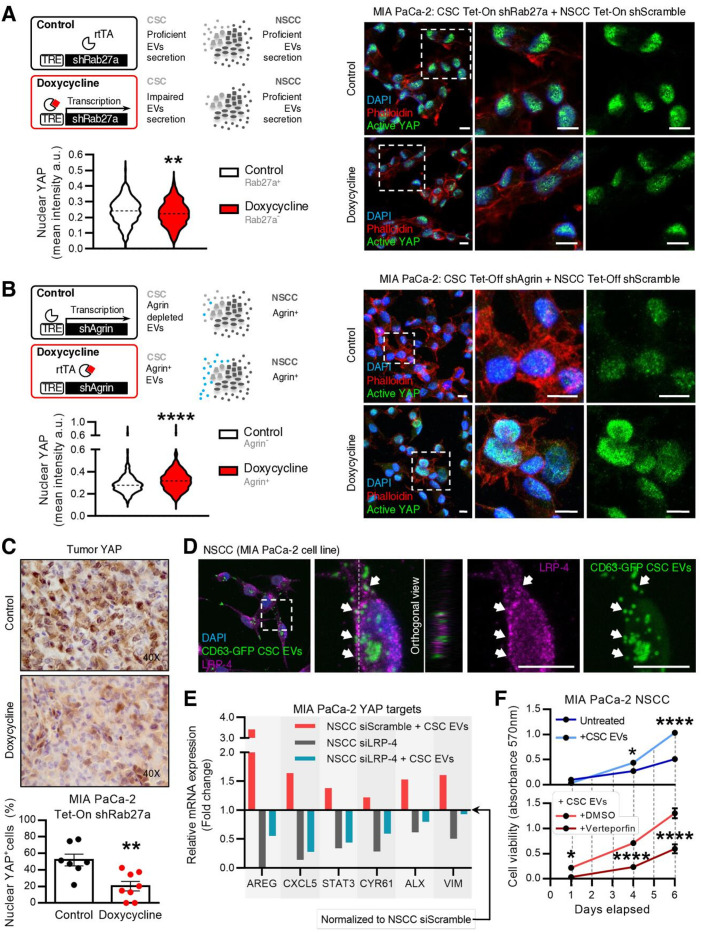
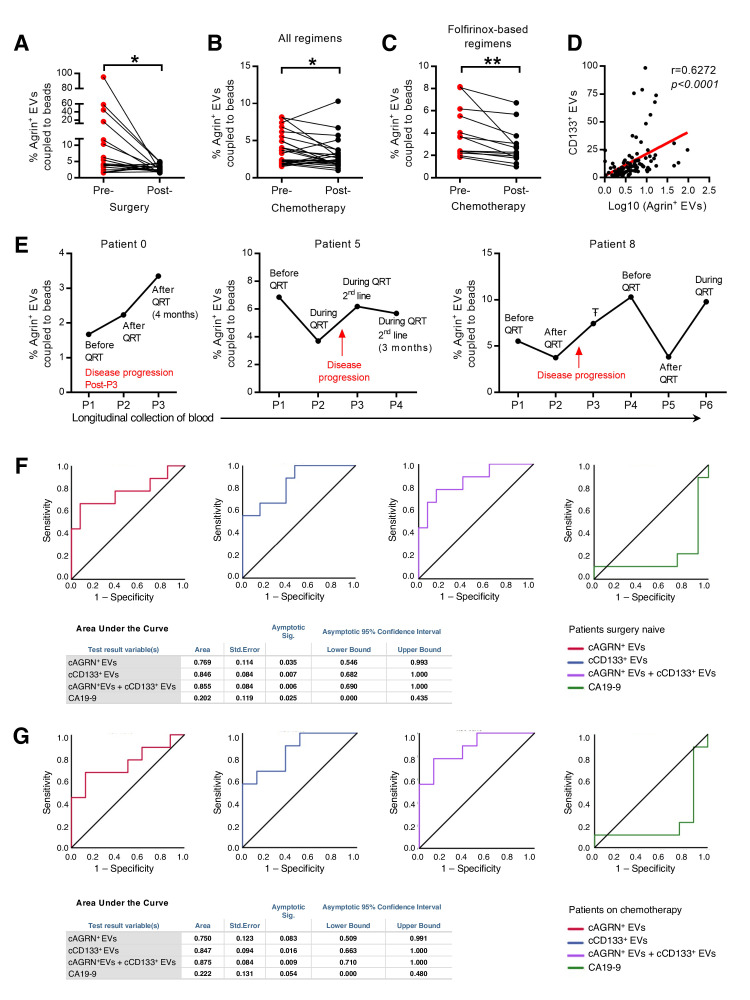
Results: We demonstrate that PDAC tumours establish an organised communication network between subpopulations of cancer cells using EVs called the EVNet). The EVNet is plastic and reshapes in response to its environment. Communication within the EVNet occurs preferentially from CSC to NSCC. Inhibition of this communication route by impairing Rab27a function in orthotopic xenographs, GEMMs and PDXs is sufficient to hamper tumour growth and phenocopies the inhibition of communication in the whole tumour. Mechanistically, we provide evidence that CSC EVs use agrin protein to promote Yes1 associated transcriptional regulator (YAP) activation via LDL receptor related protein 4 (LRP-4). Ex vivo treatment of PDXs with antiagrin significantly impairs proliferation and decreases the levels of activated YAP.Patients with high levels of agrin and low inactive YAP show worse disease-free survival. In addition, patients with a higher number of circulating agrin+ EVs show a significant increased risk of disease progression.

Conclusion: PDAC tumours establish a cooperation network mediated by EVs that is led by CSC and agrin, which allows tumours to adapt and thrive. Targeting agrin could make targeted therapy possible for patients with PDAC and has a significant impact on CSC that feeds the tumour and is at the centre of therapy resistance.

Keywords: carcinogenesis; cell biology; molecular carcinogenesis; pancreatic cancer.


Conflict of interest statement

Competing interests: SAM holds patents in the area of exosome biology. TK is a founder of Abcam plc and Storm Therapeutics and is on the scientific advisory board of Foghorn Therapeutics. RK holds patents in the area of exosomes biology and are licensed to Codiak Biosciences, Inc. RK is stockholder in Codiak Biosciences, Inc. RK is a consultant and scientific adviser for Codiak Biosciences, Inc. The other authors declare no potential conflict of interest.

Figures

Figure 1
Figure 1
The most frequent communication route in the PDAC EVNet occurs from CSC to NSCC. (A) Schematics of the methodological approach: MIA PaCa-2 clones expressing different fluorescently labelled markers are cultured at the percentages found in the parental cell line and are analysed through flow cytometry in order to trace the flow of EVs among subpopulations. A total of seven intermix of colour-coded subpopulations was analysed, corresponding to five distinct intermixes. Subpopulations: CD24+CD44+ refers to CD24+CD44+CD133EpCAM; CD133 +refers to CD133+CD24CD44EpCAM; CD24-CD44+ refers to CD24CD44+CD133EpCAM; 4N refers to CD24CD44CD133EpCAM. (B) Representative confocal microscopy live images of 72-hour culture MIA PaCa-2 colour-coded subpopulations (CD133+ CD63-GFP, CD24+44+ Rab5-mPlum, CD24-CD44+ CD82-eYFP and 4N CD81-tdTomato). Right panel: representative images of a cell where EVs uptake was not detected (single positive), a cell that received EVs from one different subpopulation (double positive), a cell that received from two other subpopulations (triple positive) or from all four subpopulations (quadruple positive). Scale bars from left to right: 20, 10 and 10 µm. (C) Dot plot representing the percentage of single-positive, double-positive, triple-positive and quadruple-positive cells found in the cocultures (n=7, Mann-Whitney test ***p<0.001). (D) Quantification of the percentage of cells that received EVs from CD133+, CD24+CD44+, CD2444+ and 4N subpopulations (n=7, one-way analysis of variance (ANOVA) *p<0.05, **p<0.01, ****p<0.0001). (E) Quantification of cells of different subpopulations that receive EVs from CSC or NSCC (highlighted on top). The fold change was calculated against the minimum percentage of communication found in each coculture (n=7). (F) Quantification of the percentage of cells that received EVs (left) and schematic representation of the most frequent communication route in the EVNet, from CSC to NSCC (right, comparison of CSC positive for NSCC EVs and NSCC positive for CSC EVs; n=7, Mann-Whitney test, *p=0.0379). Data are mean±SEM. CSC, cancer stem cell; EVs, extracellular vesicles; EVNet, Extracellular Vesicles from Pancreatic Cancer Stem Cells Lead an Intratumor Communication Network; NSCC, non-stem cancer cells; PDAC, pancreatic ductal adenocarcinoma.
Figure 2
Figure 2
The EVNet is an organised and plastic communication network of EVs. (A) Quantification of the number of particles secreted by individual MIA PaCa-2 subpopulations measured by NTA (n=3, one-way ANOVA; *p<0.05). (B) Experimental set-up (left): MIA PaCa-2 subpopulations were treated with fluorescent microbeads and analysed through flow cytometry. Quantification of the percentage of subpopulations showing uptake of fluorescent microbeads (right, n=3, one-way ANOVA; **p<0.01, ***p<0.001). (C) Representative time-lapse images of CSC and NSCC treated with 1,1'-Dioctadecyl-3,3,3',3'-Tetramethylindocarbocyanine Perchlorate (DiL)- labelled EVs (top). Graphic depicts fold change of mean fluorescence intensity relative to timepoint 0 (bottom, n=5 images per group, two-way ANOVA; **p=0.0037). (D) Representative confocal microscopy live images of the MIA PaCa-2 cells with colour-coded subpopulations cultured for 72 hours in hypoxia (1% O2, left) or treated with gemcitabine (1 µM, right). Scale bars on larger panels: 50 µm, and on smaller panels: 10 µm. (E) Quantification of the percentage of single-positive, double-positive, triple-positive and quadruple-positive cells in MIA PaCa-2 cultures in hypoxia (1% O2, n=3; one-way ANOVA; **p<0.01, ****p<0.0001). (F) Respective graphical representation of the communication network of communication established between subpopulations of cancer cells under hypoxic conditions. The most frequent communication route from CSC to NSCC is significant in comparison to the same route in the EVNet (Mann-Whitney test, *p=0.0167). (G) Quantification of the percentage of single-positive, double-positive, triple-positive and quadruple-positive cells in MIA PaCa-2 cultures treated with gemcitabine (1 µM, n=3) and (H) respective graphical representation of the communication network established between subpopulations of cancer cells under gemcitabine treatments. The most frequent communication routes occur between the two subpopulations of NSCC compared with the same routes in the EVNet (Mann-Whitney test, *p=0.0333). Data are mean±SEM. ANOVA, analysis of variance; CSC, cancer stem cell; EVs, extracellular vesicles; EVNet, Extracellular Vesicles from Pancreatic Cancer Stem Cells Lead an Intratumor Communication Network; FACS, fluorescence activated cell sorting; NSCC, non-stem cancer cell; NTA, nanoparticle tracking analysis.
Figure 3
Figure 3
Impairment of the EVNet hampers tumour growth in PDAC orthotopic, GEMM and PDX models. (A) Experimental layout: in order to impair cancer EVs secretion, a doxycycline-inducible (Tet-On) shRNA against Rab27A was transfected into MIA PaCa-2 cells, which were then orthotopically implanted into the pancreas of Rag2−/−Il2rg−/− mice. (B) Tumour growth curve measured by ultrasound and representative photos of MIA PaCa-2 Tet-On shRab27a tumours treated with doxycycline (n=8) and control (non-treated, n=7, two-way ANOVA; ***p<0.001). Scale bar: 10 mm. (C) Liver macrometastasis quantification and representative photos of livers of the MIA PaCa-2 Tet-On shRab27a model treated with doxycycline (n=8) and control (n=7) (Mann-Whitney test, *p<0.05). (D) Representative H&E staining of orthotopic MIA PaCa-2 Tet-On shRab27a tumours (left, with zoom inset) and liver metastasis (right, dashed line) treated with doxycycline and control. (E) Experimental outline of KPC mice treated with Nexinhib20 (20 mg/kg) or dimethyl sulfoxide (DMSO) (5%) at 16 weeks of age when tumours are mature and are sacrificed at humane endpoint. Treatments were administered two times per week by intraperitoneal injection. (F) Kaplan-Meier curve of the overall survival of KPC mice treated with Nexinhib20 (n=4) vs DMSO 5% (n=6) (log-rank Mantel-Cox test, *p=0.0217). (G) Experimental layout of mice injected orthotopically in the pancreas with PDX treated with Nexinhib20 (20 mg/kg) or DMSO (5%) two times per week. Treatment was started 7.5 weeks post-tumour implantation, and mice were sacrificed 4 weeks late, at 11.5 weeks post-tumour implantation. (H) Tumour growth curve of PDX pancreas orthotopic tumours measured by ultrasound treated with Nexinhib20 (n=6) or DMSO 5% (n=6) and representative photos of tumours at the time of euthanasia (two-way ANOVA; **p<0.01, ****p<0.0001). Arrows depict timepoints where treatment was started (7.5 weeks). Scale bar: 10 mm. Data are mean±SEM. ANOVA, analysis of variance; EVs, extracellular vesicles; EVNet, Extracellular Vesicles from Pancreatic Cancer Stem Cells Lead an Intratumor Communication Network; GEMM, genetically engineered mouse model; PDAC, pancreatic ductal adenocarcinoma; PDX, patient-derived xenograft; TRE, tetracycline response element.
Figure 4
Figure 4
Impairment of communication by EVs originated in CSC is sufficient to hamper tumour growth in PDAC orthotopic, GEMM and PDX models. (A) Experimental plan to impair specific routes of communication mediated by EVs in a PDAC orthotopic model using the MIA PaCa-2 Tet-On system. (B) Kaplan-Meier curve representing weeks to tumour detection of mice with CSC proficient (CSC Tet-On shRab27a control n=8) and CSC impaired EV secretion (CSC Tet-On shRab27a doxycycline n=8; paired t-test; *p<0.05). (C) Tumour growth curve measured by ultrasound of mice with CSC proficient (CSC Tet-On shRab27a control n=8) and impaired EV secretion (CSC Tet-On shRab27a doxycycline n=8; two-way analysis of variance; **p<0.01). (D) Tumour weight of groups described in (B, C). On the right, representative photos of tumours at time of euthanasia and respective H&Es (bottom, Wilcoxon test; **p<0.01). Scale bar: 10 mm. (E) Experimental layout to impair communication by CSC using a PDAC GEMM. Of note, as shown before (online supplemental figure 1D), the subpopulation positive for EpCAM (EpCAM+) was identified in the KPC and included in the NSCC. (F) Kaplan-Meier curve of the overall survival of mice with proficient CSC EV secretion (CSC were sorted from tumours of non-treated KPC iRab27aFrt/Frt mice, control n=7) and CSC with impaired EV secretion (CSC were sorted from tamoxifen-treated KPC iRab27aFrt/Frt mice, tamoxifen n=5, log-rank Mantel-Cox test; *p=0.0278). (G) Representative H&E staining of tumours in control and tamoxifen groups. (H) Experimental layout to impair communication by CSC EVs in a PDX model. (I) Tumour incidence in CSC proficient in EV secretion (CSC sorted from PDX tumour, treated ex vivo with DMSO 5% and injected with their NSCC counterparts), and CSC impaired EVs secretion (CSC were sorted from PDX tumour and treated ex vivo with Nexinhib20 (1 µM) before injection with their NSCC counterparts). DMSO 5% n=6, Nexinhib20 n=5 (Fisher’s exact test *p=0.0152). (J) Tumour volume and representative photos of tumours at time of euthanasia and respective H&ES of groups of mice described in (H, I). DMSO 5% n=6, Nexinhib20 n=5 (permutation test, *p=0.0123). Scale bar: 10 mm. (K) Representative flow cytometry analysis of viable cancer cells derived from PDX cells non-treated, DMSO 5% treated or treated with Nexinhib20 ex-vivo. Data are mean±SEM. CSC, cancer stem cell; EVs, extracellular vesicles; GEMM, genetically engineered mouse model; NSCC, non-stem cancer cell; PDAC, pancreatic ductal adenocarcinoma; PDX, patient-derived xenograft.
Figure 5
Figure 5
Agrin is enriched in CSC EVs. (A) Experimental approach to perform LC/ESI–MS/MS in subpopulations of cells and respective EVs (CD24+CD44+, CD133+, CD24CD44+, 4N and EpCAM+) in four human PDAC cell lines (BxPC3, PANC-1, T3M4 and MIA PaCa-2) for a total of 38 samples (MIA PaCa-2 cells are EpCAM). (B) Heatmap depicting protein clusters present in PDAC subpopulations and respective EVs in four cell lines. Dendogram displays unsupervised hierarchical clustering showing separation of three protein clusters: EVs, cells and cells+EVs. The full heatmap is shown in online supplemental figure 7D. (C) Functional enrichment analysis of protein clusters. Dot plot representing the top 6 reactome-enriched pathways per cluster (adjusted p value <0.05).Gene ratio corresponds to the relative size of every pathway in each protein cluster. (D) Venn diagram of total proteins detected in CSC and NSCC EVs isolated from four PDAC cell lines. Edges represent the number of proteins detected only in CSC or NSCC EVs, and intersection represents the number of proteins common to both subpopulations. (E) Top 5 enriched reactome pathways in CSC, NSCC and in both subpopulations of EVs (adjusted p value <0.05). (F) Gene set enrichment analysis demonstrates that proteins in the axon guidance pathway separate CSC EVs from NSCC EVs. (G) Venn diagram depicting the intersection of the proteins found in CSC EVs across the four PDAC cell lines. Out of the 233 proteins common across all CSC EVs, 79 correspond to proteins of the axon guidance pathway. Out of these, 14 were present in CSC EVs across all four cell lines. These 14 were ranked by average DESeq2 normalised peptide counts (table on the right). (H) FACS analysis and representative histogram plots of agrin-positive EVs derived from MIA PaCa-2 NSCC and CSC subpopulations (n=4, Mann-Whitney test, *p<0.05). Data are mean±SEM. CSC, cancer stem cells; EVs, extracellular vesicles; GTP, Guanosine-5'-triphosphate; HSC, hematopoietic stem cells; IGFBP, Insulin-like growth factor binding protein; LC/ESI–MS/MS, liquid chromatography–electrospray ionisation–tandem mass spectrometry; NSCC, non-stem cancer cell; PDAC, pancreatic ductal adenocarcinoma; PKN, protein kinase N; RHO, ras homologous; ROBO, roundabout guidance receptor; SLIT, slit guidance ligand; SRP, signal recognition particle.
Figure 6
Figure 6
Agrin-positive CSC EVs promote YAP nuclear location. (A) Experimental layout (top, left): CSC and NSCC were sorted from MIA PaCa-2 Tet-On shRab27a or shScramble, respectively, and cultured at the same proportions found in parental cells in order to assess YAP activity in these conditions. Representative confocal microscopy pictures of CSC from MIA PaCa-2 Tet-On shRab27a cultured with NSCC from MIA PaCa-2 Tet-On shScramble (cultured at the same percentages found in the MIA PaCa-2 Tet-On shRab27a). Active YAP (green), phalloidin (red) and nuclei (blue) (right). Quantification of YAP nuclear levels (mean intensity per cell) (n=1, six images per group, unpaired t-test; **p<0.01) (bottom, left). Data are min to max. Scale bar: 10µm. Dashed lines in violin plot represent median values. (B) Experimental layout (top, left): in order to assess the role of agrin in CSC EVs, a doxycycline-inducible (Tet-Off) shRNA against agrin was transfected into MIA PaCa-2 cells. CSC were sorted from Tet-Off shAgrin MIA PaCa-2 cells and cultured at the same proportions found in parental cells with MIA PaCa-2 Tet-Off ShScramble NSCC. Representative confocal microscopy pictures of CSC from MIA PaCa-2 Tet-Off shAgrin cultured with NSCC from MIA PaCa-2 Tet-Off shScramble (cultured at the same percentages found in the MIA PaCa-2 -Tet-Off shAgrin). Active YAP (green), phalloidin (red) and nuclei (blue) (right). Graph depicts quantification of YAP nuclear levels (mean intensity per cell; n=2, six images per group, unpaired t-test; ****p<0.0001) (bottom, left). Data are min to max. Scale bar: 10 µm. Dashed lines in violin plots represent median values. (C) Representative immunohistochemistry photos and quantification of per cent nuclear YAP-positive epithelial cells in MIA PaCa-2 Tet-On shRab27a tumors. Control n=7, doxycycline n=8 (unpaired t-test, **p<0,01). Data are mean±SEM. (D) Representative immunofluorescence of LRP-4 (purple) in MIA PaCa-2 NSCC treated with CSC EVs isolated from MIA PaCa-2 CD63-turboGFP. Representative orthogonal view YZ (middle panel). Arrows identify colocalisation between CD63-turboGFP CSC EVs and LRP-4. Scale bars 10µm. (E) Fold change of AREG, CXCL5, STAT3, CYR61, ALX and VIM gene expression in MIA PaCa-2 NSCC transfected with siSCR and treated with CSC EVs (red), MIA PaCa-2 NSCC transfected with siLRP-4 (grey) and MIA PaCa-2 NSCC transfected with siLRP-4 and treated with CSC EVs (blue) in comparison with NSCC transfected with siSCR (baseline, 1) analysed by qPCR. AREG CT levels were undetermined in MIA PaCa-2 NSCC transfected with siLRP-4 condition. β-actin was used as endogenous control for comparative CT method. CSC EV treatment (10 µg) was performed 72 hours after transfection with siRNA, and gene expression was evaluated 24 hours after treatment. (F) Cell viability measured by absorbance at 570nm (MTT assay) at days 1, 4 and 6 after the beginning of the experiment in MIA PaCa-2 NSCC (dark blue), NSCC treated with CSC EVs (light blue), NSCC treated with DMSO and CSC EVs (light red) and NSCC treated with verteporfin and CSC EVs (dark red). DMSO and verteporfin (10 µg/mL) treatments were performed at days 1 and 4. CSC EVs treatments (1 µg) were performed at days 1 and 4 two-way ANOVA; *p<0.05, ****p<0.0001. CSC, cancer stem cells; DAPI,4′,6-diamidino-2-phenylindole; EVs, extracellular vesicles; NSCC, non-stem cancer cells. rtTA, reverse tetracycline-controlled transactivator; VIM, vimentin.
Figure 7
Figure 7
Agrin in CSC promotes PDAC progression and blocking agrin in PDX cells impairs their proliferation. (A) Experimental layout: to impair agrin expression in specific cancer cell subpopulations, CSC and NSCC were sorted from the MIA PaCa-2 Tet-Off shAgrin and shScramble clones, respectively, and then orthotopically implanted into the pancreas of Rag2−/−Il2rg−/− mice. (B) Tumour growth curve measured by ultrasound of untreated (agrin kD) tumours CSC from MIA PaCa-2 Tet-Off shAgrin plus NSCC from MIA PaCa-2 Tet-Off shScramble (injected at the same percentages found in the cells of origin, n=7) and NSCC from MIA PaCa-2 Tet-Off shAgrin with CSC from MIA PaCa-2 Tet-Off shScramble (injected at the same percentages found in the cells of origin, n=6, two-way ANOVA; *p<0.05). (C) Quantification of tumour volume at euthanasia and representative photos of pancreas tumours (Mann-Whitney test, *p<0.05). Scale bar: 10 mm. (D) Histological evaluation of the percentage of the pancreas that showed no histological disease, PanINs and PDAC area in KPC and KPAC mice euthanised at 14 weeks of age and corresponding H&E pictures (KPC n=6, KPAC n=5). (E) YAP H-score and representative immunohistochemistry photos in KPC and KPAC (KPC n=6, KPAC n=5) (Mann-Whitney test,**p<0.01). (F) Schematic representation of PDX ex vivo treatment with human antiagrin neutralising antibody. Cell viability was measured by absorbance at 560 nm (MTT assay). PDX cells were treated ex vivo either from day 0 to day 8, every day (patient 1), or from day 0 to day 11, every day (patient 2), with antiagrin blocking antibody (Mab5204 10 μg/mL), IgG (10 μg/mL) or untreated (control). Comparison was performed with PDX ex vivo treated with IgG (two-way ANOVA; *p<0.05, ***p<0.001, ****p<0.0001). Arrow indicates timepoint that treatment was stopped in patient 1. (G) Quantification of YAP nuclear levels in PDX cells treated ex vivo from day 0 until day 5, every day, with antiagrin blocking antibody (Mab5204 10 μg/mL) or IgG (10 μg/mL) (top) (mean intensity per cell, n=1, six images per group, unpaired t-test; ****p<0.0001). Data are min to max. Dashed lines in violin plots represent median values. Representative confocal microscopy photos of treated PDX cells. Scale bar: 20 µm. Active YAP (green), phalloidin (red) and nuclei (blue) (bottom). Data are mean±SEM. ANOVA, analysis of variance; KD, knockdown; KPAC, agrin knockout KPC; CSC, cancer stem cells; EVs, extracellular vesicles; FACS, fluorescence activated cell sorting; MTT, methylthiazolyldiphenyl–tetrazolium bromide; NSCC, non-stem cancer cell; PDAC, pancreatic ductal adenocarcinoma; PDX, patient-derived xenograft.
Figure 8
Figure 8
Circulating agrin-positive EVs are a biomarker of disease progression and predict response to treatment in patients with PDAC. (A) Presurgery and postsurgery analysis of the percentage of circulating agrin-positive EVs coupled to beads in the serum of PDAC patients (n=19, paired t-test; *p<0.05). (B, C) Prechemotherapy and postchemotherapy analyses of the percentage of circulating agrin-positive EVs coupled to beads in the serum of patients with PDAC treated with all regimens (B) (n=24, paired t-test; *p<0.05) and folfirinox-based regimens (C) (n=13, paired t-test; **p<0.01). (D) Correlation between the percentage of circulating CD133-positive EVs coupled to beads and the log10 of the percentage of agrin-positive EVs coupled to beads in the serum of patients with PDAC (n=106, Spearman r=0.6272). (E) Analysis of the percentage of circulating agrin-positive EVs coupled to beads in the serum of three patients with PDAC throughout time. QRT, chemotherapy, ŦAborted surgery due to non-resectable tumour. (F) Receiver operating curve analysis for the percentage of agrin-positive (red), CD133-positive (blue), and combination of agrin-positive and CD133-positive (purple) EVs coupled to beads and CA19-9 (green) in the serum of patients with PDAC not submitted to surgery (n=22 in circulating agrin-positive and CD133-positive EVs coupled to beads analysis and n=20 in CA19-9 analysis). (G) Receiver operating curve analysis for the percentage of agrin-positive (red), CD133-positive (blue), and combination of agrin-positive and CD133-positive (purple) EVs coupled to beads and CA19-9 (green) in the serum of patients with PDAC not submitted to surgery and treated with chemotherapy (n=17). In tables: a means under the non-parametric assumption and b means null hypothesis: true area=0.5. EVs, extracellular vesicles; PDAC, pancreatic ductal adenocarcinoma.
Figure 9
Figure 9
Schematic of the intercellular communication mediated by EVs between subpopulations of pancreatic cancer cells, the EVNet and the role of CSC agrin-positive EVs in PDAC. Our work demonstrates that subpopulations of PDAC cells establish an organised and plastic communication network, the EVNet, in which the preferential communication route is from CSC to NSCC, by means of CSC agrin-enriched EVs. Specific inhibition of this route is sufficient to impair the growth of PDAC tumours in orthotopic, GEMM and PDX models. In PDAC human samples, we have confirmed that cAGRN+EVs are a prognostic biomarker for disease progression and are associated with therapy response. CSC, cancer stem cell; EVs, extracellular vesicles; EVNet, Extracellular Vesicles from Pancreatic Cancer Stem Cells Lead an Intratumor Communication Network; GEMM, genetically engineered mouse model; PDAC, pancreatic ductal adenocarcinoma; PDX, patient-derived xenograft.

References

    1. Bernard V, Semaan A, Huang J, et al. . Single-Cell transcriptomics of pancreatic cancer precursors demonstrates epithelial and microenvironmental heterogeneity as an early event in neoplastic progression. Clin Cancer Res 2019;25:2194–205. 10.1158/1078-0432.CCR-18-1955 - DOI - PMC - PubMed
    1. Li C, Heidt DG, Dalerba P, et al. . Identification of pancreatic cancer stem cells. Cancer Res 2007;67:1030–7. 10.1158/0008-5472.CAN-06-2030 - DOI - PubMed
    1. Hermann PC, Huber SL, Herrler T, et al. . Distinct populations of cancer stem cells determine tumor growth and metastatic activity in human pancreatic cancer. Cell Stem Cell 2007;1:313–23. 10.1016/j.stem.2007.06.002 - DOI - PubMed
    1. Ikenaga N, Ohuchida K, Mizumoto K, et al. . Characterization of CD24 expression in intraductal papillary mucinous neoplasms and ductal carcinoma of the pancreas. Hum Pathol 2010;41:1466–74. 10.1016/j.humpath.2010.04.004 - DOI - PubMed
    1. Hou Y-C, Chao Y-J, Tung H-L, et al. . Coexpression of CD44-positive/CD133-positive cancer stem cells and CD204-positive tumor-associated macrophages is a predictor of survival in pancreatic ductal adenocarcinoma. Cancer 2014;120:2766–77. 10.1002/cncr.28774 - DOI - PMC - PubMed