. 2022 Mar 1;10(3):303-313.
doi: 10.1158/2326-6066.CIR-21-1083.

Tumor MHC Class I Expression Associates with Intralesional IL2 Response in Melanoma

Affiliations

Tumor MHC Class I Expression Associates with Intralesional IL2 Response in Melanoma

Maryam Pourmaleki et al. Cancer Immunol Res. .

Abstract

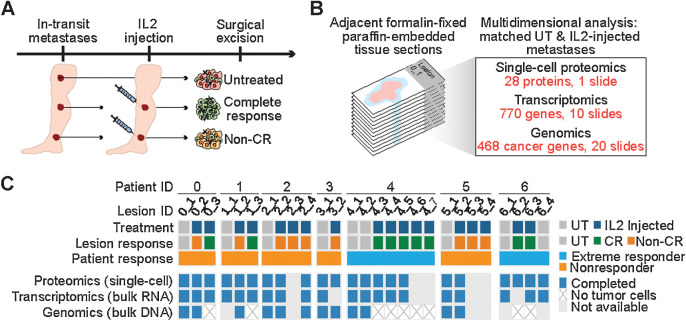
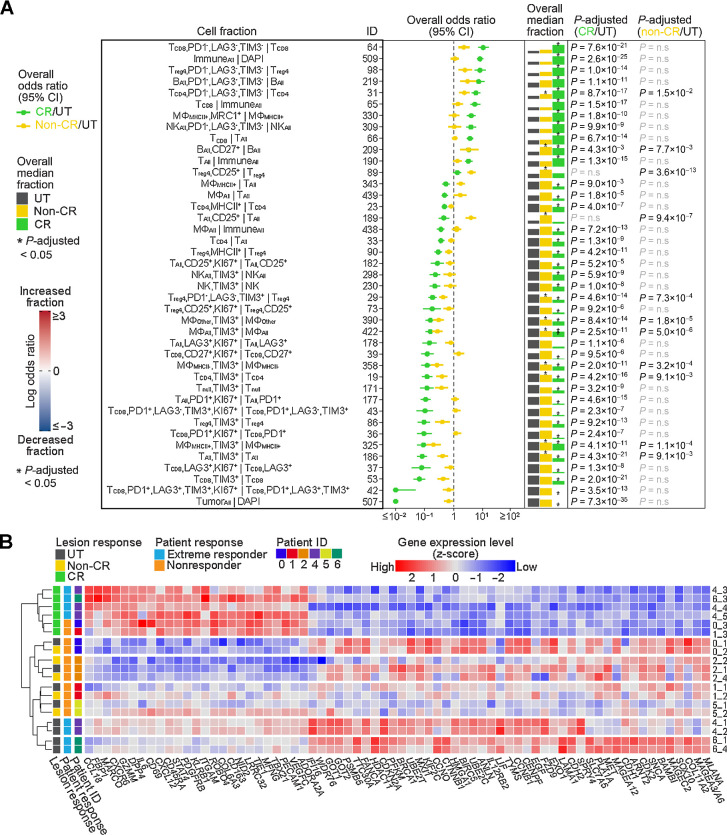
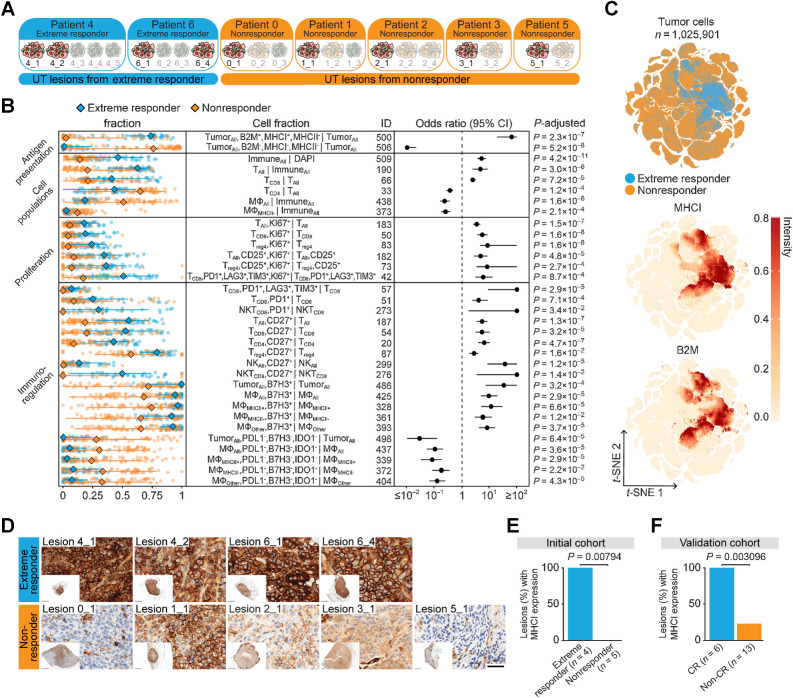
Cancer immunotherapy can result in lasting tumor regression, but predictive biomarkers of treatment response remain ill-defined. Here, we performed single-cell proteomics, transcriptomics, and genomics on matched untreated and IL2 injected metastases from patients with melanoma. Lesions that completely regressed following intralesional IL2 harbored increased fractions and densities of nonproliferating CD8+ T cells lacking expression of PD-1, LAG-3, and TIM-3 (PD-1-LAG-3-TIM-3-). Untreated lesions from patients who subsequently responded with complete eradication of all tumor cells in all injected lesions (individuals referred to herein as "extreme responders") were characterized by proliferating CD8+ T cells with an exhausted phenotype (PD-1+LAG-3+TIM-3+), stromal B-cell aggregates, and expression of IFNγ and IL2 response genes. Loss of membranous MHC class I expression in tumor cells of untreated lesions was associated with resistance to IL2 therapy. We validated this finding in an independent cohort of metastatic melanoma patients treated with intralesional or systemic IL2. Our study suggests that intact tumor-cell antigen presentation is required for melanoma response to IL2 and describes a multidimensional and spatial approach to develop immuno-oncology biomarker hypotheses using routinely collected clinical biospecimens.


Figures

Figure 1. Multidimensional assessment of in-transit melanoma metastases treated with intralesional IL2. A, Study design. Multiple cutaneous in-transit metastases were excised from each melanoma patient, including at least one untreated (UT) and one IL2-injected lesion. Treatment response for IL2-injected lesions was classified as complete response or non-CR. B, Allocation of consecutive tumor tissue sections for molecular analyses. C, Summary of molecular analyses completed for each lesion. “Nonresponder” refers to all non-/mixed responder patients.
Figure 1.
Multidimensional assessment of in-transit melanoma metastases treated with intralesional IL2. A, Study design. Multiple cutaneous in-transit metastases were excised from each melanoma patient, including at least one untreated (UT) and one IL2-injected lesion. Treatment response for IL2-injected lesions was classified as complete response or non-CR. B, Allocation of consecutive tumor tissue sections for molecular analyses. C, Summary of molecular analyses completed for each lesion. “Nonresponder” refers to all non-/mixed responder patients.
Figure 2. Immune-cell states and gene-expression signatures following tumor-cell eradication by IL2. A, Shown are cell fractions (rows) with significant changes following IL2 injection. The forest plot shows the overall effect size (odds ratio) and 95% confidence interval (CI) of each cell fraction across all patients for CR (n = 101 FOV) versus untreated (n = 112 FOVs) and non-CR (n = 120 FOVs) versus untreated. The overall median fraction, scaled to 1 for the largest fraction, is shown for untreated, non-CR, and CR lesions. Significant results, determined using a two-sided Wilcoxon test adjusted by Bonferroni correction, are indicated with an asterisk above the median fraction with P-adjusted noted (n.s., not significant). See also Supplementary Table S6. See Supplementary Table S3 for full cell type names. B, The heatmap indicates scaled RNA expression values for differentially expressed genes (P-adjusted < 0.0001) in CR (n = 6) versus untreated (n = 9) and/or non-CR (n = 5) versus untreated, sorted by CR versus untreated fold change. See also Supplementary Table S9.
Figure 2.
Immune-cell states and gene-expression signatures following tumor-cell eradication by IL2. A, Shown are cell fractions (rows) with significant changes following IL2 injection. The forest plot shows the overall effect size (odds ratio) and 95% confidence interval (CI) of each cell fraction across all patients for CR (n = 101 FOV) versus untreated (n = 112 FOVs) and non-CR (n = 120 FOVs) versus untreated. The overall median fraction, scaled to 1 for the largest fraction, is shown for untreated, non-CR, and CR lesions. Significant results, determined using a two-sided Wilcoxon test adjusted by Bonferroni correction, are indicated with an asterisk above the median fraction with P-adjusted noted (n.s., not significant). See also Supplementary Table S6. See Supplementary Table S3 for full cell type names. B, The heatmap indicates scaled RNA expression values for differentially expressed genes (P-adjusted < 0.0001) in CR (n = 6) versus untreated (n = 9) and/or non-CR (n = 5) versus untreated, sorted by CR versus untreated fold change. See also Supplementary Table S9.
Figure 3. Pretreatment tumor MHC I expression is associated with complete tumor response to IL2. A, Grouping of untreated (UT) lesions from extreme responder and non-/mixed responder patients (labeled “non-responder” throughout figures). B, Shown are cell fractions (rows) with significant differences in untreated lesions from extreme responders (n = 38 FOV) versus non-/mixed responders (n = 74 FOVs). Left, fractions in each FOV, with overall median, minimum, and maximum (each point represents an FOV). The forest plot shows effect size (odds ratio) and 95% CI of each cell fraction with P-adjusted noted (two-sided Wilcoxon test adjusted by Bonferroni correction). See also Supplementary Table S10. See Supplementary Table S3 for full cell type names. C, t-SNE of untreated lesion tumor cells colored by patient response and normalized intensity of MHC I and B2M. D, MHC I IHC of untreated lesions (scale bar, 50 μm). E and F, Bar graphs showing the percentage of untreated lesions with expression of membranous MHC I in greater than 75% of tumor cells in the initial cohort (E; extreme responder, n = 4; nonresponder, n = 5) and in the validation cohort (F; CR, complete responder, n = 6; non-CR, noncomplete responder, n = 13) based on IHC staining (Fisher exact test, two-sided, exact P value noted).
Figure 3.
Pretreatment tumor MHC I expression is associated with complete tumor response to IL2. A, Grouping of untreated (UT) lesions from extreme responder and non-/mixed responder patients (labeled “non-responder” throughout figures). B, Shown are cell fractions (rows) with significant differences in untreated lesions from extreme responders (n = 38 FOV) versus non-/mixed responders (n = 74 FOVs). Left, fractions in each FOV, with overall median, minimum, and maximum (each point represents an FOV). The forest plot shows effect size (odds ratio) and 95% CI of each cell fraction with P-adjusted noted (two-sided Wilcoxon test adjusted by Bonferroni correction). See also Supplementary Table S10. See Supplementary Table S3 for full cell type names. C,t-SNE of untreated lesion tumor cells colored by patient response and normalized intensity of MHC I and B2M. D, MHC I IHC of untreated lesions (scale bar, 50 μm). E and F, Bar graphs showing the percentage of untreated lesions with expression of membranous MHC I in greater than 75% of tumor cells in the initial cohort (E; extreme responder, n = 4; nonresponder, n = 5) and in the validation cohort (F; CR, complete responder, n = 6; non-CR, noncomplete responder, n = 13) based on IHC staining (Fisher exact test, two-sided, exact P value noted).
Figure 4. Activated tumor microenvironment prior to IL2 treatment characterizes extreme responders. A, The heatmap indicates scaled RNA expression values for differentially expressed genes (P-adjusted < 0.05) in untreated lesions from extreme responders (n = 4) versus non-/mixed responders (labeled “non-responder” throughout figures; n = 5), sorted by fold change. See also Supplementary Table S15. B, Schematic of tumor interface analysis. mIF, multiplexed IF. C, Box plots showing B-cell density in tumor and stroma of untreated lesions (minimum, median, and maximum with each point representing an FOV). Significant results, determined using a two-sided Wilcoxon test adjusted by Bonferroni correction, are indicated with an asterisk (P-adjusted<0.05). See also Supplementary Table S17. D, Total B-cell aggregate counts in untreated lesions. E, Total count of B cells per aggregate (Wilcoxon rank sum test, exact P value noted) in untreated lesions [extreme responder (n = 10) and nonresponder (n = 4)]. F, Representative multiplexed IF images from an untreated lesion of an extreme responder (6_4) and non-/mixed responder (1_1) showing B-cell aggregates. G, Cartoon of CD8+ T-cell states. H, Mean density of CD8+ T cells expressing all combinations of PD-1/TIM-3/LAG-3 in untreated lesions in 10-μm intervals from −360:360 μm. See also Supplementary Table S18. I, Box plots showing density of CD8+ T cells expressing all combinations of PD-1/TIM-3/LAG-3 in tumor and stroma of untreated lesions (minimum, median, and maximum with each point representing an FOV). See also Supplementary Table S18. J, CD8+ T-cell neighborhood definitions. The heatmap indicates effect size (odds ratio) of each cell fraction (rows) in untreated lesions for SP/DP/TP neighborhoods normalized against TN neighborhoods. See also Supplementary Table S19.
Figure 4.
Activated tumor microenvironment prior to IL2 treatment characterizes extreme responders. A, The heatmap indicates scaled RNA expression values for differentially expressed genes (P-adjusted < 0.05) in untreated lesions from extreme responders (n = 4) versus non-/mixed responders (labeled “non-responder” throughout figures; n = 5), sorted by fold change. See also Supplementary Table S15. B, Schematic of tumor interface analysis. mIF, multiplexed IF. C, Box plots showing B-cell density in tumor and stroma of untreated lesions (minimum, median, and maximum with each point representing an FOV). Significant results, determined using a two-sided Wilcoxon test adjusted by Bonferroni correction, are indicated with an asterisk (P-adjusted<0.05). See also Supplementary Table S17. D, Total B-cell aggregate counts in untreated lesions. E, Total count of B cells per aggregate (Wilcoxon rank sum test, exact P value noted) in untreated lesions [extreme responder (n = 10) and nonresponder (n = 4)]. F, Representative multiplexed IF images from an untreated lesion of an extreme responder (6_4) and non-/mixed responder (1_1) showing B-cell aggregates. G, Cartoon of CD8+ T-cell states. H, Mean density of CD8+ T cells expressing all combinations of PD-1/TIM-3/LAG-3 in untreated lesions in 10-μm intervals from −360:360 μm. See also Supplementary Table S18. I, Box plots showing density of CD8+ T cells expressing all combinations of PD-1/TIM-3/LAG-3 in tumor and stroma of untreated lesions (minimum, median, and maximum with each point representing an FOV). See also Supplementary Table S18. J, CD8+ T-cell neighborhood definitions. The heatmap indicates effect size (odds ratio) of each cell fraction (rows) in untreated lesions for SP/DP/TP neighborhoods normalized against TN neighborhoods. See also Supplementary Table S19.

References

    1. Meier F, Will S, Ellwanger U, Schlagenhauff B, Schittek B, Rassner G, et al. . Metastatic pathways and time courses in the orderly progression of cutaneous melanoma. Br J Dermatol 2002;147:62–70. - PubMed
    1. Coit DG, Thompson JA, Algazi A, Andtbacka R, Bichakjian CK, Carson WE, et al. . Melanoma, version 2.2016, NCCN clinical practice guidelines in oncology. J Natl Compr Cancer Netw 2016;14:450–73. - PubMed
    1. Byers BA, Temple-Oberle CF, Hurdle V, McKinnon JG. Treatment of in-transit melanoma with intra-lesional interleukin-2: a systematic review. J Surg Oncol 2014;110:770–5. - PubMed
    1. Mullard A. Restoring IL-2 to its cancer immunotherapy glory. Nat Rev Drug Discov 2021;20:163–5. - PubMed
    1. Read T, Lonne M, Sparks DS, David M, Wagels M, Schaider H, et al. . A systematic review and meta-analysis of locoregional treatments for in-transit melanoma. J Surg Oncol 2019;119:887–96. - PubMed

Publication types

MeSH terms

Substances