. 2022 Jan 10;13(1):141.
doi: 10.1038/s41467-021-27322-4.

Single-cell analysis of human primary prostate cancer reveals the heterogeneity of tumor-associated epithelial cell states

Affiliations

Single-cell analysis of human primary prostate cancer reveals the heterogeneity of tumor-associated epithelial cell states

Hanbing Song et al. Nat Commun. .

Abstract

Prostate cancer is the second most common malignancy in men worldwide and consists of a mixture of tumor and non-tumor cell types. To characterize the prostate cancer tumor microenvironment, we perform single-cell RNA-sequencing on prostate biopsies, prostatectomy specimens, and patient-derived organoids from localized prostate cancer patients. We uncover heterogeneous cellular states in prostate epithelial cells marked by high androgen signaling states that are enriched in prostate cancer and identify a population of tumor-associated club cells that may be associated with prostate carcinogenesis. ERG-negative tumor cells, compared to ERG-positive cells, demonstrate shared heterogeneity with surrounding luminal epithelial cells and appear to give rise to common tumor microenvironment responses. Finally, we show that prostate epithelial organoids harbor tumor-associated epithelial cell states and are enriched with distinct cell types and states from their parent tissues. Our results provide diagnostically relevant insights and advance our understanding of the cellular states associated with prostate carcinogenesis.


Conflict of interest statement

A.K.S. reports compensation for consulting and/or SAB membership from Merck, Honeycomb Biotechnologies, Cellarity, Hovione, Repertoire Immune Medicines, Ochre Bio, Third Rock Ventures, Relation Therapeutics, and Dahlia Biosciences. F.Y.F. reports compensation for consulting and/or SAB membership from Astellas, Bayer, Blue Earth Diagnostics, Celgene, Genentech, Janssen Oncology, Myovant, Roivant, Sanofi, PFS Genomics, and SerImmune. The remaining authors declare no competing interests.

Figures
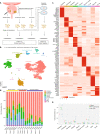
Fig. 1
Fig. 1. Prostate cancer (PCa) sample single-cell RNA-sequencing overview and identification of major cell types in localized prostate cancer.
a Single-cell RNA-sequencing workflow on PCa biopsies, radical prostatectomy (RP) specimens, and in vitro organoid cultures grown from RP tumor specimens using the Seq-Well platform. b Overview of major cell types identified within the combined dataset consisting of 21,743 cells from all biopsies (N = 6) and RP specimens (N = 12). Cell types are labeled in colors from corresponding clusters in the Uniform Manifold Approximation and Projection (UMAP). c Heatmap for the top ten differentially expressed genes in each cell type. d Cell-type composition stacked bar chart by sample. Cell counts for each sample are normalized to 100%. Sample type is annotated (top) and patients are labeled below the x axis. e Cell composition comparison for each cell type among three sample types: biopsy patients (N = 3), RP tumor specimens (N = 8), and RP paired normal tissues (N = 4). Each sample type is represented by a different color. Source data are provided as a Source Data file.
Fig. 2
Fig. 2. Identification of tumor cells and major epithelial cell types, including club cells.
a UMAP projection of all 20 clusters identified in the epithelial cells. Clusters are labeled in the UMAP. b Violin plots of representative marker genes across the clusters. c UMAP of epithelial cells annotated by cell types. d Heatmap of the top ten differentially expressed genes in each cell type (BE: basal epithelial cells; Other: other epithelial cells; Non-malignant LE: non-malignant luminal epithelial cells; ERG + Tumor: ERG + tumor cells; ERG− Tumor: ERG− tumor cells). e Club cell signature scores of each epithelial cell projected on the UMAP and signature score violin plots across all clusters. f Box plots of club cell signature scores from normal club cells and lung club cells across epithelial cell types (N = 13,322 cells, ***P < 0.001, Wilcoxon rank-sum test; normal club cell signature: P < 2.2e-16; normal club cell signature: P < 2.2e-16). Center, bounds, and percentiles are shown in the box plot. Source data are provided as a Source Data file.
Fig. 3
Fig. 3. Identification of PCa-enriched club cell states with upregulated androgen response signature.
a UMAP of integrated club cells from PCa samples (Club PCa) and club cells from normal samples (Club Normal), color-coded by cell states with differential gene expression profiles (left) and sample type (right). b Violin plots of representative marker genes between the two types of club cells. c Heatmap for the top ten differentially expressed genes in each cell state. d Grouped bar chart comparison of six cell-state compositions between Club PCa and Club Normal. Significance levels are labeled (***P < 0.001, two-sided Fisher’s exact test; cluster 0: P = 7.21e-58; cluster 1: P = 3.11e-07; cluster 2: P = 2.72e-12; cluster 3: P = 1.05e-12; cluster 4: P = 7.36e-06; cluster 5: P = 1.20-e12). e Volcano plots of the overexpressed genes in Club cell cluster 0 and other cell states within the PCa samples. f Top 20 upregulated signaling pathways between Club cell cluster 0 and the other club cells on Hallmark gene-set collection (N = 50) within the PCa samples. Gene counts for the corresponding gene set are indicated by marker radius. Statistical significance levels (FDR) are shown by the color gradient. g Comparison of LE signature scores between Club cluster 0 and other club cells (***P = 2.33e-19, two-sided Wilcoxon rank-sum test), and between within the PCa samples. h Violin plot comparison between Club cluster 0, other club cells, and LE for multiple LE and club cell markers within the PCa samples. i Schematic marker of gene expression changes between Club Normal and Club PCa. Gene downregulation and upregulation in Club PCa compared to Club Normal are represented by red and green arrows. The proportion of Club cell cluster 0 within all club cells represented by the area in blue and characterized by its LE-like state and high-level expression of LTF and NKX3-1. Source data are provided as a Source Data file.
Fig. 4
Fig. 4. Integration of BE and LE cells identifies tumor-associated cell states enriched in the PCa samples.
a UMAP of integrated BE cells labeled by cell states (left) or samples type (BE PCa and BE Normal) (right). b Cell composition comparison between BE PCa and BE Normal (***P < 0.001, two-sided Fisher’s exact test; cluster 2: P = 1.24e-19; cluster 3: P = 2.00e-31; cluster 4: P = 9.31e-122; cluster 6: P < 2.2e-16). c PCa and normal enriched cell states 4 and 6 highlighted in the integrated BE UMAP. d Top 20 upregulated signaling pathways between cluster 6 and the other BE on C2 canonical gene set (C2CP) collection (N = 2,332). Gene counts for the corresponding gene set are indicated by marker radius. Statistical significance levels (FDR) are shown by the color gradient. Pathways associated with PCa tumor progression and invasiveness are highlighted in red. e Volcano plots of the overexpressed genes in BE cluster 6 and other BE cell states within the PCa samples. f Distribution of BE cluster 6, other BE and LE on the overall epithelial cell UMAP. g Violin plot comparison between BE cluster 6, other BE and LE for multiple LE and BE markers within the PCa samples. h Comparison of Hallmark AR pathway signature and LE signature scores within the PCa samples (***P < 0.001, Wilcoxon rank-sum test; Hallmark AR pathway signature: P = 2.10e-111; LE signature score: P = 2.95e-39). Source data are provided as a Source Data file.
Fig. 5
Fig. 5. Integration of PCa and normal epithelial cells reveals common AR signaling upregulation driven by PCa-enriched BE and club cell states.
a UMAP of integrated epithelial cells annotated by cell types and sample type (PCa and Normal), then separated by the origin (either previous normal epithelial cells or epithelial cells in the PCa samples). b Heatmaps of top 20 differentially expressed genes between PCa samples and normal prostates for adjacent cell types (left: BE PCa, BE Normal. Middle: Club Normal, Club PCa. Right: LE PCa, LE Normal). Commonly upregulated genes in the PCa samples are labeled in red, and commonly upregulated genes in the normal samples are labeled in green. c Top, AR expression percentages in all epithelial cell types within the integrated dataset. Significance levels are labeled in each comparison (***P < 0.001, two-sided Fisher’s exact test; BE: P = 1.49e-145; LE: P = 1.25e-184; Club: P = 1.61e-27). Bottom, Comparison of Hallmark AR pathway signature scores of each epithelial cell type. Significance levels are labeled for each common cell type (***P < 0.001, Wilcoxon rank-sum test; BE: P < 2.2e-16; LE: P = 4.21e-295; Club: P = 1.45e-253). d The association of AR signature with BE and club cell state. Each cell is labeled (gray: 0, not in the cell state; black: 1, in the cell state). Information coefficient accompanied P values and FDR q values are labeled next to each cell state. e The association of AR signature with BE and club cell-state signature scores in the TCGA datasets (N = 491). Information coefficient accompanied P values and FDR q values are labeled next to each cell state. Source data are provided as a Source Data file.
Fig. 6
Fig. 6. Comparison of ERG+ and ERG− tumor cells reveals patient-specific cell states and intra-patient heterogeneity.
a UMAP of ERG+ tumor cells labeled by clusters with differential gene expression profiles (top). Heatmap of the top ten differentially expressed genes for each cluster (bottom). b UMAP of ERG− tumor cells labeled by clusters with differential gene expression profiles (top). Heatmap of the top ten differentially expressed genes for each cluster (bottom). c Patient composition in each cluster for ERG+ tumor cells (top) and ERG− tumor cells (bottom). Cell counts in each cluster are normalized to 100%. d UMAP of ERG+ and ERG− tumor cells when integrated with non-malignant LE cells, respectively. e UMAP of ERG+ and ERG- tumor cells when integrated with non-malignant LE cells labeled by patients. f The association of TMPRSS2-ERG fusion status in the TCGA (N = 290) and SU2C (N = 266) datasets with ERG+ and ERG− tumor cell signature (red: TMPRSS2-ERG fusion detected; blue: TMPRSS2-ERG fusion not detected). Information coefficient, accompanied P values and FDR q values are labeled. g Visualization of the intersection amongst significant GSEA results for BE, LE, and club cells. The color intensity of the bars represents the P value significance of the intersections. Source data are provided as a Source Data file.
Fig. 7
Fig. 7. CD4 T-cell subsets associated with ERG status and common upregulation of PD-1 and interferon-gamma signaling in the ERG− tumor microenvironment.
a UMAP of T-cells labeled by different cell types (left) and ERG+ or ERG− patients (right). b Cell composition comparison between ERG+ and ERG− patients for all T-cell cell types. Significance levels are labeled in differentially enriched clusters (***P < 0.001, two-sided FET; CD4 T-cell cluster 1: P = 4.28e-13; CD4 T-cell cluster 2: P = 1.08e-27). c UMAP of stromal cells labeled by different cell types (left) and ERG+ or ERG− patients (right). d Cell composition comparison between ERG+ and ERG− patients for all stromal cell types (***P < 0.001; P = 1.15e-31, two-sided FET). Significance levels are labeled in differentially enriched clusters. e Visualization of the intersections amongst significantly upregulated (top) and downregulated (bottom) gene sets within C2CP gene-set collection for tumor cells, two clusters of differentially enriched CD4 T-cell clusters, and stromal cells. Significant Gene Set Enrichment Analysis (GSEA) results are represented by circle below bar chart with individual blocks showing “presence” (green) or “absence” (gray) of the gene sets in each intersection. P value significance of the intersections are represented by the color intensity of the bars. f GSEA results for the ERG- patient-enriched CD4 T-cell cluster compared to the ERG+ patient-enriched cluster on the common upregulated gene sets (N = 14). Gene counts for the corresponding gene set are indicated by marker radius. Statistical significance levels (FDR) are shown by color gradient. Reactome PD-1 and Interferon-gamma signaling pathways are highlighted in red. g Gene expression heatmaps of genes in the Reactome PD-1 and Interferon-gamma signaling pathways for tumor cells, CD4 T-cells and stromal cells in both ERG+ and ERG− patients. Source data are provided as a Source Data file.
Fig. 8
Fig. 8. In vitro organoid samples harbor PCa-enriched BE and club cell states.
a UMAP of cells from organoid samples labeled by different cell types. Organoid culture snapshots are depicted in the upper right panel. b Immunofluorescence staining for LE marker (KRT8), BE marker (KRT5) and club cell markers (SCGB1A1, LTF) of the organoid samples. Technical and biological replicates for four additional organoids reproduce the shown staining. Due to the limitation of organoid sizes and subsequently image quality, only one group of experimental results is shown. c UMAP of the integrated dataset of cells from the organoid samples and epithelial cells from matching parent tissue samples, labeled by cell types. d UMAP of the integrated dataset, labeled by sample types (tissue or organoid samples). e Heatmaps for the top 20 differentially expressed genes for BE and club cells between tumor tissues and organoid samples. f UMAP of integrated club cell dataset of tumor tissue and organoid samples. Cell composition comparison is shown in the grouped bar charts. g Dot plots of the top ten differentially expressed genes in clusters 3, 4, and 7 in tissue and organoid club cells. Dot size represents proportions of gene expression in cells and expression levels are shown by color shading (low to high reflected as light to dark). Source data are provided as a Source Data file.

Similar articles

Cited by

References

    1. Tiwari, R., Manzar, N. & Ateeq, B. Dynamics of cellular plasticity in prostate cancer progression. Front. Mol. Biosci. 7, 130 (2020). - PMC - PubMed
    1. Blau HM, et al. Plasticity of the differentiated state. Science. 1985;230:758–766. - PubMed
    1. Yuan S, Norgard RJ, Stanger BZ. Cellular plasticity in cancer. Cancer Discov. 2019;9:837–851. - PMC - PubMed
    1. Varga J, Greten FR. Cell plasticity in epithelial homeostasis and tumorigenesis. Nat. Cell Biol. 2017;19:1133–1141. - PubMed
    1. Boutros PC, et al. Spatial genomic heterogeneity within localized, multifocal prostate cancer. Nat. Genet. 2015;47:736–745. - PubMed

Publication types

MeSH terms