. 2022 Jan 10;13(1):17.
doi: 10.1038/s41467-021-27621-w.

The transcription factor ZIP-1 promotes resistance to intracellular infection in Caenorhabditis elegans

Affiliations

The transcription factor ZIP-1 promotes resistance to intracellular infection in Caenorhabditis elegans

Vladimir Lažetić et al. Nat Commun. .

Abstract

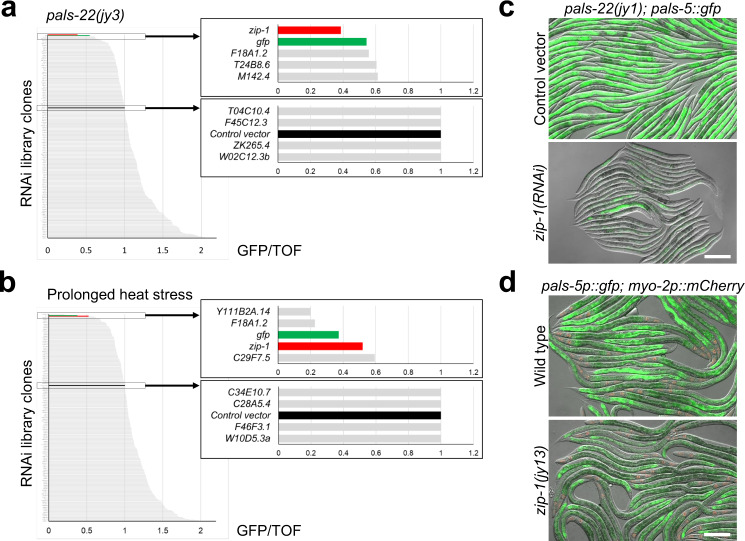
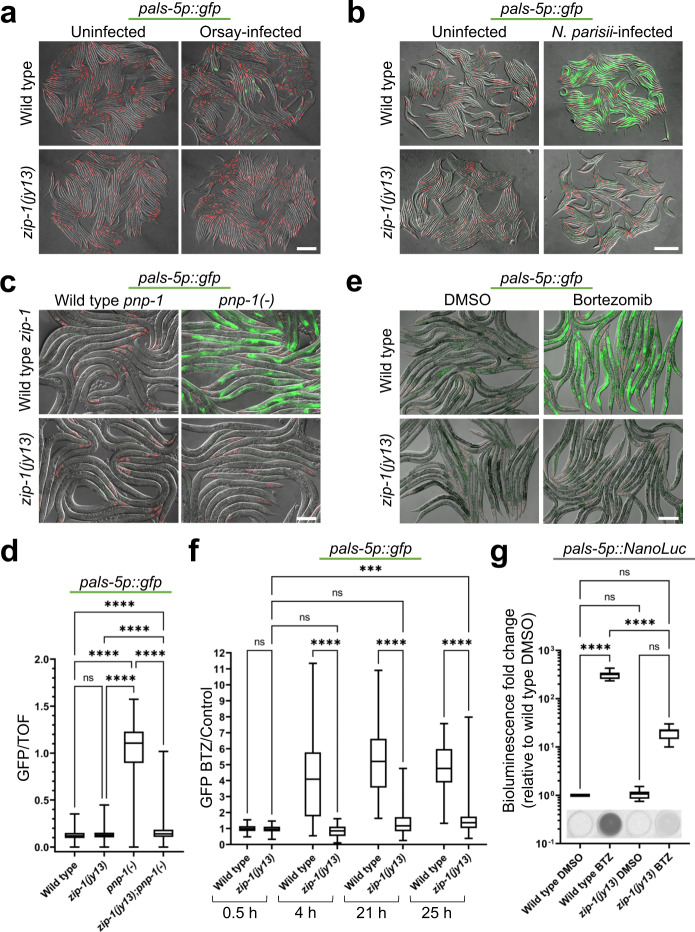
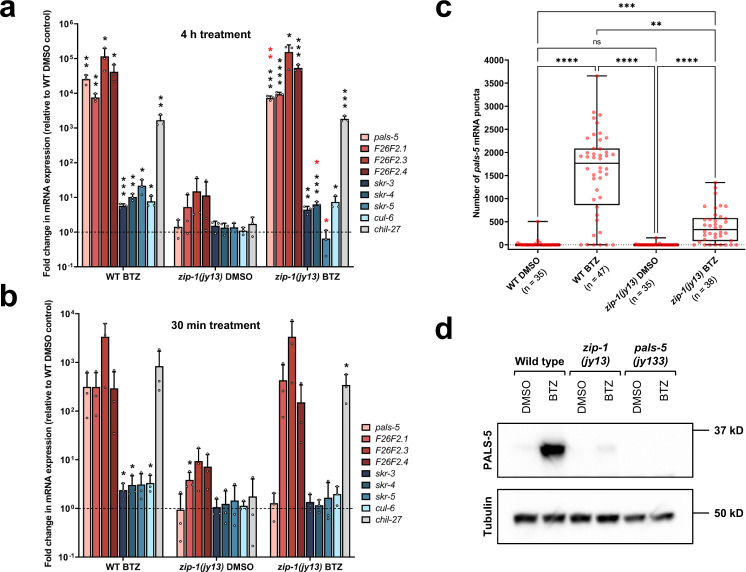
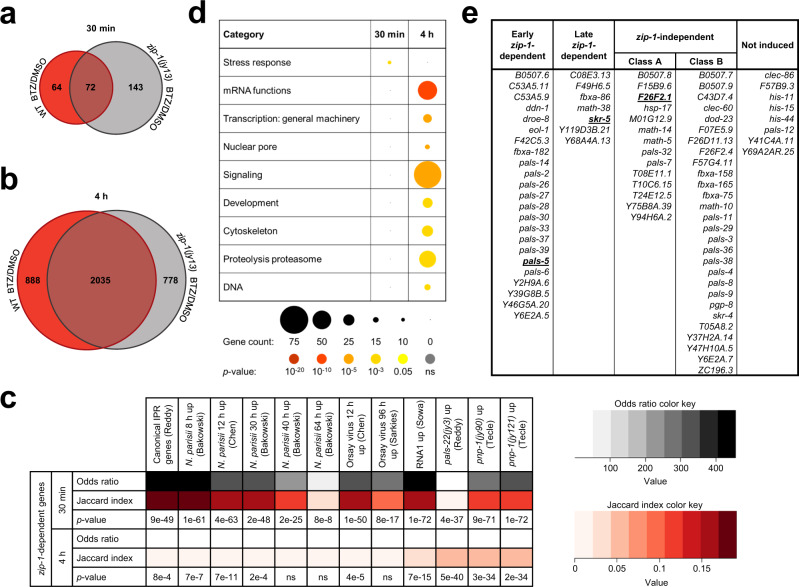
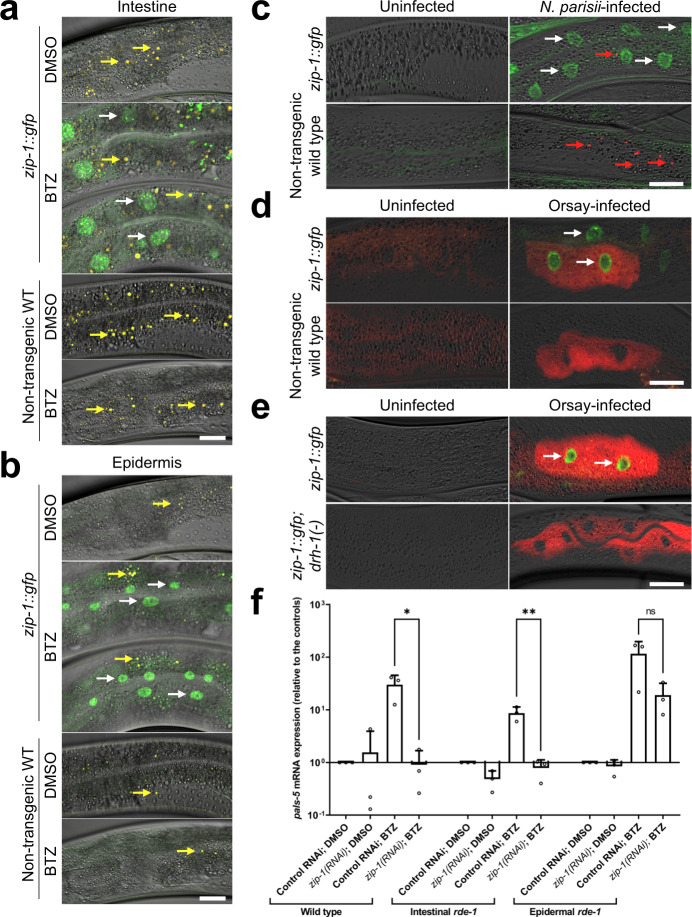
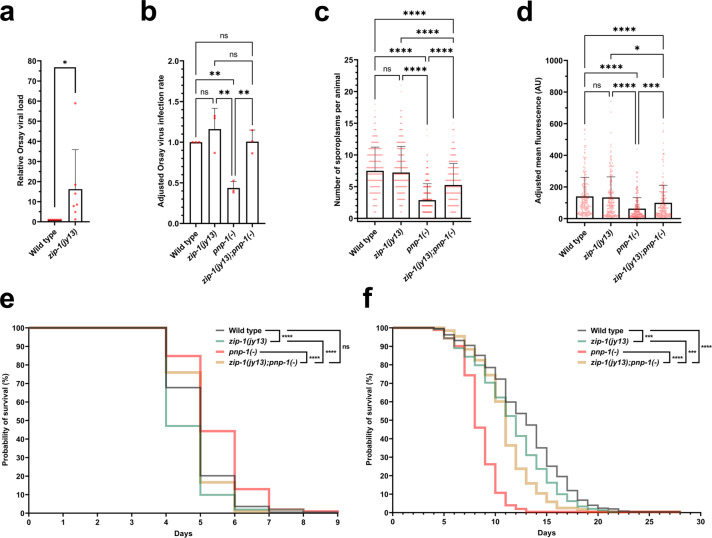
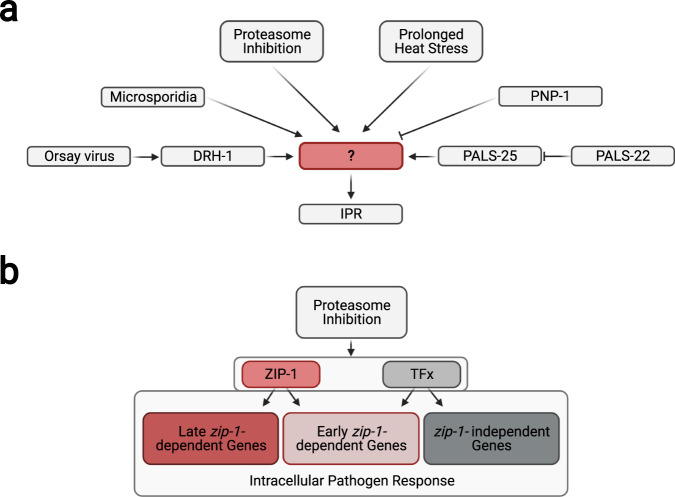
Defense against intracellular infection has been extensively studied in vertebrate hosts, but less is known about invertebrate hosts; specifically, the transcription factors that induce defense against intracellular intestinal infection in the model nematode Caenorhabditis elegans remain understudied. Two different types of intracellular pathogens that naturally infect the C. elegans intestine are the Orsay virus, which is an RNA virus, and microsporidia, which comprise a phylum of fungal pathogens. Despite their molecular differences, these pathogens induce a common host transcriptional response called the intracellular pathogen response (IPR). Here we show that zip-1 is an IPR regulator that functions downstream of all known IPR-activating and regulatory pathways. zip-1 encodes a putative bZIP transcription factor, and we show that zip-1 controls induction of a subset of genes upon IPR activation. ZIP-1 protein is expressed in the nuclei of intestinal cells, and is at least partially required in the intestine to upregulate IPR gene expression. Importantly, zip-1 promotes resistance to infection by the Orsay virus and by microsporidia in intestinal cells. Altogether, our results indicate that zip-1 represents a central hub for triggers of the IPR, and that this transcription factor has a protective function against intracellular pathogen infection in C. elegans.


Conflict of interest statement

The authors declare no competing interests.

Figures

Fig. 1
Fig. 1. zip-1 is required for induction of pals-5 GFP reporters by pals-22(RNAi) and by prolonged heat stress.
a, b Graphical overview of RNAi screen results in the pals-22(jy3); jyEx191[pals-5::gfp] background (a) and following chronic heat stress (b). GFP intensity was normalized to the length of worms (TOF) and it is indicated on the x-axis; different RNAi clones are listed on the y-axis. Boxes on the right represent enlarged sections of the graph containing zip-1(RNAi) results and relevant controls. Source data are provided as a Supplementary Data 1 file. c pals-22(jy1); jyEx191[pals-5::gfp] animals show constitutive expression of the PALS-5::GFP reporter when grown on control vector RNAi plates (upper image) but not on zip-1 RNAi plates (lower image). Two independent experimental replicates were performed with similar results. d Expression of GFP from the jyIs8[pals-5p::gfp, myo-2p::mCherry] reporter is decreased in zip-1(jy13) animals following prolonged heat stress (lower image), in comparison to wild-type animals (upper image). Three independent experimental replicates were performed with similar results. c, d Fluorescent and DIC images were merged. Scale bars = 200 µm. myo-2p::mCherry is expressed in the pharynx and is a marker for the presence of the jyIs8 transgene.
Fig. 2
Fig. 2. zip-1 is required for induction of pals-5p::GFP expression by intracellular infections, pnp-1 downregulation, and proteasome blockade.
a, b Intracellular infection by Orsay virus (a) and by N. parisii (b) leads to pals-5p::GFP expression in wild-type animals, but not in zip-1(jy13) mutants. c pnp-1(jy90) mutants show constitutive expression of the pals-5p::GFP reporter, which is suppressed in zip-1(jy13); pnp-1(jy90) double mutants. d Box-and-whisker plot of pals-5p::GFP expression normalized to length of animals (TOF). Increased GFP signal in pnp-1(jy90) mutants is significantly reduced in zip-1(jy13); pnp-1(jy90) double mutants. Three experimental replicates with 400 animals per replicate were analyzed for each strain. e Bortezomib treatment induces expression of pals-5p::GFP in a wild-type background, but not in zip-1(jy13) mutants. ac, e Three independent experimental replicates were performed with similar results. Fluorescent and DIC images were merged. Scale bars = 200 µm. myo-2p::mCherry is expressed in the pharynx and is a marker for the presence of the jyIs8 transgene. f Timecourse analysis of pals-5p::GFP expression in control and zip-1(jy13) strains following bortezomib treatment. GFP signal normalized to worm area is shown as a fluorescence intensity ratio between bortezomib- and DMSO-treated samples (y-axis). Three experimental replicates with 30 animals per replicate were analyzed; average value was used for DMSO controls. Allele names and timepoints of analysis are indicated on the x-axis. g Expression of the pals-5p::NanoLuc reporter is significantly lower in zip-1(jy13) animals than in the wild-type control strain, following bortezomib treatment. Three experimental replicates consisting of three biological replicates were analyzed for each strain and treatment. Results were normalized to background luminescence and to average value of three biological replicates for wild-type treated with DMSO. Normalized relative luminescent units (RLU) are shown on the y-axis. Images of bioluminescent signal in representative analyzed wells are shown on the bottom of the graph. d, f, g In box-and-whisker plots, the line in the box represents the median value, box bounds indicate the 25th and 75th percentiles, and whiskers extend from the box bounds to the minimum and maximum values. A Kruskal–Wallis test (d, f) or ordinary one-way ANOVA test (g) were used to calculate p-values; ****p < 0.0001; ***p < 0.001; ns indicates nonsignificant difference (p > 0.05). p-values in d for WT vs zip-1(jy13) p = 0.3552, other comparisons p < 0.0001. p-values in f for WT vs zip-1(jy13) at 0.5 h p > 0.9999; WT vs zip-1(jy13) at 4, 21 and 25 h p < 0.0001; zip-1(jy13) 0.5 h vs zip-1(jy13) 4 h p > 0.9999; zip-1(jy13) 0.5 h vs zip-1(jy13) 21 h p = 0.1093; zip-1(jy13) 0.5 h vs zip-1(jy13) 25 h p = 0.0004. p-values in g for WT DMSO vs WT BTZ p < 0.0001; WT DMSO vs zip-1(jy13) DMSO p > 0.9999; WT DMSO vs zip-1(jy13) BTZ p = 0.5576; WT BTZ vs zip-1(jy13) BTZ p < 0.0001; zip-1(jy13) DMSO vs zip-1(jy13) BTZ p = 0.5601. Source data are provided as a Source Data file.
Fig. 3
Fig. 3. zip-1 regulates the early phase of pals-5 transcription following bortezomib treatment, and controls some IPR gene expression.
a, b qRT-PCR measurements of selected IPR genes and chil-27 at 4 h timepoint (a) and 30 min timepoint (b) of bortezomib (BTZ) or DMSO treatments. The results are shown as the fold change in gene expression relative to wild-type DMSO diluent control. Three independent experimental replicates were analyzed; the values for each replicate are indicated with circles. Bar heights indicate mean values and error bars extend above. Error bars represent standard deviations. A one-tailed t-test was used to calculate p-values; black asterisks represent significant difference between the labeled sample and the wild-type DMSO control; red asterisks represent significant difference between zip-1(jy13) and wild-type (WT) N2 bortezomib-treated samples; ****p < 0.0001; ***p < 0.001; **p < 0.01; *0.01 < p < 0.05; p-values higher than 0.05 are not labeled. p-values in a for WT BTZ vs WT DMSO: pals-5 p = 0.0026, F26F2.1 p = 0.0017, F26F2.3 p = 0.0343, F26F2.4 p = 0.0211, skr-3 p = 0.0003, skr-4 p = 0.0012, skr-5 p = 0.0132, cul-6 p = 0.0117, chil-27 p = 0.0070; zip-1(jy13) BTZ vs WT DMSO: pals-5 p = 0.0002, F26F2.1 p < 0.0001, F26F2.3 p = 0.0224, F26F2.4 p = 0.0009, skr-3 p = 0.0030, skr-4 p = 0.0009, cul-6 p = 0.0159, chil-27 p = 0.0005; zip-1(jy13) BTZ vs WT BTZ: pals-5 p = 0.0086, skr-4 p = 0.0287, skr-5 p = 0.0126. p-values in b for WT BTZ vs WT DMSO: skr-3 p = 0.0258, skr-4 p = 0.0477, cul-6 p = 0.0248; zip-1(jy13) DMSO vs WT DMSO: F26F2.1 p = 0.0192; zip-1(jy13) BTZ vs WT DMSO: chil-27 p = 0.0262. All significant and nonsignificant p-values are provided as a Source Data file. c smFISH quantification of number of pals-5 mRNA transcripts in the first four intestinal cells. Three experimental replicates were performed. At least 33 animals were analyzed for each sample (WT DMSO n = 35, WT BTZ n = 47, zip-1(jy13) DMSO n = 35, zip-1(jy13) BTZ n = 38; at least five animals were analyzed per sample per replicate) 4 h after bortezomib or DMSO control treatment. In box-and-whisker plots, the line in the box represents the median value, box bounds indicate the 25th and 75th percentiles, and whiskers extend from the box bounds to the minimum and maximum values. A Kruskal–Wallis test was used to calculate p-values; ****p < 0.0001; ***p < 0.001; **p < 0.01; ns indicates nonsignificant difference (p > 0.05). p-values for WT DMSO vs WT BTZ, WT BTZ vs zip-1(jy13) DMSO and zip-1(jy13) DMSO vs zip-1(jy13) BTZ p < 0.0001; WT DMSO vs zip-1(jy13) DMSO p > 0.9999; WT DMSO vs zip-1(jy13) BTZ p = 0.0001; WT BTZ vs zip-1(jy13) BTZ p = 0.0037. d Western blot analysis of PALS-5 expression in wild-type, zip-1(jy13) and pals-5(jy133) animals. pals-5(jy133) is a complete deletion of the pals-5 gene and was used as a negative control. Animals were treated with bortezomib or DMSO control for 4 h. PALS-5 was detected using anti-PALS-5 antibody, whereas anti-tubulin antibody was used as a loading control. Predicted sizes are 35.4 kD for PALS-5 and around 50 kD for different members of the tubulin family. One out of three independent experimental replicates is shown; similar results were obtained from all three replicates (other two replicates are shown in the Supplementary Fig. 5a). ad Source data are provided as a Source Data file.
Fig. 4
Fig. 4. Defining zip-1-dependent IPR genes.
a, b Venn diagrams of differentially expressed genes following 30 min (a) and 4 h bortezomib treatments (b) in WT N2 and zip-1(jy13) mutant animals as compared to DMSO controls for each background. 64 and 888 genes were upregulated after 30 min and 4 h bortezomib treatment in N2 animals, respectively, but not in zip-1(jy13) mutants, suggesting that these genes are zip-1-dependent. Source data are provided as a Supplementary Data 2 file. c The zip-1-dependent gene set shows significant overlap with previously published list of genes that are upregulated by different IPR triggers. A Fisher’s exact test was used to calculate odds ratios and p-values. These values were calculated taking in account all genes in C. elegans genome. If the odds ratio is greater than one, two datasets are positively correlated. Jaccard index measures similarity between two sets, with the range 0–1 (0 - no similarity, 1 - same datasets). For approximate quantification, the odds ratio and Jaccard index color keys are indicated on the right side of the table. Source data are provided as a Supplementary Data 3 file. d Bubble plot of enriched gene categories for all zip-1-dependent genes at 30 min and 4 h timepoints of bortezomib treatment. Each category represents a biological process or a structure associated with zip-1-dependent genes at either timepoint. Count of genes found in each category is indicated by the circle size, as illustrated under the table. Statistical significance for each category is indicated by the circle color; p-values are indicated under the table. p-values were determined using Bonferroni correction from the minimum hypergeometric scores calculated by the WormCat software. Source data (including p-values) are provided as a Supplementary Table 1. e Classification of 80 canonical IPR genes based on their zip-1 dependency. Representative canonical IPR genes from each class are shown in bold and underlined. Source data are provided as a Supplementary Data 2 file.
Fig. 5
Fig. 5. zip-1 acts in the intestine to regulate pals-5 mRNA levels.
a, b ZIP-1::GFP is expressed in intestinal (a) and epidermal nuclei (b) 4 h after bortezomib treatment. No expression was observed in animals exposed to DMSO control, or in the non-transgenic control strain N2. Composite images consist of merged fluorescent (GFP and autofluorescence) and DIC channels. Yellow signal in the composite images depicts autofluorescence from gut granules. White arrows indicate representative intestinal nuclei expressing ZIP-1::GFP; yellow arrows indicate autofluorescence. Scale bar = 20 µm. ce N. parisii (c) and Orsay virus infection (d, e) induce ZIP-1::GFP expression in intestinal nuclei. Fluorescent and DIC images were merged; green represents ZIP-1::GFP; fluorescence from pathogen-specific FISH probes is shown in red. White arrows indicate representative intestinal nuclei expressing ZIP-1::GFP (ce); red arrows indicate N. parisii sporoplasms (c). Scale bar = 30 µm. f Intestine-specific zip-1(RNAi) prevents pals-5 mRNA induction. qRT-PCR measurements of pals-5 levels at the 30 min timepoint of bortezomib (BTZ) or DMSO treatments. The results are shown as fold change in gene expression relative to DMSO diluent control. Three independent experimental replicates were analyzed; the values for each replicate are indicated with circles. Bar heights indicate mean values and error bars extend above. Error bars represent standard deviations. A one-tailed t-test was used to calculate p-values; **p < 0.01; *0.01 < p < 0.05; ns indicates nonsignificant difference (p > 0.05). p-values for WT control RNAi BTZ vs zip-1(RNAi) BTZ p = 0.0170; intestinal rde-1 control RNAi BTZ vs zip-1(RNAi) BTZ p = 0.0092; epidermal rde-1 control RNAi BTZ vs zip-1(RNAi) BTZ p = 0.0614. Source data are provided as a Source Data file.
Fig. 6
Fig. 6. zip-1 promotes resistance to intracellular pathogens.
a qRT-PCR analysis of Orsay virus RNA1 levels in control and zip-1(jy13) mutant animals. Animals were infected at L4 stage and collected at 24 hpi. Seven experimental replicates were analyzed, each consisting of two biological replicates assayed in technical duplicates. b Fraction of animals infected with Orsay virus in control, zip-1(jy13), pnp-1(jy90) and zip-1(jy13); pnp-1(jy90) backgrounds at 12 hpi. Animals were infected at L1 stage. 900 animals per strain were scored based on the presence or absence of the Orsay virus RNA1-specific FISH probe fluorescence (three experimental replicates, 300 animals per replicate). The infection rate of the control strain was set to one. c N. parisii pathogen load quantified at 3 hpi as number of sporoplasms per animal; 300 L1 animals were analyzed per strain in three experimental replicates. d Quantification of N. parisii-specific mean FISH fluorescence signal normalized to body area excluding pharynx. Animals were infected at L1 stage and analyzed at 30 hpi; 200 animals were analyzed per strain (four experimental replicates, 50 animals per replicate). The head region was excluded from the analysis because of the expression of the red coinjection marker myo-2p::mCherry. AU arbitrary units. ad Bar heights indicate mean values and error bars extend above. Error bars represent standard deviations. e Survival of wild-type, zip-1(jy13), pnp-1(jy90) and zip-1(jy13); pnp-1(jy90) animals following N. parisii infection. Animals were exposed to N. parisii spores for 66 h from L1 stage, and then transferred daily to non-infectious plates and scored for viability. f Longevity analysis of strains used in the infection assays. e, f Animals were incubated at 25 °C. Data from 3 experimental replicates are shown in a single graph. Percentage of alive animals is indicated on y-axis for each day of analysis (x-axis). af Statistical analyses were performed using a one-tailed t-test (a), an ordinary one-way ANOVA (b), a Kruskal–Wallis (c, d), and a log-rank (Mantel-Cox) test (e, f) to calculate p-values; ****p < 0.0001; ***p < 0.001; **p < 0.01; *0.01 < p < 0.05; ns indicates nonsignificant difference (p > 0.05). p-value in a for WT vs zip-1(jy13) p = 0.0312. p-values in b for WT vs zip-1(jy13) p = 0.5813; WT vs pnp-1(jy90) p = 0.0079; WT vs zip-1(jy13); pnp-1(jy90) p > 0.9999; zip-1(jy13) vs pnp-1(jy90) p = 0.0017; zip-1(jy13) vs zip-1(jy13); pnp-1(jy90) p = 0.6145; pnp-1(jy90) vs zip-1(jy13); pnp-1(jy90) p = 0.0073. p-values in c for WT vs zip-1(jy13) p > 0.9999; for all other comparisons p < 0.0001. p-values in d for WT vs zip-1(jy13) p = 0.4025; WT vs pnp-1(jy90), WT vs zip-1(jy13); pnp-1(jy90) and zip-1(jy13) vs pnp-1(jy90) p < 0.0001; zip-1(jy13) vs zip-1(jy13); pnp-1(jy90) p = 0.0312; pnp-1(jy90) vs zip-1(jy13); pnp-1(jy90) p = 0.0010. p-values in e for WT vs zip-1(jy13), zip-1(jy13) vs zip-1(jy13); pnp-1(jy90) and pnp-1(jy90) vs zip-1(jy13); pnp-1(jy90) p < 0.0001; WT vs zip-1(jy13); pnp-1(jy90) p = 0.7781. p-values in f for WT vs zip-1(jy13) p = 0.0005; WT vs zip-1(jy13); pnp-1(jy90) and pnp-1(jy90) vs zip-1(jy13); pnp-1(jy90) p < 0.0001; zip-1(jy13) vs zip-1(jy13); pnp-1(jy90) p = 0.0009. All strains are in a pals-5p::gfp background. Source data are provided as a Source Data file.
Fig. 7
Fig. 7. Model of IPR gene regulation.
a All known IPR-activating pathways require ZIP-1 for induction of the pals-5p::GFP reporter. b IPR genes can be divided into three categories: early zip-1-dependent, late zip-1-dependent and zip-1-independent genes. Unknown transcription factor or factors (TFx) regulate expression of early zip-1-dependent genes at later timepoint, as well as transcription of zip-1-independent genes. Created with BioRender.com.

Similar articles

Cited by

References

    1. Kasuga Y, Zhu B, Jang KJ, Yoo JS. Innate immune sensing of coronavirus and viral evasion strategies. Exp. Mol. Med. 2021;53:723–736. - PMC - PubMed
    1. Rehwinkel J, Gack MU. RIG-I-like receptors: their regulation and roles in RNA sensing. Nat. Rev. Immunol. 2020;20:537–551. - PMC - PubMed
    1. Yamada, T. et al. RIG-I triggers a signaling-abortive anti-SARS-CoV-2 defense in human lung cells. Nat. Immunol. 10.1038/s41590-021-00942-0 (2021). - PubMed
    1. Yin X, et al. MDA5 governs the innate immune response to SARS-CoV-2 in lung epithelial cells. Cell Rep. 2021;34:108628. - PMC - PubMed
    1. Lowery, S. A., Sariol, A. & Perlman, S. Innate immune and inflammatory responses to SARS-CoV-2: implications for COVID-19. Cell Host Microbe10.1016/j.chom.2021.05.004 (2021). - PMC - PubMed

Publication types

MeSH terms

Substances