. 2022 Jan 10;13(1):101.
doi: 10.1038/s41467-021-27625-6.

An assembly of nuclear bodies associates with the active VSG expression site in African trypanosomes

Affiliations

An assembly of nuclear bodies associates with the active VSG expression site in African trypanosomes

James Budzak et al. Nat Commun. .

Abstract

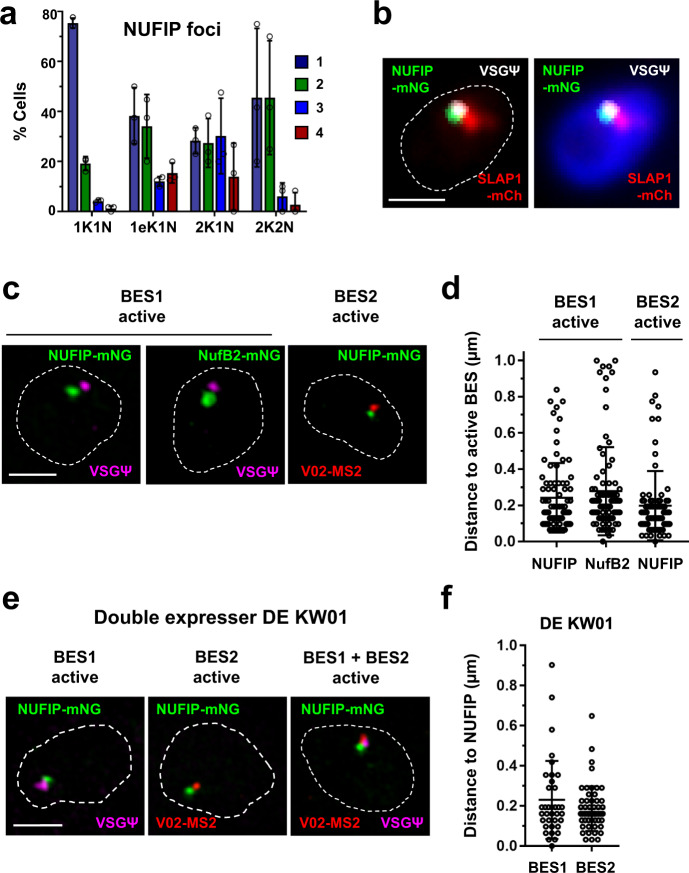
A Variant Surface Glycoprotein (VSG) coat protects bloodstream form Trypanosoma brucei. Prodigious amounts of VSG mRNA (~7-10% total) are generated from a single RNA polymerase I (Pol I) transcribed VSG expression site (ES), necessitating extremely high levels of localised splicing. We show that splicing is required for processive ES transcription, and describe novel ES-associated T. brucei nuclear bodies. In bloodstream form trypanosomes, the expression site body (ESB), spliced leader array body (SLAB), NUFIP body and Cajal bodies all frequently associate with the active ES. This assembly of nuclear bodies appears to facilitate the extraordinarily high levels of transcription and splicing at the active ES. In procyclic form trypanosomes, the NUFIP body and SLAB do not appear to interact with the Pol I transcribed procyclin locus. The congregation of a restricted number of nuclear bodies at a single active ES, provides an attractive mechanism for how monoallelic ES transcription is mediated.


Conflict of interest statement

The authors declare no competing interests.

Figures

Fig. 1
Fig. 1. Extraordinarily high levels of splicing occur at the active VSG ES, which is necessary for its transcription.
a Estimated mRNA transcripts produced per hour from an active VSG gene, an average of all Pol II-transcribed genes (Pol II), or a tubulin gene (Tub) in bloodstream form (BF) T. brucei. This is compared with mRNA from a procyclin (EP or GPEET) gene in procyclic form (PF) T. brucei. b Estimated difference in splicing rate (fold difference) at the active VSG gene or an average ES gene (BES) compared with an average of all Pol II-transcribed genes. The data used to calculate the values presented in panels (a, b) are shown in Supplementary Tables 1 and 2. c Representative fluorescence microscopy images of RNA-FISH detecting the U2 snRNA (green) or VSG pseudogene (Ψ) transcript (magenta) specific for BES1 in BF T. brucei cells. The nucleus is indicated with a dashed line, scale bar = 1 μm. A line profile displaying the U2 snRNA and VSGΨ signal intensities is shown, with fluorescence indicated in arbitrary units (arb. units). d Quantitation of the percentage (%) of cells with MS2 RNA-FISH signal in cells with different genomic loci marked with MS2 repeats, at different time points in minutes (min) after transfection with anti-U2 snRNA Morpholinos. Minimally 300 G1 (1K1N) cells were counted per time point. Values shown are the average of three biological replicates, error bars indicate ± SD. e Fluorescence microscopy imaging of a BF T. brucei cell line expressing mNG::RPA2 (green) treated with sinefungin. Time is indicated in minutes (min). The nucleus (dashed line) is stained with DAPI (blue), and the ESB indicated with a white arrowhead. Scale bar = 1 μm. f Quantitation of the percentage of cells with an ESB in the cell line shown in (e) after treatment with sinefungin. Values do not add up to 100%, as not all cells had a detectable ESB. Average values for three biological replicates are shown. At least 200 G1 (1K1N) cells were counted per time point with error bars indicating ± SD. P values were determined using a two-tailed paired Student’s t test. *P = 0.0168. Source data are provided as a Source Data file.
Fig. 2
Fig. 2. Identification of a Spliced Leader Array Body (SLAB) which frequently associates with the active ES.
a Fluorescence microscopy imaging of a triple epitope-tagged BF T. brucei cell line expressing the SLAB components SLAP1, SNAP3 and VEX1. Signals in the nucleus (dashed line) correspond to mNG::SLAP1 (SLAP-mNG, green), SNAP3::6xHA (SNAP3-HA, magenta) and VEX1::12xmyc (VEX1-myc, red). Scale bar = 1 μm. b Schematic of SLAP1 protein motifs identified using PFAM and disordered domains with PONDR. c Quantitation of the percentage (%) of BF T. brucei cells with different numbers of SLAP1 foci (1–3), visualised using an mNG::SLAP1 cell line. Cells at different cell cycle stages with various numbers of kinetoplasts (K), elongated kinetoplasts (eK) or nuclei (N) were analysed. Values are the averages of three biological replicates with error bars indicating ± SD. For 1K1N n = 218, 1eK1N n = 57, 2K1N n = 38 2K2N n = 34. Values obtained from each replicate are shown with circles. d SR-SIM imaging of individually epitope-tagged BF T. brucei cell lines expressing the SLAB1 components SNAP3, VEX1 and SLAP1 in the nucleus (dashed line). Cell lines express: SNAP3::6xHA (SNAP3-HA, green), VEX1::12xmyc (VEX1-myc, green) or mNG::SLAP1 (SLAP1 mNG, green). RNA-FISH detects nascent transcript from the active BES1 using the VSG pseudogene (VSGΨ, magenta) probe. Scale bar = 1 μm. e Quantitation of distance between SNAP3, VEX1 or SLAP1 foci to the VSGΨ transcript using the cell lines shown in (d). Average values from minimally two biological replicates are shown with error bars = ± SD. For SNAP3 n = 57, VEX1 n = 37 and SLAP1 n = 50, only 1K1N cells were quantitated. f SR-SIM imaging of the double-expresser (DE) BF T. brucei line DE KW01-MS2-V02 in which both BES1 and BES2 are simultaneously unstably active. SLAP1 is epitope-tagged: mNG::SLAP1 (SLAP1 mNG, green). Nascent BES1 transcripts were visualised with RNA-FISH using a VSG pseudogene (VSGΨ, magenta) probe, and BES2 transcripts using MS2 repeats inserted within BES2 (V02-MS2, red). Nuclei (dashed lines) are stained with DAPI (blue), and represent cells with transcription of BES1 and BES2 simultaneously or individually. Scale bar = 1 μm. g Quantitation of distance of BES1 or BES2 transcript to SLAP1 in cells shown in (f), when transcription of either BES1 or BES2 occurs individually. Data are from two biological replicates with error bars =± SD. For cells with BES1 signal only, n = 42. For cells with BES2 signal only, n = 49. Source data are provided as a Source Data file.
Fig. 3
Fig. 3. SLAP1 regulates SL-RNA production with knockdown resulting in an ES transcription block.
a SR-SIM imaging of a BF T. brucei cell line with nuclear signals corresponding to mNG::SLAP1 (SLAP1 mNG, green) or SNAP3::6xHA (SNAP3-HA, red), with the SL-RNA intron (magenta) visualised with RNA-FISH. SLAP1 RNAi was induced for the time in hours (h). b) RNA quantitation using qPCR from cells in (a) after induction of SLAP1 RNAi for the time in hours (h). Nascent RNA is from the promoter (Prom) or telomere (Telo) of BES1, or from the actin or rRNA loci. Average values are from three biological replicates with error bars indicating ± SD. **P ≤ 0.01; *P ≤ 0.05. For SLAP1 mRNA, P = 0.006, BES1 telomere pre-mRNA P = 0.02 and actin pre-mRNA P = 0.0051. c Fluorescence microscopy imaging of a BF T. brucei cell line, with mNG::SLAP1 (SLAP1 mNG, green) and SNAP3::6xHA (SNAP3-HA, red) signal shown, with VSGΨ transcript (magenta) detected with RNA-FISH. SLAP1 RNAi was induced for the time in hours (h). d Quantitation of the percentage (%) of cells in (c) with VSGΨ RNA-FISH signal after induction of SLAP1 RNAi for the time in hours (h). Values are the average of three biological replicates, with error bars indicating ± SD. At least 297 1K1N cells were counted for each condition. *P = 0.029. e Fluorescence microscopy imaging of a BF T. brucei cell line with a signal corresponding to mNG::SLAP1 (SLAP1-mNG, green) or TdT::RPA2 (RPA2-TdT, red), and a white arrowhead indicating the ESB. SLAP1 RNAi was induced for the time in hours (h). f Quantitation of the percentage (%) of cells in (e) with a discrete ESB after induction of SLAP1 RNAi for the time indicated in hours (h). Averages of three biological replicates are shown, with error bars indicating ± SD. At least 247 1K1N cells were counted for each condition. **P = 0.0031. In all microscopy images nuclei (dashed lines) are stained with DAPI (blue). On bar graphs, the values from individual replicates are shown with circles. All P values were determined using a two-tailed paired Student’s t test. All scale bars = 1 µm. Source data are provided as a Source Data file.
Fig. 4
Fig. 4. Identification of a novel NUFIP body.
a Schematic of NUFIP body components: NUFIP, RBP34, ZNHIT3 and the newly identified NufB1 and NufB2 proteins. Relevant protein domains and motifs were identified using PFAM, and disordered domains with PONDR (coloured boxes). b SR-SM imaging of a BF T. brucei cell line with three NUFIP components epitope-tagged. Signals in the nuclei (dashed lines) correspond to NUFIP::mNG (NUFIP-mNG, green), mCh::NufB1 (NufB1-mCH, red) and NufB2::6HA (NufB2-HA, magenta), with DNA stained with DAPI (blue). The insets show further magnification of the foci, illustrating the ‘shell’-like structure. Scale bar = 1 μm for main images, and 200 nm for the insets. c As in (b), only showing SR-SM microscopy imaging of a BF cell line with two NUFIP body components epitope-tagged: NufB2::6HA (NufB2-HA, magenta) and RBP34::mNG (RBP34-mNG, green). d As in (b), but showing SR-SM microscopy imaging of a BF cell line with two NUFIP body components epitope-tagged: NufB2::6HA (NufB2-HA, magenta) and ZNHIT3::mNG (ZNHIT3-mNG, green).
Fig. 5
Fig. 5. The NUFIP body associates with the active ES in BF T. brucei.
a Quantitation of the percentage (%) of BF T. brucei cells with different numbers of NUFIP foci (1–4) monitored using SR-SIM imaging. Different cell cycle stages are shown, with the number of kinetoplasts (K), elongated Kinetoplast (eK) or nuclei (N) indicated. Values are the averages from three biological replicates with error bars indicating ± SD. The values from individual replicates are shown with circles. For 1K1N n = 333, 1eK1N n = 76, 2K1N n = 49 and 2K2N n = 38. b Widefield microscopy imaging of a BF T. brucei cell line with the SLAB and NUFIP bodies visualised, combined with RNA-FISH detecting BES1 nascent RNA using a VSG pseudogene probe (VSGΨ, white). This line expresses mCh::SLAP1 (SLAP1-mCh, red) and NUFIP::mNG (NUFIP-mNG, green). The nucleus (dashed line) is stained with DAPI (blue). Scale bar = 1 μm. c SR-SIM imaging of a nucleus (dashed line) from BES1 expressing BF T. brucei which has the NUFIP body components NUFIP (NUFIP-mNG, green) or NufB2 (BUFB2-mNG, green) epitope-tagged with mNeon green. BES1 nascent transcript is detected with a VSG pseudogene (VSGΨ, magenta) probe. Alternatively, a BES2 expressing T. brucei line containing a MS2 repeat containing construct in BES2 was analysed which also had NUFIP epitope-tagged (NUFIP-mNG, green). BES2 nascent transcript were visualised with an MS2 probe (V02-MS2, red). Scale bar = 1 μm. d Quantitation of the distance between BES1 or BES2 nascent RNA and NUFIP or NufB2 using the cells in (c). Values are the averages from at least two biological replicates with error bars indicating ±SD. For active BES1 to NUFIP n = 81, active BES1 to NufB2 n = 89 and active BES2 to NUFIP n = 79. e SR-SIM imaging of combined RNA-FISH detecting nascent BES1 RNA (VSGΨ, magenta) or BES2 RNA (V02-MS2, red) with NUFIP::mNG (NUFIP-mNG, green). This was in BF T. brucei double-expresser cell line DE KW01-MS2-V02 where both BES1 and BES2 are unstably transcriptionally active. Scale bar = 1 μm. f Quantitation of the distance from BES1 or BES2 nascent RNA to the NUFIP body using cells from (e) in which RNA from either BES1 or BES2 is detectable. Values are the averages from two biological replicates, with error bars showing ±SD. For BES1 to NUFIP n = 54, for BES2 to NUFIP n = 36. Source data are provided as a Source Data file.
Fig. 6
Fig. 6. A subset of BF T. brucei cells have a Cajal body that associates with the active ES.
a SR-SIM imaging of a BF T. brucei cell line expressing two conserved Cajal body markers which are epitope-tagged: mNG::NOP56 (NOP56-mNG, green) and 3xHA::fibrillarin2 (fibrillarin2-HA, red). The Cajal body is indicated with a light-blue arrowhead. b Quantitation of the percentage (%) of BF T. brucei cells with 1–3 Cajal bodies, as determined by fluorescence microscopy imaging of a cell line expressing mNG::NOP56. Cells throughout the cell cycle containing different numbers of kinetoplasts (K), elongated kinetoplasts (eK) or nuclei (N) were monitored. Average values are shown from three biological replicates, with error bars, indicating ±SD. The values from individual replicates are shown with circles. For 1K1N n = 284, 1eK1N n = 120, 2K1N n = 40 and 2K2N n = 30. c Fluorescence microscopy imaging of a cell line expressing the Cajal body component mNG::NOP56 (NOP56-mNG, green) and the Pol I subunit TdT::RPA2 (RPA2-TdT, red). The nucleolus is visualised with an anti-L1C6 antibody (magenta), detecting an uncharacterised nucleolar protein. The Cajal body is indicated with a light-blue arrowhead and the ESB with a white arrowhead. d SR-SIM imaging of a cell line with epitope-tagged NOP56: mNG::NOP56 (NOP56-mNG, green) combined with RNA-FISH detecting nascent RNA from the active BES1 using a VSG pseudogene (VSGΨ, magenta) probe. e Quantitation of the distance between the Cajal body (NOP56) with the nascent transcript from BES1 (VSGΨ) using the cell line from (d). The data are from two biological replicates, (N = 54). Error bars indicate ±SD. For all microscopy images, nuclei are indicated with dashed lines, DNA is stained with DAPI (blue), and scale bars = 1 μm. Source data are provided as a Source Data file.
Fig. 7
Fig. 7. An assembly of nuclear bodies associates with the active ES in BF T. brucei.
a Simultaneous visualisation of the ESB, SLAB and NUFIP bodies using SR-SIM imaging of a triple epitope-tagged BF T. brucei cell line. This cell line expresses mNG::RPA2 (RPA2-mNG, green), mCh::SLAP1 (SLAP-mCh, red) and NufB2::6HA (NufB2-HA, magenta). The ESB is indicated with a white arrowhead within a nucleus (dashed line) stained with DAPI (blue). Scale bar = 1 μm. b Quantitation of the distance between the ESB (visualised with RPA2) and the SLAB (visualised with SLAP1) compared with the distance between the ESB and the NUFIP body (visualised with NufB2). Data was of the cell line shown in (a) using SR-SIM imaging. The scatter plot is divided into four quadrants which are coloured according to whether the different bodies in the cells are within 500 nm of each other. Quantitation of the percentage (%) of cells within each coloured quadrant is on the right. Example images of cells from each quadrant are shown in Supplemental Fig. 10. N = 110 cells in G1 (1K1N) from two biological replicates. c Simultaneous visualisation of the Cajal, SLAB and NUFIP bodies using SR-SIM imaging of a triple epitope-tagged cell line. This line expresses mNG::NOP56 (NOP56-mNG, green), mCh::SLAP1 (SLAP-mCh, red) and NufB2::6HA (NufB2-HA, magenta). The NUFIP body is indicated with a light-purple arrowhead within a nucleus (dashed line) stained with DAPI (blue). Scale bar = 1 μm. d Quantitation of the distance of the Cajal body (CB) (visualised with NOP56) and the NUFIP body (visualised with NufB2) compared with the distance between the SLAB (visualised with SLAP1) and the Cajal body. Data were from the cell line shown in (c) using SR-SIM imaging. The scatter plot is divided into quadrants, which are coloured differently according to whether the different bodies in the cells are within 500 nm of each other. Example images of cells from each quadrant are shown in Supplemental Fig. 10. N = 55 cells in G1 (1K1N) from two biological replicates. Source data are provided as a Source Data file.
Fig. 8
Fig. 8. The highly SUMOylated focus is in close proximity to the ESB.
a SR-SIM imaging of the ESB (Halo::RPA2, magenta) with the highly SUMOylated focus (HSF; α-SUMO antibody, green) (upper panel) or the ESB (mNG::RPA2, green) with VEX2::6HA (magenta) (lower panel) in BF T. brucei. The ESB is indicated with a white arrowhead. b Combined RNA-FISH detecting nascent transcripts from the active BES1 promoter (BES1-Prom-24xMS2, red) and the active BES1 telomere (VSGΨ, magenta) with visualisation of the ESB (mNG::RPA2, green; upper panel) or the HSF (α-SUMO antibody, green; lower panel) using SR-SIM imaging. The ESB is indicated with a white arrowhead. c Violin plot showing quantitation of the distances of the ESB (RPA2) to either VEX2 or the HSF using microscopy images shown in (a) or the distances of nascent RNA from either the active BES1 promoter or telomere to either the HSF or ESB (RPA2) using microscopy images shown in (b). The number of 1K1N cells counted for each quantitation was VEX2-RPA2 n = 52, HSF-RPA2 n = 184, BES1 RNA-HSF n = 120, BES1 RNA-RPA2 n = 189. Cells with BES1 transcripts were only quantitated when both transcripts (promoter and telomere) were present. Measurements were taken from minimally two biological replicates. The broad lines indicate the mean with error bars indicating ±SD. d Immunofluorescence microscopy imaging of the Cajal body (CB) visualised with NOP56 (mNG::NOP56, green) and the HSF (α-SUMO antibody, magenta) in BF T. brucei. The Cajal body is indicated with a light-blue arrowhead. e Simultaneous imaging of the NUFIP body (NB) (NUFIP-mNG, green), SLAB (SLAP1-mCh, red) and HSF (α-SUMO antibody, magenta) in BF T. brucei using fluorescence microscopy. f Quantitation of the distance between the HSF and the Cajal body, SLAB or NUFIP body using the microscopy images shown in (d, e). Data were collected from 1K1N cells with minimally N = 97 from two biological replicates. Error bars indicate ±SD. For all microscopy images, nuclei are indicated with dashed lines, DNA is stained with DAPI (blue) and scale bars = 1 µm. Source data are provided as a Source Data file.
Fig. 9
Fig. 9. The SLAB, NUFIP and Cajal bodies are present in PF T. brucei, with the SLAB and NUFIP bodies frequently associated with each other, but not with the EP1 procyclin locus.
a The SLAB was investigated using microscopy imaging of a PF T. brucei line expressing the epitope-tagged SLAB components mNG::SLAP1 (SLAP-mNG, green), SNAP3::6HA (SNAP3-HA, magenta) and VEX1::12myc (VEX1-myc, red). The NUFIP body was investigated using SR-SM imaging of a PF cell line expressing epitope-tagged NUFIP body components NUFIP::mNG (NUFIP-mNG, green) and NufB2::6HA (NufB2-HA, red). The inset image shows a magnification of the NUFIP body. The Cajal body was investigated with a PF T. brucei line expressing Cajal body components mNG::NOP56 (NOP56-mNG, green) and 3xHA::fibrillarin2 (fibrillarin2-HA, red). The arrowhead indicates the Cajal body. b SR-SIM imaging of RNA-FISH visualising nascent MS2 transcripts expressed from 24 MS2 repeats inserted in the EP1 procyclin locus (EP1-MS2, red) combined with imaging of NUFIP::mNG (NUFIP-mNG) or mNG::SLAP1 (SLAP-mNG, green). A schematic of the EP1 procyclin locus containing MS2 repeats (hatched box) is shown above, with the promoter indicated with a flag and transcription with an arrow. c Quantitation of the distance between the NUFIP body (NUFIP) or SLAB (SLAP1) to nascent MS2 transcripts expressed from the EP1 procyclin locus using the PF cells in (b). Data were from two biological replicates with error bars indicating ±SD. For EP1-MS2 to SLAP1 n = 43, for EP1-MS2 to NUFIP n = 63. d SR-SIM imaging of a PF T. brucei line expressing epitope-tagged components for the NUFIP: NufB2::6xHA (NufB2-HA, green) or SLAB: mCh::SLAP1 (SLAP1-mCh, red) bodies. e Quantitation of the distance between the NUFIP and SLAB bodies in PF T. brucei using the cell line in (d). Data were from two biological replicates with error bars indicating ±SD, n = 72. In all microscopy images, nuclei are indicated with dashed lines and scale bar = 1 μm for main images and 200 nm for the inset. Source data are provided as a Source Data file.
Fig. 10
Fig. 10. Model of the architecture of the Expression Site nuclear body assembly in BF T. brucei.
Schematic representation of a BF T. brucei nucleus (light blue) with the nucleolus indicated (dark blue). Active and silent ESs are expanded in the green boxes. The active ES is associated with four discrete nuclear bodies: The ESB (green circle), the Cajal body (dark blue circle), the SLAB (red circle) and the NUFIP body (purple circle). The ESB contains Pol I and VEX2, and shows partial overlap with a highly SUMOylated focus (SUMO). The SLAB closely associates with the spliced leader (SL) RNA gene locus. The ESs contain various genes (white boxes) in addition to the telomeric VSG gene, with the promoters indicated with flags, transcription with a red arrow and telomere repeats with black triangles. These four nuclear bodies appear to often cluster in a single nuclear compartment which forms an ES nuclear body assembly (large light-blue circle with red dashed outline) satisfying the high demand for splicing at the active ES. Silent ESs are not associated with this ES nuclear body assembly and the low amount of nascent RNA generated from these ESs is not spliced efficiently.

Similar articles

Cited by

References

    1. Buscher, P., Cecchi, G., Jamonneau, V. & Priotto, G. Human African trypanosomiasis. Lancet390, 2397–2409 (2017). - PubMed
    1. Schwede A, Macleod OJ, MacGregor P, Carrington M. How does the VSG coat of bloodstream form African trypanosomes interact with external proteins? PLoS Pathog. 2015;11:e1005259. - PMC - PubMed
    1. Cestari I, Stuart K. Transcriptional regulation of telomeric expression sites and antigenic variation in trypanosomes. Curr. Genomics. 2018;19:119–132. - PMC - PubMed
    1. Horn, D. Antigenic variation in African trypanosomes. Mol. Biochem. Parasitol. 195, 123–129 (2014). - PMC - PubMed
    1. Clayton CE. Gene expression in Kinetoplastids. Curr. Opin. Microbiol. 2016;32:46–51. - PubMed

Publication types

MeSH terms

Substances