. 2022 Jan 10;13(1):156.
doi: 10.1038/s41467-021-27088-9.

Progranulin mediates immune evasion of pancreatic ductal adenocarcinoma through regulation of MHCI expression

Affiliations

Progranulin mediates immune evasion of pancreatic ductal adenocarcinoma through regulation of MHCI expression

Phyllis F Cheung et al. Nat Commun. .

Abstract

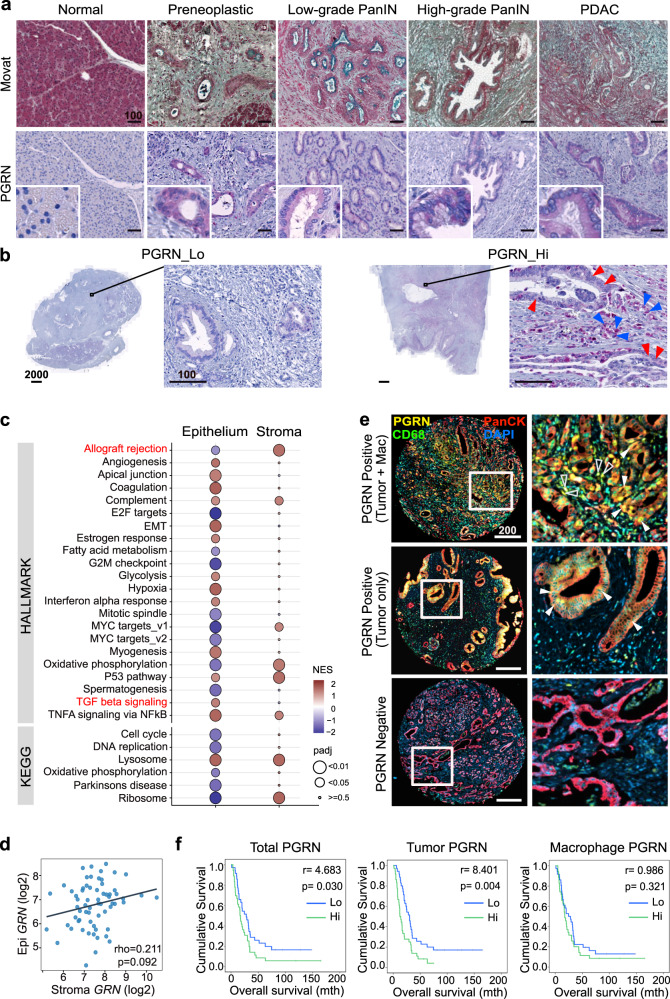
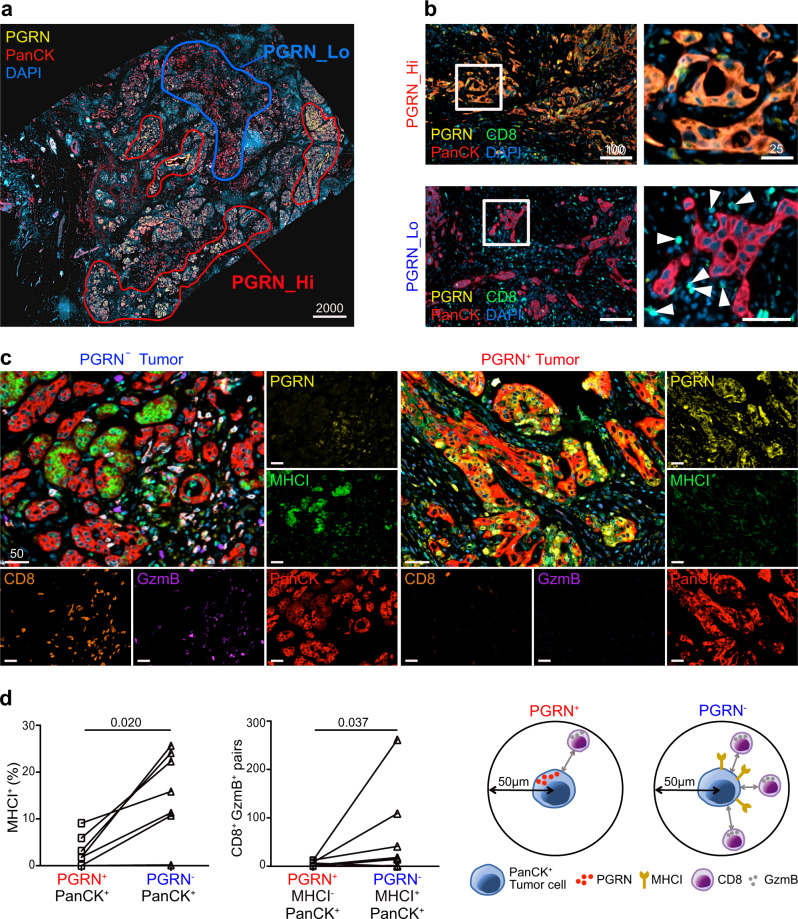
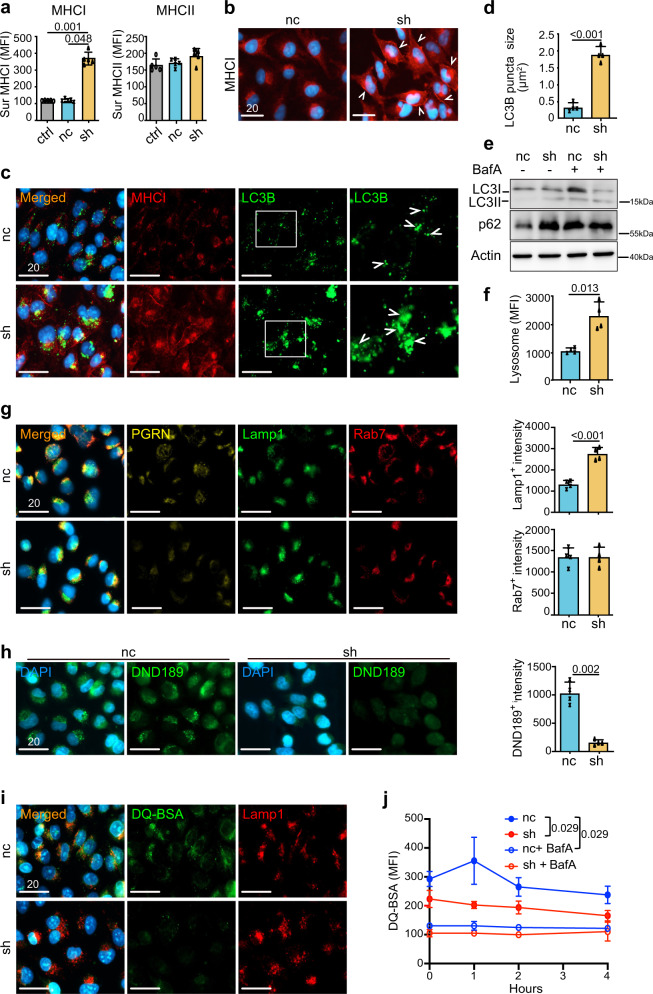
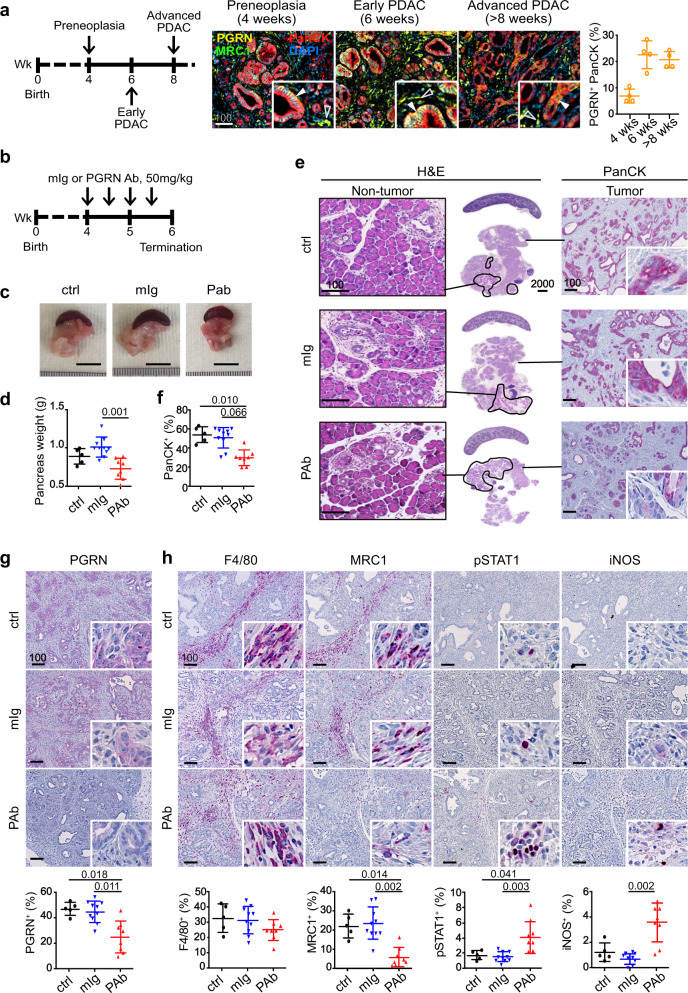
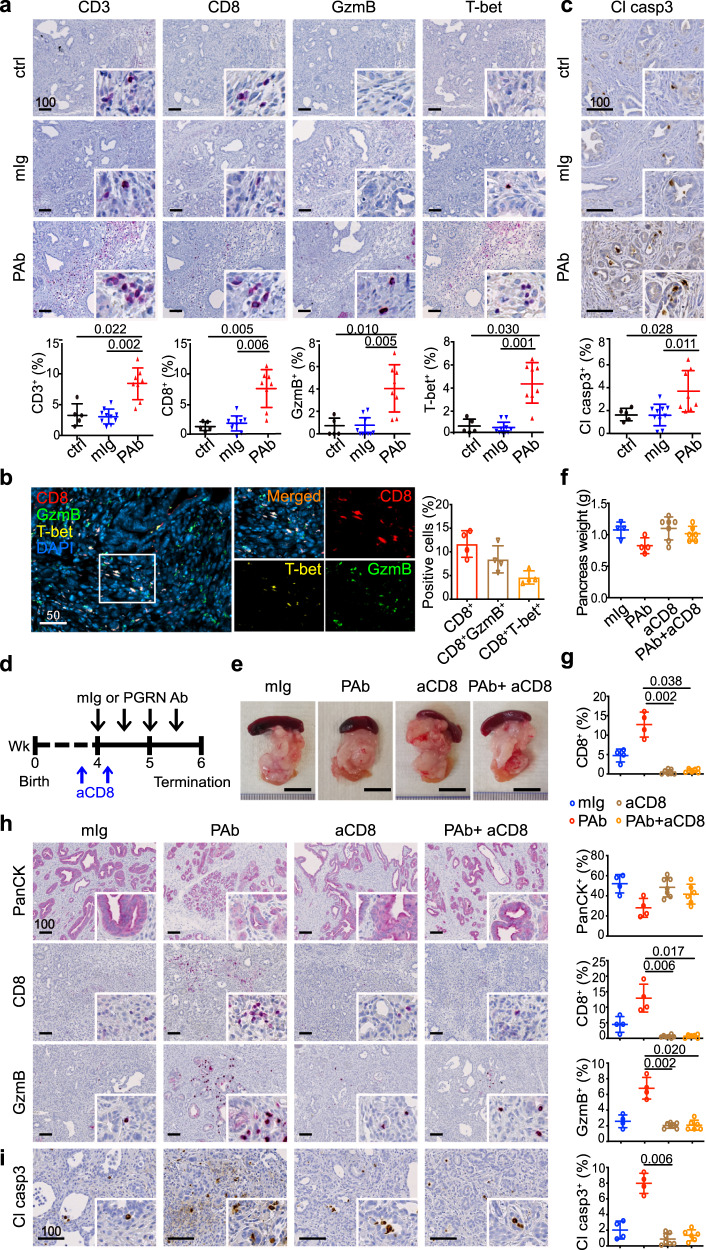
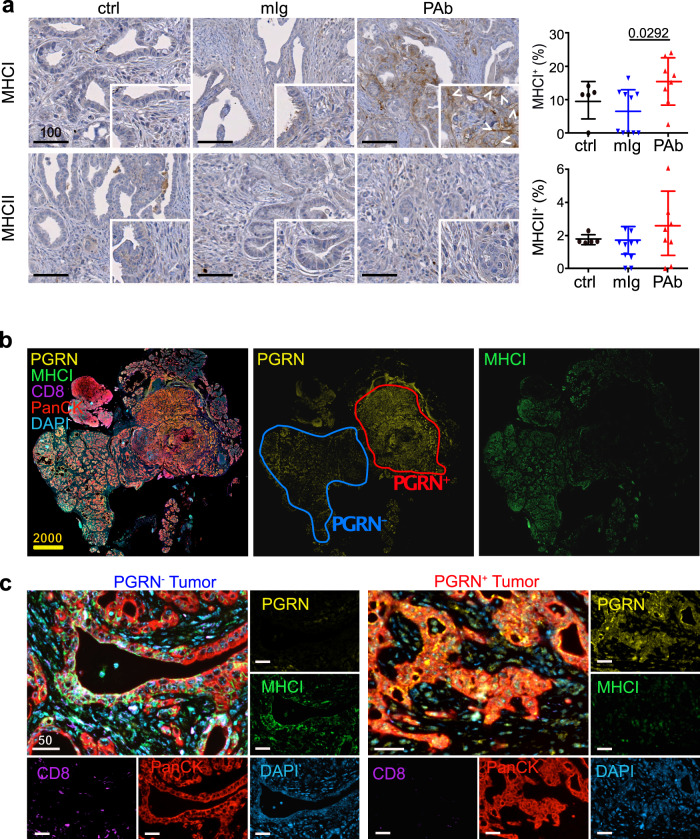
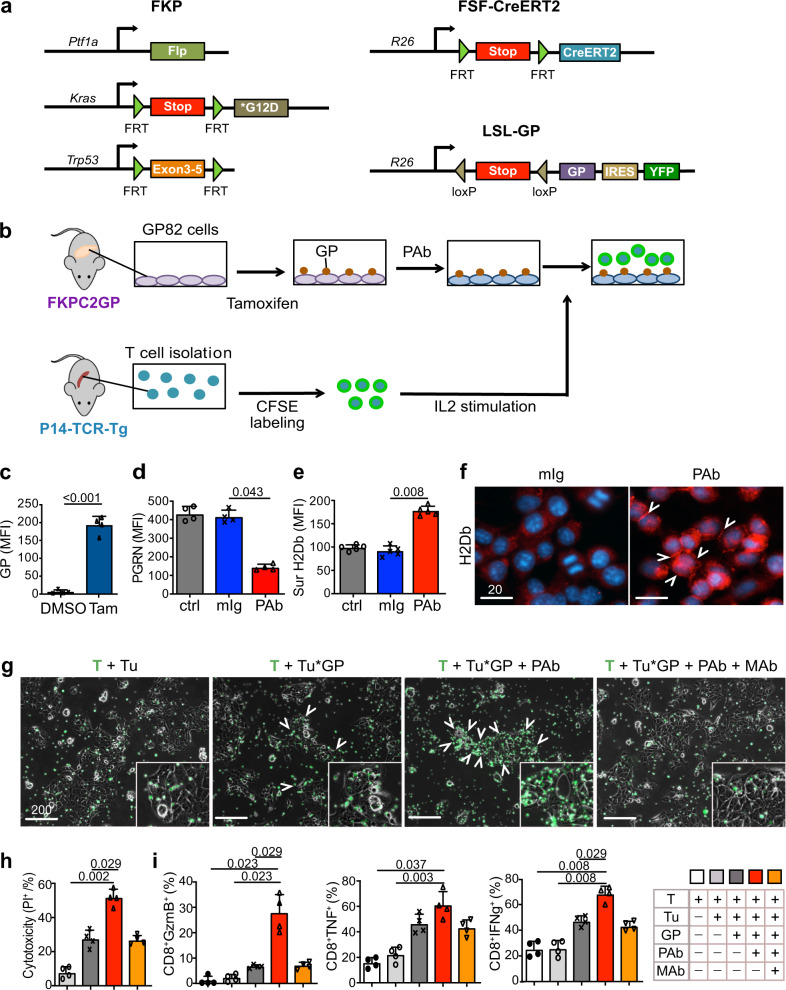
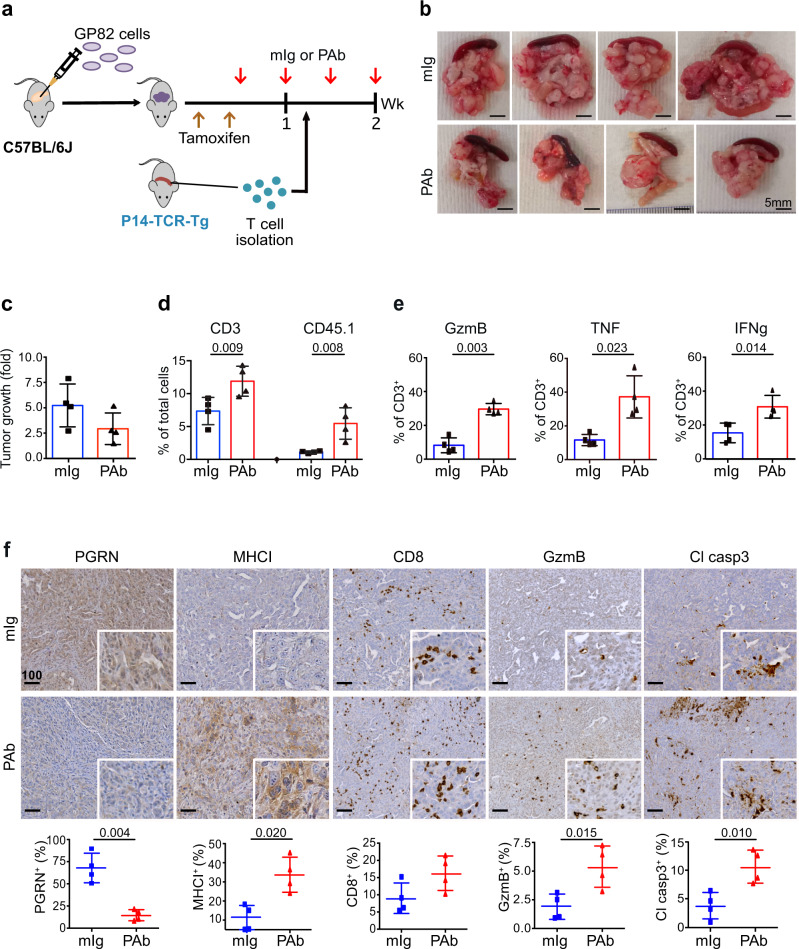
Immune evasion is indispensable for cancer initiation and progression, although its underlying mechanisms in pancreatic ductal adenocarcinoma (PDAC) are not fully known. Here, we characterize the function of tumor-derived PGRN in promoting immune evasion in primary PDAC. Tumor- but not macrophage-derived PGRN is associated with poor overall survival in PDAC. Multiplex immunohistochemistry shows low MHC class I (MHCI) expression and lack of CD8+ T cell infiltration in PGRN-high tumors. Inhibition of PGRN abrogates autophagy-dependent MHCI degradation and restores MHCI expression on PDAC cells. Antibody-based blockade of PGRN in a PDAC mouse model remarkably decelerates tumor initiation and progression. Notably, tumors expressing LCMV-gp33 as a model antigen are sensitized to gp33-TCR transgenic T cell-mediated cytotoxicity upon PGRN blockade. Overall, our study shows a crucial function of tumor-derived PGRN in regulating immunogenicity of primary PDAC.


Conflict of interest statement

J.T.S. reports the following disclosures: Bristol Myers Squibb, Celgene, Roche (Research Funding); AstraZeneca, Bayer, Bristol Myers Squibb, Celgene, Immunocore, Novartis, Roche, Shire (Consulting or advisory role); AstraZeneca, Aurikamed, Baxalta, Bristol Myers Squibb, Celgene, Falk Foundation, iomedico, Immunocore, Novartis, Roche, Shire (honoraria); minor equity in iTheranostics and Pharma15 (<3%); member of the Board of Directors for Pharma15, all outside the submitted work. The other authors declare no competing interests.

Figures

Fig. 1
Fig. 1. PGRN exerts different functions on tumor cells and macrophages in human PDAC.
a, b Essen cohort (n = 54). a PGRN expression pattern during human PDAC development. Movat and IHC staining of PGRN in normal pancreas, preneoplastic low- and high-grade PanIN stages, and tumorous tissues of PDAC patients. (n = 54). Representative images are shown. b IHC staining of the representative patient specimens with high and low PGRN levels as defined by the quantification of Definiens, with a median of a number of PGRN+ cells as cutoff. Right panel: PGRN expression in both tumor and stromal compartments of PDAC. Red arrowheads indicate PGRN+ tumor cells; blue arrowheads indicate PGRN+ stromal cells. (n = 54). Representative images are shown. c, d Maurer et al. data set (GSE93326, n = 65). c GSEA result of hallmark and KEGG pathways in PDAC epithelium and stroma samples shows different enriched gene sets for high GRN in epithelium and stroma. Enrichment was tested against the differential expression profile of GRN-high (n = 32) versus GRN-low (n = 32) in epithelium and stroma samples separately. Pathways with the Benjamini–Hochberg method adjusted p value (padj) smaller than 0.05 were considered significant. Pathways with padj < 0.01 from either epithelium or stroma groups were shown with their NES and padj values. A complete list of significant pathways is shown in Supplementary Data 2. Gene sets of interest are highlighted in red. d No significant correlation between epithelium (tumor) and stroma GRN expression levels (Log2CPM) in 63 pairs of PDAC specimens. e, f CONKO-001 cohort (n = 71). Spearman’s rank correlation: rho = 0.211, p = 0.092. Tissue microarrays were stained for PGRN, CD68 (macrophage), PanCK (tumor), and DAPI by multiplex immunofluorescent (mIF) staining and quantified by Definiens. e Representative tissue cores show PGRN expression in: both tumor cells (Tumor) and macrophages (Mac), in tumor cells only, and negative in both cell types. (n = 71). Representative images are shown Right column: filled arrowheads indicate PGRN+ tumor cells. Hollow arrowheads indicate PGRN+ macrophages. f PDAC samples were categorized into high (n = 35) and low (n = 36) expression groups (cutoff: median of the number of PGRN+ cells) based on the PGRN expression in all the cells (Total PGRN), tumor cells (Tumor PGRN, PGRN+PanCK+) only, and macrophages (macrophage PGRN, PGRN+CD68+) only. Kaplan–Meier overall survival plots according to PGRN expression level in different cell compartments. Log-rank test. Scale bar unit: μm.
Fig. 2
Fig. 2. PGRN+ tumors of PDAC patients exhibit lower levels of MHCI expression and CD8 infiltration.
a Representative mIF image demonstrates the intratumoral heterogeneity of PGRN expression in human PDAC, where high and low PGRN-expressing tumor regions were observed in the same specimen. (n = 8). Representative images are shown. b mIF staining of PGRN (yellow), CD8 (green), and PanCK (red) in human PDAC shows increased CD8 infiltration in low PGRN-expressing tumor areas. (n = 8). Representative images are shown. c Differential MHCI (HLA-A) expression in PGRN+ and PGRN tumors, and the infiltration of GzmB+CD8+ cells in their corresponding neighborhoods. (n = 8). Representative images are shown. d Automated computational analysis showing the percentage of MHCI+ cells in PGRN+PanCK+ and PGRNPanCK+ tumor populations, and the number of CD8GzmB cells in proximity (<50 μM radical distance) of PGRN+MHCI or PGRNMHCI+PanCK+ tumor cells in human PDAC (n = 8). Two-tailed Mann–Whitney test. Scale bar unit: μm.
Fig. 3
Fig. 3. PGRN suppression leads to surface MHCI upregulation and dysfunctional autophagy in human PDAC cells.
a Surface MHCI (HLA-A/B/C) and MHCII (HLA-DR) expression on human PDAC cell line MiaPaCa2 upon GRN suppression was assessed by flow cytometry (n = 5 independent experiments). One-way ANOVA, Kruskal–Wallis test. b IF staining of MHCI marker HLA-A/B/C demonstrates augmented surface MHCI expression on MiaPaCa2 upon GRN suppression. White arrowheads indicate the membraneous staining of MHCI. (n = 4 independent experiments). Representative images are shown. c, d IF staining of MHCI (red) and LC3B (green) in MiaPaCa2 cells upon GRN suppression. d The average size of LC3B puncta of 50 cells of each treatment was measured by ZEN software. (n = 4 independent experiments). Two-tailed Mann–Whitney test. e Western blot showing LC3B (LC3I, II), p62/SQSTM1 (p62), and actin of MiaPaCa2 cells upon GRN suppression treated with or without V-ATPase inhibitor Balfinomycin A (BafA, 100 nM, 24 h). (n = 4 independent experiments). Representative images are shown. f Lysosome content in MiaPaCa2 upon GRN suppression was assessed by staining with Cytopainter LysoGreen indicator and measured by flow cytometry. n = 4 independent experiments. Two-tailed Mann–Whitney test. g IF staining of PGRN, lysosome marker Lamp1, and late endosome marker Rab7 in MiaPaCa2 upon GRN suppression. Right panel: average intensity of Lamp1 and Rab7 signals per cell was measured by HALO software. n = 4 independent experiments. Representative images are shown. Two-tailed Mann–Whitney test. p = 0.029 (Lamp1+). h IF staining of LysoSensor DND-189 in MiaPaCa2 cells upon GRN suppression. Right panel: average intensity of DND-189 signal per cell was measured by HALO software. n = 4 independent experiments. Two-tailed Mann–Whitney test. i IF images showing the dequenched DA-BSA (green) and Lamp1 (red) in MiaPaCa2 cells upon GRN suppression. j Quantification of the dequenched DQ-BSA signal in MiaPaCa2 cells upon GRN suppression, with or without prior treatment with BafA (100 nM, 24 h), after different chasing times. n = 4 independent experiments. Two-tailed Mann–Whitney test. ctrl: parental PDAC cells; nc: shRNA scrambled control; sh; GRN shRNA. MFI mean fluorescence intensity. Mean + SD are shown. Scale bar unit: μm.
Fig. 4
Fig. 4. In vivo PGRN blockade suppresses tumor initiation and progression in mouse PDAC.
a mIF staining and quantification of PGRN+ tumor cells (PGRN+PanCK+) in the pancreas of wild-type mice and CKP mice with preneoplasia (4 weeks), early (6 weeks) and advanced (>8 weeks) PDAC. Filled arrowheads indicate PGRN+ tumor cells; Hollow arrowheads indicate PGRN+ macrophages. b Timeline for treatment of CKP mice with mouse isotype (mIg) or anti-PGRN antibody (PAb), 50 mg/kg. c Representative pictures of tumors and spleens from mIg-treated (mIg, n = 10), PGRN Ab-treated (PAb, n = 8), and untreated (ctrl, n = 5) CKP mice. d Weight of pancreas of CKP mice upon dissection. One-way ANOVA, Kruskal–Wallis test. e PGRN blockade suppresses tumorigenesis in CKP mice. Left panel: H&E staining of pancreas and spleens of CKP mice. Non-tumorous pancreatic tissues are highlighted by black lines. Right panel: IHC staining of panCK in the CKP pancreata. f The percentage of PanCK+ cells in the whole pancreata was quantified by Definiens software. One-way ANOVA, Kruskal–Wallis test. IHC staining of (g) PGRN and (h) pan-macrophage marker F4/80, M2 marker MRC1, M1 markers pSTAT1 and iNOS in CKP tumors treated with or without PGRN Ab (PAb) or mIg (50 mg/kg). The lower panels show the percentage of respective positive cells in the whole tumorous tissues as quantified by Definiens software. ctrl: n = 5; mIg: n = 10; PAb: n = 8. Mean + or ± SD is shown. One-way ANOVA, Kruskal–Wallis test. Scale bar unit: μm.
Fig. 5
Fig. 5. In vivo PGRN blockade revives CD8 antitumor cytotoxicity.
IHC staining of a T-cell markers CD3 and CD8; cytotoxic markers granzyme B (GzmB), and T-bet in CKP tumors treated with or without PGRN Ab (PAb) or mIg (50 mg/kg). The lower panels show the percentages of positive cells in the whole tumor. ctrl: n = 5; mIg: n = 10; PAb: n = 8. One-way ANOVA, Kruskal–Wallis test. b mIF showing the proportion of CD8+ cells co-expressing cytotoxic markers GzmB or T-bet. n = 4. c IHC staining of apoptotic marker cleaved caspase 3 (Cl casp3) in CKP tumors treated with or without PGRN Ab (PAb) or mIg. The lower panels show the percentages of positive cells in the whole tumor. ctrl: n = 5; mIg: n = 10; PAb: n = 8. One-way ANOVA, Kruskal–Wallis test. d Timeline for treatment of CKP mice with CD8 depleting Ab (aCD8, 25 mg/kg), mouse isotype (mIg) or anti-PGRN antibody (PAb, 50 mg/kg). e Representative pictures of tumors and spleens from CKP mice. f Weight of pancreas of CKP mice upon dissection. mIg: n = 4; PAb: n = 7; aCD8: n = 7; aCD8+ PAb: n = 6. g Quantification of tumor-infiltrating CD8 in the CKP tumors by flow cytometry. One-way ANOVA, Kruskal–Wallis test. IHC staining of h PanCK, CD8, GzmB, and i cleaved casp3 in CKP tumors treated with or without PGRN Ab, mIg and/or CD8 depleting Ab (aCD8). mIg: n = 4; PAb: n = 4; aCD8: n = 7; aCD8+ PAb: n = 6. One-way ANOVA, Kruskal–-Wallis test. Mean ± SD is shown. Scale bar unit: μm.
Fig. 6
Fig. 6. In vivo PGRN blockade restores tumor MHCI expression that is spatially associated with increased CD8 cells.
a IHC of MHCI marker H-2Db and MHCII in CKP tumors treated with or without PGRN Ab or mIg. ctrl: n = 5; mIg: n = 10; PGRN Ab (PAb): n = 8. The right panels show the percentages of positive cells in the whole tumor. One-way ANOVA, Kruskal–Wallis test. Mean ± SD is shown. b mIF of PGRN (yellow), MHCI (green), CD8 (purple) and PanCK (red) in PGRN Ab-treated CKP tumors (n = 8). Intratumoral heterogeneity of PGRN expression was observed, in which PGRN+ and PGRN regions were depicted in the representative tumor. PGRN and MHCI show opposite staining patterns in the PGRN Ab-treated tumor. c mIF showing the differential MHCI and CD8 expression in PGRN+ and PGRN tumor regions. (n = 8 PAb-treated CKP tumors). Representative images are shown. Scale bar unit: μm.
Fig. 7
Fig. 7. In vitro PGRN blockade promotes CD8 antitumor cytotoxicity via MHCI regulation.
a Genetic strategy to induce spatially and temporally controlled GP33 expression by tamoxifen-mediated activation of CreERT2 in pancreatic cells harboring mutant KrasG12D and loss of Tp53. Ptf1awt/flp; Kraswt/FSF-G12D; p53frt/frt (FKP) mice crossed to Gt(ROSA)26Sortm3(CAG-Cre/ERT2)Das (R26FSF-CAG−CreERT2) and Gt(ROSA)26SortmloxP-STOP-loxP-GP-IRES-YFP (R26LSL-GP) strains to generate FKPC2GP mice. b Experimental setup for co-culture of GP82, LCMV-gp33-expressing cell line derived from FKPC2GP tumor, and the gp33-reactive T cells isolated from the spleen of P14-TCR-Tg mice. c LCMV-gp33 (GP) expression in GP82 cells treated with tamoxifen (25 μM) or vehicle control DMSO for 2 days was assessed by flow cytometry (n = 4 independent experiments). Two-tailed Mann–Whitney test. Tam: Tamoxifen. d Cellular PGRN level in GP82 cells treated with or without PGRN Ab or mIg (100 μg/ml) was assessed by flow cytometry (n = 4 independent experiments). One-way ANOVA, Kruskal–Wallis test. e Surface expression of MHCI marker H-2Db on GP82 cells treated with or without PGRN Ab or mIg (100 μg/ml) was assessed by flow cytometry (n = 6 independent experiments). One-way ANOVA, Kruskal–Wallis test. f IF staining of MHCI marker H-2Db of GP82 upon treatment with or without PGRN Ab or mIg (100 μg/ml). White arrowheads indicate the membraneous staining of MHCI. (n = 3 independent experiments). Representative images are shown. g Microscopic images of GP82 cells and LCMV-gp33-reactive T cells (CFSE-labeled, green) after 2 days of co-culture. When anti-MHCI (H-2Db) neutralizing antibody (MHCI Ab, MAb) was included in the treatment, MHCI Ab was added 1 h after PGRN Ab (PAb) treatment. T cells were then added 1 h after MHCI Ab treatment. White arrowheads indicate T-cell clusters accumulated at GP82 cells. (n = 6 independent experiments). Representative images are shown. h Cytotoxicity level (PI+ %) of GP82 cells upon co-culture with LCMV-gp33-reactive T cells (n = 6 independent experiments performed with LCMV-gp33-reactive T cells isolated from six different mice). T: T cells; Tu: GP82 tumor cells; Tu*GP: LCMV-gp33-induced GP82 tumor cells; PAb: PGRN Ab (100 μg/ml); MAb: MHCI Ab (100 μg/ml). One-way ANOVA, Kruskal–Wallis test. For PAb vs Mab: Two-tailed Mann–Whitney test. i Percentage of CD8+ cells that are positive for cytotoxic markers granzyme B (GzmB), TNF, and IFNg (% in total T cells) assessed by flow cytometer (n = 6 independent experiments performed with LCMV-gp33-reactive T cells isolated from six different mice). One-way ANOVA, Kruskal–Wallis test. For PAb vs Mab: Two-tailed Mann–Whitney test. Mean + SD are shown. MFI mean fluorescence intensity. Scale bar unit: μm.
Fig. 8
Fig. 8. In vivo PGRN blockade promotes antigen-specific T-cell cytotoxicity against tumors in orthotopic FKPC2GP model.
a Timeline for treatment of anti-PGRN antibody (PAb) or mIg (50 mg/kg) in an orthotopic model of GP82 cells in C57BL/6 J mice. b Tumors and spleens of mIg-treated (n = 4) and PGRN Ab-treated (n = 4) mice with orthotopic GP82 transplantation and intravenous injection of LCMV-gp33-reactive T cells freshly isolated from P14-TCR-Tg mice. c Tumor growth was assessed by ultrasound imaging and presented as a fold change in tumor volume before and after PGRN Ab (PAb) or mIg treatment started. d Tumors were digested into disaggregated cells and stained for T-cell infiltration. Flow cytometric analysis showing the percentage of tumor-infiltrating T (CD3+) cells and the exogenously injected LCMV-gp33-reactive (CD45.1+) T cells, in tumors treated with PGRN Ab (n = 4) or mIg (n = 4). Two-tailed Mann–Whitney test. e Flow cytometric analysis showing the expression of cytotoxic markers granzyme B (GzmB), TNF, and IFNg on CD3+ T cells in tumors with PGRN Ab (n = 4) or mIg (n = 4). Two-tailed Mann–Whitney test. f IHC staining of PGRN, MHCI marker H-2Db, CD8, GzmB, and cleaved caspase 3 (Cl Casp3) in orthotopic GP82 tumors with PGRN Ab (n = 4) or mIg (n = 4). The lower panels how the percentages of positive cells in the whole tumors quantified by Definiens. Two-tailed Mann–Whitney test. Mean ± SD is shown. Scale bar unit: μm.

References

    1. Nielsen SR, et al. Macrophage-secreted granulin supports pancreatic cancer metastasis by inducing liver fibrosis. Nat. Cell Biol. 2016;18:549–560. - PMC - PubMed
    1. Quaranta V, et al. Macrophage-derived granulin drives resistance to immune checkpoint inhibition in metastatic pancreatic cancer. Cancer Res. 2018;78:4253–4269. - PMC - PubMed
    1. Cenik B, Sephton CF, Kutluk Cenik B, Herz J, Yu G. Progranulin: a proteolytically processed protein at the crossroads of inflammation and neurodegeneration. J. Biol. Chem. 2012;287:32298–32306. - PMC - PubMed
    1. Cheung ST, Cheung PF, Cheng CK, Wong NC, Fan ST. Granulin-epithelin precursor and ATP-dependent binding cassette (ABC)B5 regulate liver cancer cell chemoresistance. Gastroenterology. 2011;140:344–355. - PubMed
    1. Cheung ST, et al. Granulin-epithelin precursor overexpression promotes growth and invasion of hepatocellular carcinoma. Clin. Cancer Res. 2004;10:7629–7636. - PubMed

Publication types

MeSH terms