. 2022 Jan 10;13(1):28.
doi: 10.1038/s41467-021-27579-9.

The 2018 European heatwave led to stem dehydration but not to consistent growth reductions in forests

Roberto L Salomón #  1   2 Richard L Peters #  1   3 Roman Zweifel  3 Ute G W Sass-Klaassen  4 Annemiek I Stegehuis  5   6 Marko Smiljanic  7 Rafael Poyatos  8   9 Flurin Babst  10   11 Emil Cienciala  12   13 Patrick Fonti  3 Bas J W Lerink  14 Marcus Lindner  5 Jordi Martinez-Vilalta  8   9 Maurizio Mencuccini  8   15 Gert-Jan Nabuurs  16   14 Ernst van der Maaten  17 Georg von Arx  3 Andreas Bär  18 Linar Akhmetzyanov  16 Daniel Balanzategui  19   20 Michal Bellan  13   21 Jörg Bendix  22 Daniel Berveiller  23 Miroslav Blaženec  24 Vojtěch Čada  6 Vinicio Carraro  25 Sébastien Cecchini  26 Tommy Chan  27 Marco Conedera  28 Nicolas Delpierre  23 Sylvain Delzon  29 Ľubica Ditmarová  24 Jiri Dolezal  30   31 Eric Dufrêne  23 Johannes Edvardsson  32 Stefan Ehekircher  33 Alicia Forner  34   35 Jan Frouz  36 Andrea Ganthaler  18 Vladimír Gryc  37 Aylin Güney  38   39 Ingo Heinrich  19   20   40 Rainer Hentschel  41 Pavel Janda  6 Marek Ježík  24 Hans-Peter Kahle  42 Simon Knüsel  28 Jan Krejza  13   21 Łukasz Kuberski  43 Jiří Kučera  44 François Lebourgeois  45 Martin Mikoláš  6 Radim Matula  6 Stefan Mayr  45 Walter Oberhuber  45 Nikolaus Obojes  46 Bruce Osborne  47   48 Teemu Paljakka  27 Roman Plichta  49 Inken Rabbel  50 Cyrille B K Rathgeber  3   45 Yann Salmon  27   51 Matthew Saunders  52 Tobias Scharnweber  7 Zuzana Sitková  53 Dominik Florian Stangler  42 Krzysztof Stereńczak  54 Marko Stojanović  13 Katarína Střelcová  55 Jan Světlík  13   21 Miroslav Svoboda  6 Brian Tobin  48   56 Volodymyr Trotsiuk  3   6 Josef Urban  49   57 Fernando Valladares  35 Hanuš Vavrčík  37 Monika Vejpustková  58 Lorenz Walthert  3 Martin Wilmking  7 Ewa Zin  43   59 Junliang Zou  60 Kathy Steppe  61
Affiliations

The 2018 European heatwave led to stem dehydration but not to consistent growth reductions in forests

Roberto L Salomón et al. Nat Commun. .

Abstract

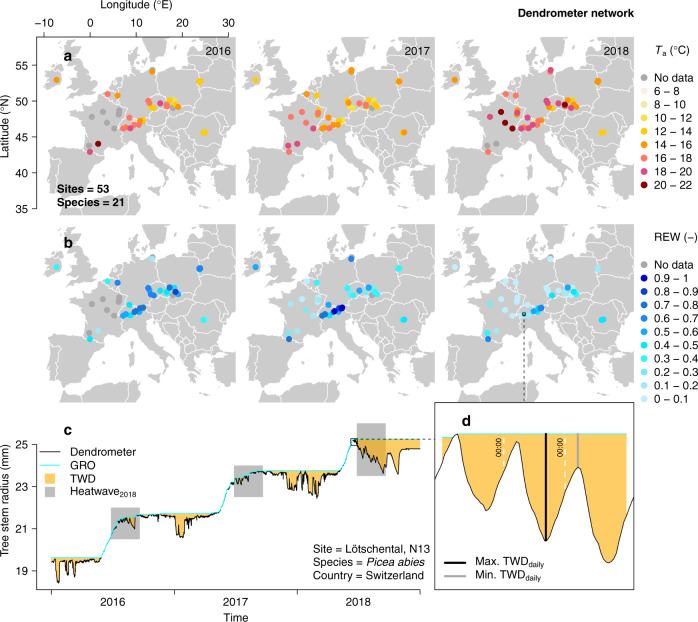
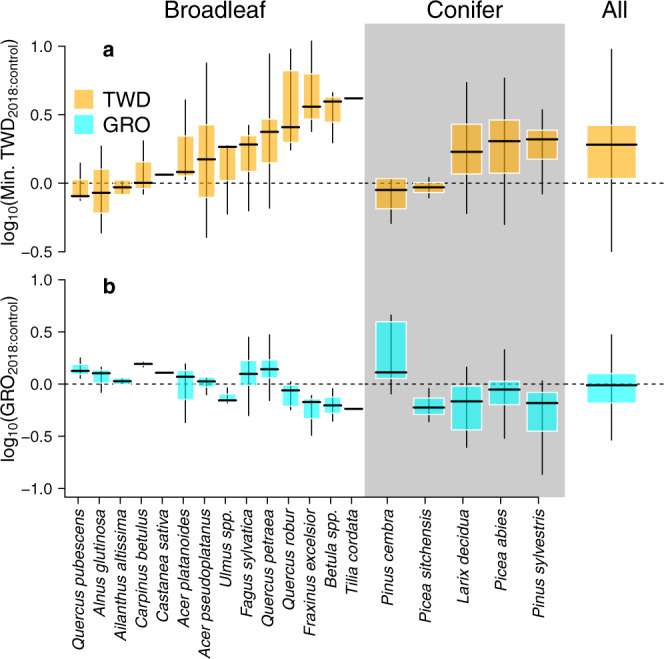
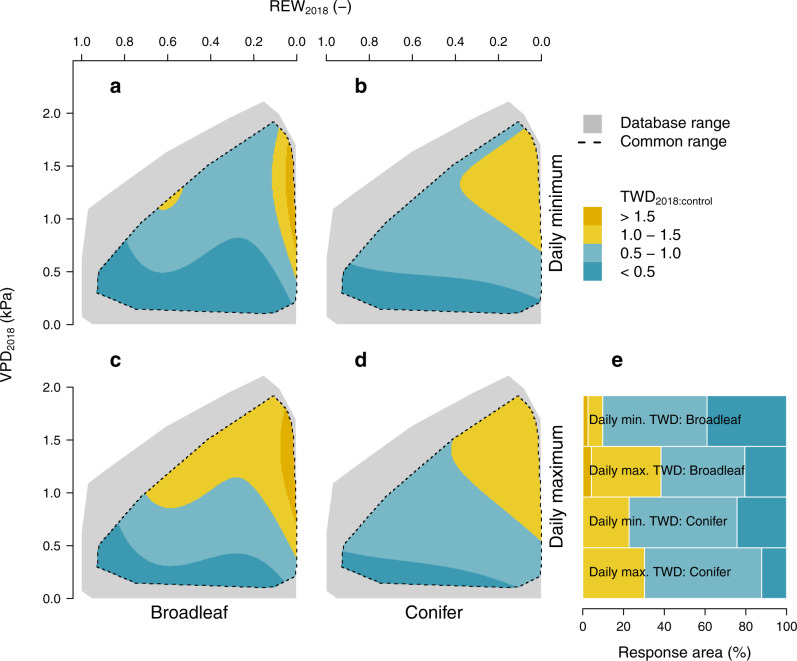
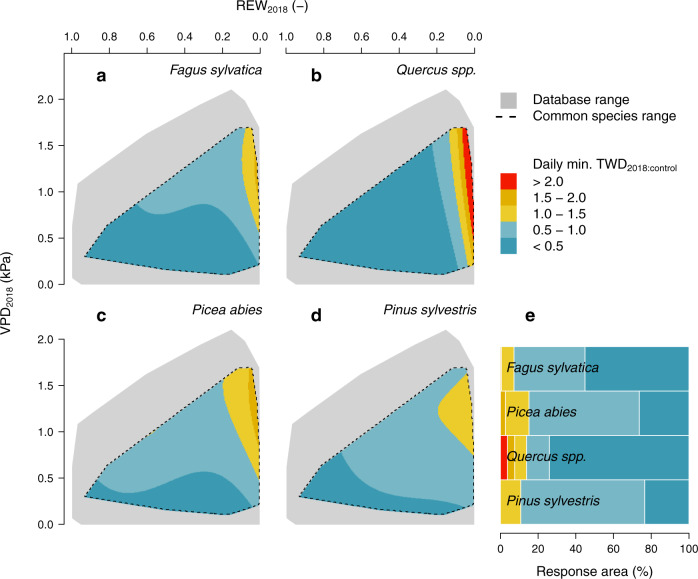
Heatwaves exert disproportionately strong and sometimes irreversible impacts on forest ecosystems. These impacts remain poorly understood at the tree and species level and across large spatial scales. Here, we investigate the effects of the record-breaking 2018 European heatwave on tree growth and tree water status using a collection of high-temporal resolution dendrometer data from 21 species across 53 sites. Relative to the two preceding years, annual stem growth was not consistently reduced by the 2018 heatwave but stems experienced twice the temporary shrinkage due to depletion of water reserves. Conifer species were less capable of rehydrating overnight than broadleaves across gradients of soil and atmospheric drought, suggesting less resilience toward transient stress. In particular, Norway spruce and Scots pine experienced extensive stem dehydration. Our high-resolution dendrometer network was suitable to disentangle the effects of a severe heatwave on tree growth and desiccation at large-spatial scales in situ, and provided insights on which species may be more vulnerable to climate extremes.


Conflict of interest statement

The authors declare no competing interests.

Figures

Fig. 1
Fig. 1. Climatic conditions during the 2018 heatwave period and dendrometer network.
a, b Spatial distribution of dendrometer sites and their respective mean atmospheric temperature (Ta in °C) and relative extractable water (REW) during the 2018 heatwave timeframe (day of year 208 until 264) for 2016–2018. Sites with incomplete dendrometer time series data are indicated with grey dots. c Tree stem radius monitored at the Swiss Lötschental (site N13) for a Picea abies (L.) Karst. tree. The period corresponding to the 2018 heatwave is shown in all three years (defined as Heatwave2018), in addition to tree water deficit (TWD) and extracted growth (GRO). d Inset of three days of tree stem radius monitored for the P. abies tree, where the concept of daily minimum and maximum TWD is shown (Max. TWDdaily and Min. TWDdaily, respectively).
Fig. 2
Fig. 2. Species-specific ratios of tree water deficit (TWD) during the 2018 heatwave and 2018 annual growth (GRO) relative to control years (2016–2017).
a, b Boxplots of broadleaf and conifer minimum tree water deficit (min. TWD2018:control; a) and annual radial stem growth (GRO2018:control; b) in response to the 2018 heatwave relative to control years. Log transformed ratios are shown to linearise and normalise the response metric. log10(TWD2018:control) above zero indicates a larger shrinkage was registered during the 2018 heatwave compared to the control years, whereas log10(GRO2018:control) near zero indicates that stem growth in 2018 was similar to that in control years. Centerlines, box limits, and whiskers represent the median, upper and lower quartiles, and extremes excluding outliers (those further than the 1.5x interquartile range). n = 175 tree stems over 37 sites.
Fig. 3
Fig. 3. Response of tree water deficit (TWD) ratio to vapor pressure deficit (VPD, kPa) and relative extractable water (REW, unitless [-]) of broadleaf (a, c) and conifer (b, d) species in the hydrometeorological space.
ad Linear-mixed effect model output of the ratio of the daily minimum (a, b) and maximum (c, d) TWD during the 2018 heatwave compared to the 95th percentile of the control period (TWD2018:control), while VPD2018 and REW2018 refer to the absolute values during the 2018 heatwave. TWD2018:control above 1 indicates that a larger shrinkage was registered during the 2018 heatwave relative to the control period. From the hydrometeorological space range of the entire database (indicated in grey), models have been adjusted for the common climatic range of broadleaf and conifer species only (indicated with dotted lines). e Bars indicate the percentage of the hydrometeorological space covering different ranges of TWD2018:control values (see legend).
Fig. 4
Fig. 4. Species-specific response of tree water deficit (TWD) ratio to vapour pressure deficit (VPD) and relative extractable water (REW) in the hydrometeorological space for most abundant and economically valuable tree species in Europe.
ad, Linear-mixed effect model output of the ratio of the daily minimum TWD during the 2018 heatwave compared to the 95th percentile of the control period (TWD2018:control), while VPD2018 and REW2018 refer to the absolute values during 2018 heatwave. All trees of Fagus sylvatica, Quercus spp. (Q. robur/petraea), Picea abies and Pinus sylvestris within the database are considered. From the hydrometeorological space range of the entire database (indicated in grey), models have been adjusted for the common climatic range of the selected species only (indicated with dotted lines; see Supplementary Fig. 4 for the climate range of each species). e Bars indicate the percentage of the hydrometeorological space covering different ranges of min. TWD2018:control values (see legend).

References

    1. Rahmstorf S, Coumou D. Increase of extreme events in a warming world. Proc. Natl Acad. Sci. 2011;108:17905–17909. - PMC - PubMed
    1. Barriopedro D, Fischer EM, Luterbacher J, Trigo RM, Garcia-Herrera R. The Hot Summer of 2010: Redrawing the temperature record map of Europe. Science. 2011;332:220–224. - PubMed
    1. Fischer EM, Knutti R. Detection of spatially aggregated changes in temperature and precipitation extremes. Geophys. Res. Lett. 2014;41:547–554.
    1. Della-Marta PM, Haylock MR, Luterbacher J, Wanner H. Doubled length of western European summer heat waves since 1880. J. Geophys. Res. 2007;112:D15103.
    1. Zscheischler J, et al. Future climate risk from compound events. Nat. Clim. Chang. 2018;8:469–477.

Publication types