. 2022 Jan 10;13(1):153.
doi: 10.1038/s41467-021-27649-y.

Dynamics of spike-and nucleocapsid specific immunity during long-term follow-up and vaccination of SARS-CoV-2 convalescents

Affiliations

Dynamics of spike-and nucleocapsid specific immunity during long-term follow-up and vaccination of SARS-CoV-2 convalescents

Nina Koerber et al. Nat Commun. .

Abstract

Anti-viral immunity continuously declines over time after SARS-CoV-2 infection. Here, we characterize the dynamics of anti-viral immunity during long-term follow-up and after BNT162b2 mRNA-vaccination in convalescents after asymptomatic or mild SARS-CoV-2 infection. Virus-specific and virus-neutralizing antibody titers rapidly declined in convalescents over 9 months after infection, whereas virus-specific cytokine-producing polyfunctional T cells persisted, among which IL-2-producing T cells correlated with virus-neutralizing antibody titers. Among convalescents, 5% of individuals failed to mount long-lasting immunity after infection and showed a delayed response to vaccination compared to 1% of naïve vaccinees, but successfully responded to prime/boost vaccination. During the follow-up period, 8% of convalescents showed a selective increase in virus-neutralizing antibody titers without accompanying increased frequencies of circulating SARS-CoV-2-specific T cells. The same convalescents, however, responded to vaccination with simultaneous increase in antibody and T cell immunity revealing the strength of mRNA-vaccination to increase virus-specific immunity in convalescents.


Conflict of interest statement

The authors declare no competing interests.

Figures

Fig. 1
Fig. 1. Dynamics of anti-SARS-CoV-2 IgG levels and virus-neutralization activity after mild SARS-CoV-2 infection.
a Anti-SARS-CoV-2 (nucleocapsid-specific) IgG levels determined by CLIA from 4554 health care workers (blue—seronegative individuals, n = 4446; red—seropositive individuals, n = 108) at month 2 after infection. Data are shown as median (55.93 and 0.40) with box bounds at 25% (33.02 and 0.26) and 75% percentile (83.04 and 0.69), whiskers show maxima (113.8 and 0.06) and minima (10.01 and 4.90). b Paired analysis of anti-SARS-CoV-2 nucleocapsid-specific IgG titers (n = 91). c Change (Δ) in anti-SARS-CoV-2 IgG titers at month 5 (y-axis) compared to initial anti-SARS-CoV-2 IgG titers at month 2 (x-axis); LLOD—lower limit of detection. d Paired analysis of virus-neutralization activity (n = 86) measured as 50% inhibition of viral infection in cell culture (dilution 1:x). Nine convalescents had no detectable and 12 had only low virus-neutralization activity. LLOQ lower limit of quantification, ULOQ upper limit of quantification. e Change (Δ) in cell culture virus-neutralization activity (as log2) at month 5 (y-axis) compared to virus-neutralization activity at month 2 (x-axis), results from 21 individuals were below the quantification limit and are not shown but included in the statistical analysis. f Reporting of symptoms (n = 68) or no symptoms (n = 18) in convalescents and virus-neutralization activity. Data are shown as median (138.70 and 49.45) with box bounds at 25% (33.40 and 1.00) and 75% percentile (634.70 and 201.30), whiskers show maxima (2560 and 604.40) and minima (1.00 for both). Statistical analyses by two-sided Wilcoxon signed-rank test (b, d), two-sided Mann–Whitney test (f), Spearman correlation and linear regression (c, e); rs denotes Spearman correlation coefficient; *p < 0.05; ****p < 0.0001.
Fig. 2
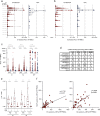
Fig. 2. IL-2 dominated spike-specific CD4 T cell responses in convalescents.
a, b Ex vivo Fluorospot analysis revealing the frequencies of spike-reactive mono- and polyfunctional cytokine-secreting cells (spot-forming cells/SFCs per 106 PBMCs from convalescents (red) or naïve individuals (blue) at month 5. c, d Total frequencies of spike-reactive cytokine-expressing cells (shown as median ± SD), CEF (CMV/EBV/Flu) peptide pool as a control in convalescents (red, n = 88) or naïve individuals (blue, n = 52). e Ex vivo detection of the frequencies of CD4 and CD8 T cells of convalescents (n = 9) by intracellular cytokine staining and flow cytometry. f Correlation of the frequencies of nucleocapsid- (NCAP) and S1- and S2-reactive T cells determined by Fluorospot analysis in convalescents at month 5. Statistical analyses by two-sided Mann–Whitney, two-sided Wilcoxon signed-rank tests and Spearman correlation and linear regression (c, e, f); rs denotes Spearman correlation coefficient; *p < 0.05; **p < 0.01; ****p < 0.0001.
Fig. 3
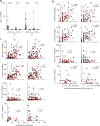
Fig. 3. Frequencies of IL-2 and IFNγ-secreting but not IL-4 secreting cells correlate with virus-neutralization activity in SARS-CoV-2 convalescents.
a Frequencies of spike-reactive IL-4- or IL-5-secreting cells in convalescents (red, n = 23) or naïve individuals (blue, n = 6). b, c Correlation of frequencies of S1- or S2-reactive IFNγ-, IL-2-, TNF-, or IL-4-secreting cells with virus-neutralization activity or anti-SARS-CoV-2 IgG in convalescents. Statistical analyses by two-sided Mann–Whitney test (a), Spearman correlation and linear regression (b, c); rs denotes Spearman correlation coefficient; n.s. denotes not significant; ****p < 0.0001.
Fig. 4
Fig. 4. Persistence of polyfunctional S1- and S2-reactive IFNγ- and IL-2-secreting cells up to 11 months after SARS-CoV-2 infection.
(a, b) frequencies of spike-reactive cytokine-secreting cells in convalescents (n = 32) at month 5 and month 11 after SARS-CoV-2 infection. c Frequencies of CEF-reactive cytokine-secreting cells in convalescents (n = 32) at month 5 and month 11 after SARS-CoV-2 infection. d Heatmap revealing frequencies of convalescents bearing S1-reactive mono- or polyfunctional cytokine-secreting cells at month 5 and month 11 after SARS-CoV-2 infection. e Fluorospot analysis revealing the frequencies of spike-reactive mono- and polyfunctional cytokine-secreting cells (SFCs per 106 PBMCs) from convalescents (n = 49) at month 11 after SARS-CoV-2 infection. Statistical analyses by two-sided Wilcoxon signed-rank tests (ac, e); n.s. denotes not significant; **p < 0.01; ***p < 0.001.
Fig. 5
Fig. 5. Rapid induction of polyfunctional IL-2-secreting T cells in convalescents and naïve individuals after BNT162b2 mRNA vaccination.
(a) frequencies of spike-reactive cytokine-secreting cells in convalescents (red, n = 50 (m11), n = 54 (vacc), n = 23 (boost)), and naïve individuals (blue, n = 39 (m11), n = 49 (vacc), n = 40 (boost)) at month 11 after SARS-CoV-2 infection, two weeks after BNT162b2 mRNA prime vaccination (vacc) and 2 weeks after boost vaccination (boost). b Heatmap revealing frequencies of individuals bearing S1-reactive mono- or polyfunctional cytokine-secreting cells; convalescents (c), naïve individuals (n). c Median and standard deviation for S1-reactive cytokine-secreting cells. d, e S1-reactive IL-2 and IFNγ-producing CD4 and CD8 T cells in convalescents (red, n = 19) and naïve individuals (blue, n = 31) determined directly ex vivo by flow cytometry using intracellular cytokine staining. Statistical analyses by ANOVA, two-sided Mann–Whitney and two-sided Wilcoxon signed-rank tests (a, e). n.s. denotes not significant; *p < 0.05; **p < 0.01; ****p < 0.0001.
Fig. 6
Fig. 6. Low responder convalescents respond to prime/boost BNT162b2 mRNA vaccination.
(a) surrogate virus-neutralization after prime and boost vaccination in convalescents (red, n = 77 (vacc), n = 28 (boost)), low responder convalescents (gray, n = 5) and naïve individuals (blue, n = 51 (vacc), n = 49 (boost)). Data are shown as median (vacc: 2099 and 19, boost: 2022 and 1605) with box bounds at 25% (vacc: 1813 and 12, boost: 1742 and 1068) and 75% percentile (vacc: 2424 and 46, boost: 2414 and 2005), whiskers show maxima (vacc: 3000 and 531, boost: 2963 and 3000) and minima (vacc: 8 and 4, boost: 980 and 53). b Surrogate virus-neutralization of low responder convalescents (light gray, n = 5) and after prime and boost BNT162b2 mRNA vaccination compared to a cohort of 455 naïve individuals (blue) including low responders to vaccination (dark gray, n = 4). Data are shown as median (vacc: 13 and 33, boost: 1709 and 1723) with box bounds at 25% (vacc: 8 and 18, boost: 1126 and 1376) and 75% percentile (vacc: 47 and 68, boost: 1785 and 1981), whiskers show maxima (vacc: 48 and 764, boost: 1795 and 3000) and minima (vacc: 8 and 1, boost: 980 and 3). c Cell culture virus-neutralization activity at month 2 after SARS-CoV-2 infection in serum of convalescents (n = 81) compared to those with low response to vaccination (n = 5). Data is shown as median (136.4) with box bounds at 25% (34.2) and 75% percentile (479.5), whiskers show maximum (2560) and minimum (1.0). dg Frequencies of spike-reactive, nucleocapsid-reactive or CEF-reactive cytokine-secreting cells in convalescents (red, n = 83 (d, e, g) and n = 16 (f)) and low responder convalescents (gray, n = 5) at month 5 after infection. h Frequencies of spike-reactive cytokine-secreting cells at month 11 after infection, 2 weeks after prime (vacc) and 2 weeks after boost (boost) BNT162b2 mRNA vaccination; convalescents (red, n = 45 (m11), n = 49 (vacc), n = 19 (boost)), low responder convalescents (gray, n = 5 at all time points) and naïve individuals (blue, n = 39 (m11), n = 49 (vacc), n = 40 (boost)). Statistical analyses by ANOVA, two-sided Mann–Whitney and two-sided Wilcoxon signed-rank tests (a, b, dh). n.s. denotes not significant; *p < 0.05; **p < 0.01; ***p < 0.001; ****p < 0.0001.
Fig. 7
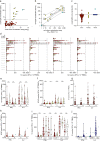
Fig. 7. Disparate increase in virus-neutralization activity but not spike-reactive T cells in convalescents during long-term follow-up compared to infection and vaccination.
a Change (Δ) in cell culture virus-neutralization activity and surrogate virus-neutralization activity in convalescents (red, n = 78), and convalescents with more than 3 log2 change in cell culture neutralization activity (yellow, n = 6) (detected in samples obtained at months 5, 8, and 11) or in a recently SARS-CoV-2 infected naïve individual (1/53) (turquoise, n = 1). b Virus-neutralization activities at two-time points in convalescents identified in (a); a—denotes values at month 5 or 8, and b—denotes values at month 11 after initial infection. c Change (Δ) in nucleocapsid-specific anti-SARS-CoV-2 IgG levels in individuals from (a) and naïve individuals (blue, n = 52). d Frequencies of S1/S2-reactive mono- and polyfunctional cytokine-secreting cells in convalescents from (a, yellow) at month 5 (left panel) and at month 11 (right panel) as well as convalescents without a surge in virus-neutralization activity (red). e Total frequencies of S1-reactive IFNγ- and IL-2-secreting cells from (d). e, f Frequencies of spike-reactive or nucleocapsid-reactive cytokine-secreting cells in convalescents (red, n = 32 (month 5), n = 30 (month 11)) or convalescents with increased virus-neutralization activity (yellow, n = 6). g, h frequencies of spike- and nucleocapsid-reactive cytokine-secreting cells in a recently infected naive individual from (a, turquoise) and convalescents (red), at months 5 and 11 (after infection of the single individual). i, j Frequencies of S1-reactive IFNγ- and IL-2-secreting cells before vaccination (month 11), 2 weeks after vaccination (vacc) and 2 weeks after boost vaccination (boost) in convalescents (red, n = 44 (month 11), n = 48 (vacc), n = 20 (boost)) and convalescents with increased virus-neutralization activity (yellow, n = 6 at all time points), and in naïve individuals (blue, n = 39 (month 11), n = 49 (vacc), n = 40 (boost)), and an infected individual (turquoise, n = 1). Statistical analyses by ANOVA, two-sided Mann–Whitney and two-sided Wilcoxon signed-rank tests (e, f, i). n.s. denotes not significant; *p < 0.05.

References

    1. Zhu N, et al. A novel coronavirus from patients with pneumonia in China, 2019. N. Engl. J. Med. 2020;382:727–733. - PMC - PubMed
    1. Zhou P, et al. A pneumonia outbreak associated with a new coronavirus of probable bat origin. Nature. 2020;579:270–273. doi: 10.1038/s41586-020-2012-7. - DOI - PMC - PubMed
    1. Andersen KG, Rambaut A, Lipkin WI, Holmes EC, Garry RF. The proximal origin of SARS-CoV-2. Nat. Med. 2020;26:450–452. - PMC - PubMed
    1. Gandhi RT, Lynch JB, Del Rio C. Mild or moderate Covid-19. The. N. Engl. J. Med. 2020;383:1757–1766. - PubMed
    1. Berlin DA, Gulick RM, Martinez FJ. Severe Covid-19. N. Engl. J. Med. 2020;383:2451–2460. - PubMed

Publication types

MeSH terms