. 2022 Jan 10;13(1):128.
doi: 10.1038/s41467-021-27595-9.

Robust and durable serological response following pediatric SARS-CoV-2 infection

Affiliations

Robust and durable serological response following pediatric SARS-CoV-2 infection

Hanna Renk et al. Nat Commun. .

Abstract

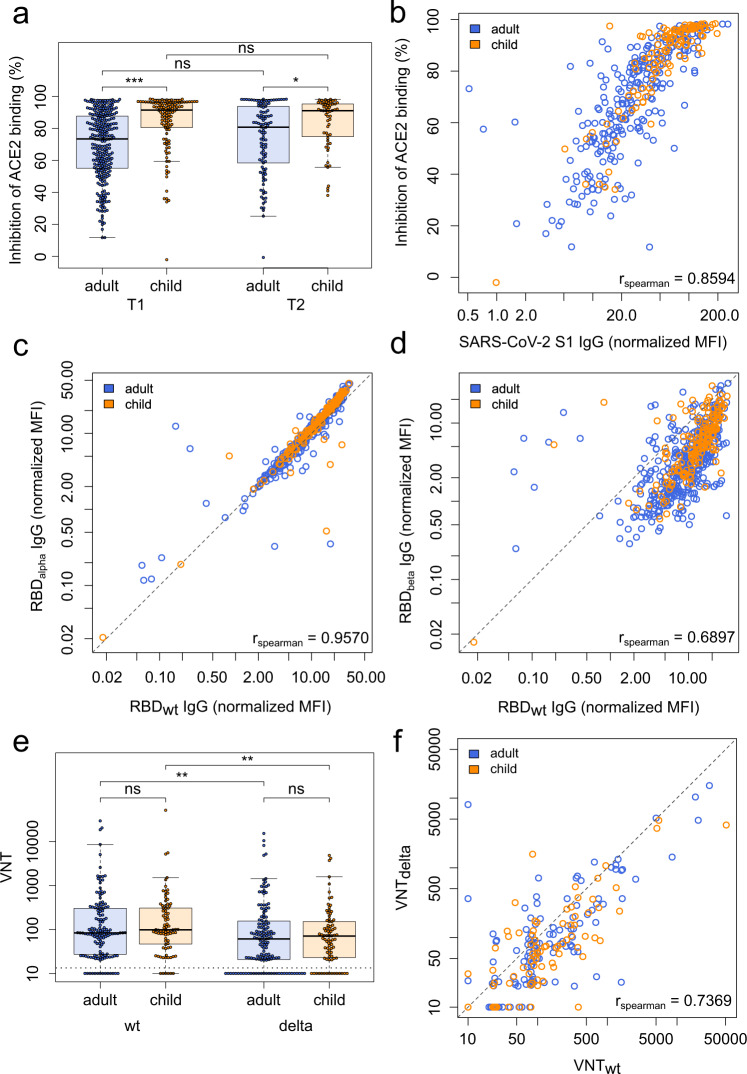
The quality and persistence of children's humoral immune response following SARS-CoV-2 infection remains largely unknown but will be crucial to guide pediatric SARS-CoV-2 vaccination programs. Here, we examine 548 children and 717 adults within 328 households with at least one member with a previous laboratory-confirmed SARS-CoV-2 infection. We assess serological response at 3-4 months and 11-12 months after infection using a bead-based multiplex immunoassay for 23 human coronavirus antigens including SARS-CoV-2 and its Variants of Concern (VOC) and endemic human coronaviruses (HCoVs), and additionally by three commercial SARS-CoV-2 antibody assays. Neutralization against wild type SARS-CoV-2 and the Delta VOC are analysed in a pseudotyped virus assay. Children, compared to adults, are five times more likely to be asymptomatic, and have higher specific antibody levels which persist longer (96.2% versus 82.9% still seropositive 11-12 months post infection). Of note, symptomatic and asymptomatic infections induce similar humoral responses in all age groups. SARS-CoV-2 infection occurs independent of HCoV serostatus. Neutralization responses of children and adults are similar, although neutralization is reduced for both against the Delta VOC. Overall, the long-term humoral immune response to SARS-CoV-2 infection in children is of longer duration than in adults even after asymptomatic infection.


Conflict of interest statement

N.S.M. was a speaker at Luminex user meetings in the past. The Natural and Medical Sciences Institute at the University of Tübingen is involved in applied research projects as a fee for services with Luminex. The other authors report no competing interests.

Figures

Fig. 1
Fig. 1. Children have a significantly higher humoral response to SARS-CoV-2 than adults.
The humoral response generated following SARS-CoV-2 household exposure with seroconversion was examined using MULTICOV-AB. Children (orange, n = 181) produced significantly more antibodies against the Spike (a p = 6.00 x 10−6), Receptor Binding Domain (RBD) (b p = 2.86 x 10−6), S1 domain (c p = 3.00 x 10−14) and nucleocapsid (NC) (e p = 1.76 x 10−2) than adults (blue, n = 414). There was no significant difference for either the S2 domain (d p = 0.66) or the N-terminal domain of the nucleocapsid (NC NTD) (f p = 0.40). Only samples from T1 with a seropositive status (see Methods) are shown. Box and whisker plots with the box representing the median, 25th and 75th percentiles, while whiskers show the largest and smallest non-outlier values. Outliers were identified using upper/lower quartile ±1.5 times IQR. Statistical significance was calculated using Mann–Whitney-U (two-sided) with significance defined as being *<0.05, ***<0.001. Values >0.05 were defined as non-significant (ns). MFI Median Fluorescence Intensity.
Fig. 2
Fig. 2. SARS-CoV-2 infections in children are more often asymptomatic than in adults, although dysgeusia is a good indicator of SARS-CoV-2 infection in both adults and children.
Box and whisker plots showing that there is no difference in antibody response between asymptomatic and symptomatic SARS-CoV-2 infections in adults (a in blue, p = 0.684, n = 414) or children (b in orange, p = 0.712, n = 181), as assessed by MULTICOV-AB. The receptor binding domain (RBD) is shown as an example, all other SARS-CoV-2 antigens are shown in Fig. S7. Boxes represent the median, 25th and 75th percentiles, while whiskers show the largest and smallest non-outlier values. Outliers were identified using upper/lower quartile ±1.5 times IQR. Statistical significance was calculated using Mann–Whitney-U (two-sided). ns indicates a non-significant p value >0.05. The four symptoms reported in this study were then examined for their frequency within the study population (c), with all symptoms more commonly reported in seropositive adults (in blue) than seropositive children (in orange). Each symptom was then examined for its predictive ability to indicate SARS-CoV-2 infection (d), with dysgeusia a strong predictor in both adults (dark blue, 84.2%) and children (dark orange, 87·5%). All other symptoms were poor predictors in children (fever 59.5%, cough 37.4%, diarrhea 54.6%) compared to adults (fever 85.8%, cough 75.0%, diarrhea 80.7%). Only samples from T1 were analyzed for this figure (n = 717 adults, 548 children). “+” indicates presence of the symptom “−“ indicates absence of the symptom. MFI Median Fluorescence Intensity.
Fig. 3
Fig. 3. Children and adults produce antibodies with equal neutralizing potential and their antibodies offer the same protection against Variants of Concern.
a Box and whisker plot showing that antibodies produced by children (orange, n = 118) have a significantly higher inhibition of ACE2 binding than those produced by adults (blue, n = 267, p = 4.37 x 10−13) at T1 and T2 (p = 0.02, child n = 59, adult n = 106) as determined by the sVNT assay. Boxes represent the median, 25th and 75th percentiles, while whiskers show the largest and smallest non-outlier values. Outliers were identified using upper/lower quartile ±1.5 times IQR. Statistical significance was calculated using Mann–Whitney-U (two-sided) with *** indicating a p value < 0.001, * indicating a p value < 0.05, and ns indicating a non-significant p value > 0.05. To determine whether this was due to the higher titers in children, SARS-CoV-2 S1 humoral response was determined using MULTICOV-AB for T1 and plotted against the results of the sVNT assay (b). Spearman’s rank was calculated to measure the ordinal association between them, confirming that the increase in neutralization is due to higher titers. Protection against the Alpha (c) and Beta (d) VOCs was determined by MULTICOV-AB and plotted as a linear regression against the antibody binding response to the wild-type (wt) receptor binding domain (RBD), with Spearman’s rank calculated to measure the ordinal association. There was no difference in antibody response between children (n = 166, T1 samples only) and adults (n = 381, T1 samples only) for either variant. (e) Box and whisker plot showing reduced neutralization responses in both adults (blue, n = 142, p = 4.38 x 10−3) and children (orange, n = 83, p = 6.36 x 10−3) against Delta VOC as compared to WT as determined by a pseudotype virus assay (VNT). Boxes represent the median, 25th and 75th percentiles, while whiskers show the largest and smallest non-outlier values. Outliers were identified using upper/lower quartile ±1.5 times IQR. Statistical significance was calculated using Mann–Whitney-U (two-sided) with ** indicating a p value < 0·01 and ns indicating a non-significant value >0.05. Titers are given as serum dilution factor resulting in 50% pseudovirus neutralization (PVNT50). The dashed line represents the lower limit of detection. f Linear regression comparing wild-type (VNTwt) and delta (VNTdelta) neutralization responses with Spearman’s rank calculated to measure the ordinal association. ACE2 angiotensin-converting enzyme 2, MFI Median Fluorescence Intensity, (s)VNT (surrogate) Virus Neutralization Test, wt wild type.
Fig. 4
Fig. 4. HCoVs offer no protection against SARS-CoV-2, nor do they show a boost-back antibody response following SARS-CoV-2 infection.
Samples from households with a known index case (n = 971) were examined with MULTICOV-AB to determine whether the antibody response to endemic coronaviruses (HCoV) provides any protection against infection with SARS-CoV-2. Initial screening of the population showed that seroprevalence increases with age, although several samples were within the blank range of the HCoV assays, indicating the presence of naïve samples (a). Naïve samples were defined as those having less than one-tenth the mean antibody response (indicated by dotted line), with the majority of these samples occurring in children under the age of five. HCoV-OC43 is shown as an example, all other HCoVs can be found as Fig. S9. Boxes represent the median, 25th and 75th percentiles, while whiskers show the largest and smallest non-outlier values. Outliers were identified using upper/lower quartile ±1.5 times IQR. b Line graph showing the longitudinal response of these naïve samples from T1 to T2, with new infections in HCoV-OC43 shown in red. c Box and whisker plot showing there is no significant difference in HCoV-OC43 antibody response between SARS-CoV-2 seropositive and seronegative individuals, among either adults (blue, n = 440, p = 0.974) or children (orange, n = 436, p = 0·214). Boxes represent the median, 25th and 75th percentiles, while whiskers show the largest and smallest non-outlier values. Outliers were identified using upper/lower quartile ±1·5 times IQR. Statistical significance was calculated by Mann–Whitney-U (two-sided) with *** indicating a p value < 0·001 and ns indicating a p value > 0·05. d When comparing paired samples longitudinally within the SARS-CoV-2 seropositive subgroup, there was no increase in HCoV-OC43 S1 response in either adults (blue, n = 76) or children (orange, n = 103) following SARS-CoV-2 infection. Change in response is presented as log2-fold change from T1 to T2 and only samples with either log2-fold change greater than 1 or smaller than −1 are shown. Spearman’s rank was used to calculate the ordinal association between the change in response for HCoV-OC43 and SARS-CoV-2. The same figures for the endemic coronaviruses HCoV-NL63, HCoV-HKU1 and HCoV-229E can be found as Figs. S9, S11 and S12. HCoV human Coronavirus, MFI Median Fluorescence Intensity, S1 Spike S1 domain., S1 Spike S1.

References

    1. Sette A, Crotty S. Adaptive immunity to SARS-CoV-2 and COVID-19. Cell. 2021;184:861–880. doi: 10.1016/j.cell.2021.01.007. - DOI - PMC - PubMed
    1. Robbiani DF, et al. Convergent antibody responses to SARS-CoV-2 in convalescent individuals. Nature. 2020;584:437–442. doi: 10.1038/s41586-020-2456-9. - DOI - PMC - PubMed
    1. Dan JM, et al. Immunological memory to SARS-CoV-2 assessed for up to 8 months after infection. Science. 2021;371:eabf4063. doi: 10.1126/science.abf4063. - DOI - PMC - PubMed
    1. Wheatley AK, et al. Evolution of immune responses to SARS-CoV-2 in mild-moderate COVID-19. Nat. Commun. 2021;12:1162. doi: 10.1038/s41467-021-21444-5. - DOI - PMC - PubMed
    1. Seow J, et al. Longitudinal observation and decline of neutralizing antibody responses in the three months following SARS-CoV-2 infection in humans. Nat. Microbiol. 2020;5:1598–1607. doi: 10.1038/s41564-020-00813-8. - DOI - PMC - PubMed

Publication types

MeSH terms