. 2022 Jan 10;13(1):151.
doi: 10.1038/s41467-021-27666-x.

Functional dissection of inherited non-coding variation influencing multiple myeloma risk

Affiliations

Functional dissection of inherited non-coding variation influencing multiple myeloma risk

Ram Ajore et al. Nat Commun. .

Erratum in

  • Author Correction: Functional dissection of inherited non-coding variation influencing multiple myeloma risk.
    Ajore R, Niroula A, Pertesi M, Cafaro C, Thodberg M, Went M, Bao EL, Duran-Lozano L, Lopez de Lapuente Portilla A, Olafsdottir T, Ugidos-Damboriena N, Magnusson O, Samur M, Lareau CA, Halldorsson GH, Thorleifsson G, Norddahl GL, Gunnarsdottir K, Försti A, Goldschmidt H, Hemminki K, van Rhee F, Kimber S, Sperling AS, Kaiser M, Anderson K, Jonsdottir I, Munshi N, Rafnar T, Waage A, Weinhold N, Thorsteinsdottir U, Sankaran VG, Stefansson K, Houlston R, Nilsson B. Ajore R, et al. Nat Commun. 2022 Dec 13;13(1):7725. doi: 10.1038/s41467-022-35411-1. Nat Commun. 2022. PMID: 36513657 Free PMC article. No abstract available.

Abstract

Thousands of non-coding variants have been associated with increased risk of human diseases, yet the causal variants and their mechanisms-of-action remain obscure. In an integrative study combining massively parallel reporter assays (MPRA), expression analyses (eQTL, meQTL, PCHiC) and chromatin accessibility analyses in primary cells (caQTL), we investigate 1,039 variants associated with multiple myeloma (MM). We demonstrate that MM susceptibility is mediated by gene-regulatory changes in plasma cells and B-cells, and identify putative causal variants at six risk loci (SMARCD3, WAC, ELL2, CDCA7L, CEP120, and PREX1). Notably, three of these variants co-localize with significant plasma cell caQTLs, signaling the presence of causal activity at these precise genomic positions in an endogenous chromosomal context in vivo. Our results provide a systematic functional dissection of risk loci for a hematologic malignancy.


Conflict of interest statement

Authors T.O., O.M., G.H.H., G.T., G.L.N., K.G., I.J., T.R., U.T., and K.S. are employed by deCODE Genetics/Amgen Inc. The remaining authors declare no competing interests.

Figures

Fig. 1
Fig. 1. Screening assays to identify MM risk variants for transcriptional activity.
a Manhattan plot of the largest genome-wide association study on MM to date, a meta-analysis totaling 9974 MM cases and 247,556 controls of European ancestry. The 23 indicated loci associate with MM at P < 5 × 10−8. The 11q13.3 (CCND1) locus specifically associates with risk of t(11;14)[IGH/CCND1] translocation MM. Lead variants at each locus are detailed in Supplementary Table 1. b We employed MPRA to screen variants in high LD (r2 > 0.8) with MM lead variants for transcriptional activity. For each variant, we designed twelve 120-bp oligonucleotide sequences representing the reference and alternative alleles in six genomic contexts (positive and negative DNA strand × three sliding windows with the variant positioned at −20, 0, or +20 bp from the center). The synthesized oligonucleotides were coupled to a synthetic reporter gene with 20-nt random sequence barcodes 3′ of its open reading frame. c Sequencing of the final plasmid library identified 1.73 × 106 barcodes mapping to 12,378 of the 12,468 designed oligonucleotides. The histogram shows the numbers of barcodes representing each oligonucleotide (median 103). d Following transfection of the library into cell lines, the transcriptional activity of each construct was measured by quantifying the barcode representation in reporter mRNA relative to DNA by sequencing. Barcode activity was quantified as log2(1+#RNAi)/(1+#DNAi) where #RNAi and #DNAi are the read counts for barcode i normalized to counts per 10 million reads. We performed MPRA in three replicates in each cell line. The plot shows the correlation of barcode activity estimates between two L363 replicates.
Fig. 2
Fig. 2. Overarching analysis of screening data.
We performed MPRA in the MM plasma cell lines L363 and MOLP8. a Variant log2 scores for the L363 and MOLP8 screens. For each variant, log2 reflects the transcriptional activity of the alternative relative to the reference allele. Scores were calculated based on barcode activity estimates in all six genomic contexts (i.e., across both strands and all three sliding windows) and three replicates per cell line. Variants with strong effects (absolute log2 score >0.2) in either screen are indicated in red. Pearson r and two-sided P values are shown. b Calculating log2 scores using either positive-strand (x-axis) or negative-strand constructs (y-axis) for the same variant, we did not observe strand bias. c As an additional assay validation step, we carried out luciferase experiments for 20 variants, showing a significant positive correlation between the MPRA effect (x-axis) and the luciferase effect (y-axis). d g-chromVAR analysis of screened variants, weighted by their L363 log2 scores showed enrichment of variants with strong MPRA scores in genomic regions with accessible chromatin in plasma cells, consistent with our assay selecting variants with endogenous regulatory activity. e Numbers of significant variants with FDR <5% in the two cell lines. f Numbers of variants showing both FDR <5% and strong effects (absolute log2 score >0.2).
Fig. 3
Fig. 3. MPRA data for identified variants.
Individual MPRA barcode activity estimates for the eight variants in Table 1 also showed concordant plasma cell cis-eQTLs. The data have been grouped by allele (reference allele to the left; an alternative to the right), DNA strand (+ or −), and sliding window (variant at −20, 0, or +20 bp from the center of the 120-bp oligonucleotide representing the genomic context). Blue dots represent individual barcode activity estimates. The bottom, middle, and top of each box plot represent the 25th, 50th, and 75th percentiles. The whiskers represent the non-outlier minimum and maximum values, located at 1.5 times the interquartile range from the bottom and top of the box, respectively. The numbers by the brackets are P values for the two-sided Student’s t-test. The luciferase validation data for these eight variants are shown in Supplementary Fig. 4. The individual barcode activity estimates for MOLP8 cells, as well as individual barcode activity estimates for the other variants in Table 1, are shown in Supplementary Fig. 6.
Fig. 4
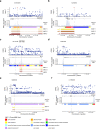
Fig. 4. Genomic context of identified putative causal variants.
Based on our functional screens, we identified eight putative causal variants (highlighted in red and with dashed lines) across six loci. The figure shows their association P values (Fig. 1a), with the lead SNP indicated as a triangle, along with ATAC-seq data for plasma cells (blue) and 11 ChromHMM states in the MM plasma cell line KMS11. We also generated PCHi-C data for the MM plasma cell lines KMS11 (yellow), KMS12 (orange), and MM1S (red), and identified chromatin looping interactions using the CHiCAGO tool. Interactions with −log10(CHiCAGO P score) ≥2 are shown. a At the SMARCD3 locus, we detected a chromatin looping interaction between the rs787404585 region and the SMARCD3 promoter. b rs2790444 at WAC, located close to the promoter within the PCHi-C bait region. c rs3777189 and rs3777183-rs3777182 at ELL2, where rs3777182 and rs3777183 are located only 17 bp apart. We detected a chromatin looping interaction between the rs3777183-rs3777182 region and the promoter. d No looping interactions were detected at CDCA7L. e At the PREX1 locus, we detected a looping interaction between the rs6066832 region and the PREX1 promoter. f No looping interactions were detected for the CEP120 association. Vertical lines indicate variant positions. Coordinates are hg38.
Fig. 5
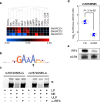
Fig. 5. Characterization of rs78740585.
a Heat map showing the expression of the SMARCD gene family in blood cells. Notably, expression of SMARCD3 in plasma cells is normally very low; the MM risk allele upregulates SMARCD3 in this cell type (Supplementary Table 2). The color scale is log2-transformed, median-centered RNA-seq data. b Motif analysis predicted that the SMARCD3 high-expressing rs78740585-A allele creates a binding site for IRF4. Arrow indicates the altered recognition base. c Electromobility shift assay showing selective binding of IRF4 to rs78740585-A probe. Arrow indicates supershift with an antibody towards IRF4. d siRNA-knockdown of IRF4 reduced luciferase activity for rs78740585-A relative to rs78740585-G in L363 cells. The y-axis indicates the log2 ratio of the luciferase/renilla signal for rs78740585-A relative to the rs78740585-G construct. The bottom, middle, and top of each box plot represent the 25th, 50th, and 75th percentiles. The whiskers represent the non-outlier minimum and maximum values, located at 1.5 times the interquartile range from the bottom and top of the box, respectively. The P value is for the two-sided Student’s t-test. e Western blot confirming knockdown. LP labeled probe, NE L363 nuclear extract, ULP unlabeled probe, α-IRF4 antibody against IRF4.
Fig. 6
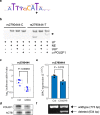
Fig. 6. Characterization of rs2790444.
a Motif analysis predicted that the WAC high-expressing allele rs2790444-T creates a new binding site for POU2F1. Arrow indicates the altered recognition base. b Electromobility shift assay showing selective binding of POU2F1 to rs2790444-T probe. Arrow indicates supershift with an antibody towards POU2F1. c siRNA-knockdown of POU2F1 attenuated luciferase activity for rs2790444-T relative to rs2790444-C in L363 cells. The y-axis indicates the log2 ratio of the luciferase/renilla signal for rs2790444-T relative to the rs2790444-C construct. The bottom, middle, and top of each box plot represent the 25th, 50th, and 75th percentiles. The whiskers represent the non-outlier minimum and maximum values, located at 1.5 times the interquartile range from the bottom and top of the box, respectively. d Western blot confirming knockdown. e Quantitative PCR showing expression of WAC relative to control in MOLP8 cells upon dual-sgRNA CRISPR/Cas9 deletion of a 139-bp region harboring rs2790444, heterozygous for rs2790444. Blue bars indicate the averages of the individual measurements. f Agarose gel confirming deletion of the targeted region. LP labeled probe, NE L363 nuclear extract, ULP unlabeled probe, α-POU2F1 antibody against POU2F1. The P values is for the two-sided Student’s t-test.
Fig. 7
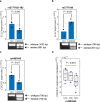
Fig. 7. Deletion data for rs3777182, rs3777183, and rs3777189 at ELL2 and rs4487645 at CDCA7L.
a Quantitative PCR data showing altered expression relative to control of ELL2 upon dual-sgRNA CRISPR/Cas9 deletion of a 141-bp region harboring rs3777182 and rs3777183 in RPMI-8226 cells, which are heterozygous the rs3777189, rs3777182, and rs3777183 variants. The agarose gel below confirms the deletion of the CRISPR/Cas9-targeted region. b Corresponding data for an 89-bp region harboring rs3777189. c Corresponding data for a 76-bp region harboring rs4487645 in OPM2 cells, which are homozygous for the rs4487645-C variant. The P values are for the two-sided Student’s t-test. Blue bars in (a) through (c) indicate the averages of the individual measurements. d We successfully edited rs4487645[C > A] in L363 cells using CRISPR-HDR. We generated six C-homozygous, three C/A heterozygous, and six A-homozygous single-cell clones. Consistent with the other data for rs4487645, we detected an association between CRISPR-edited rs4487645 genotype and CDCA7L expression, with the C allele yielding higher expression, further supporting causality. The y-axis indicates residual CDCA7L expression qPCR expression value in L363 cells, taking into account the CDCA7L copy number in each single-cell clone. The bottom, middle, and top of each box plot represent the 25th, 50th, and 75th percentiles. The whiskers represent the non-outlier minimum and maximum values, located at 1.5 times the interquartile range from the bottom and top of the box, respectively. The P value is for correlation between edited genotype and CDCA7L expression, taking CDCA7L DNA copy number into account as a covariate.
Fig. 8
Fig. 8. Identification of co-localized caQTLs at MPRA-functional variants.
We performed ATAC-seq on plasma cells from 161 MM patients and scanned the LD regions for lead variant caQTLs using two computational approaches. a In the SMARCD3 region, we detected a significant caQTL around rs78740585, with the minor allele conferring increased accessibility. Consistent with this, rs78740585[T > A] showed a positive MPRA log2 score and the rs78740585-A risk allele creates an IRF4 site (Supplementary Fig. 4). b In the CDCA7L region, we detected a significant, 1.6 kb wide caQTL around rs4487645, with the major allele conferring increased accessibility. Consistent with this, rs4487645[C > A] showed a negative MPRA log2 score and the rs4487645-C risk allele creates an IRF4 site. c At CEP120, we detected a significant caQTL covering rs11960493 and eight other variants, including rs62376437 which was borderline-significant in MPRA, suggesting the CEP120 association is enshrined in multiple causal variants. Dashed blue indicates a false discovery rate (−log10 Q value) for Pearson correlation between ATAC-seq signal intensity and lead variant genotype. Regions with lead variant-dependent accessibility called by caQTLseg are indicated in light blue. Upper panels show full regions of LD, lower panels are close-ups of highlighted regions. Red circles indicate variants that show evidence of association with MM (data from Fig. 1a; variants with P < 10−5 for association shown). In the lower panels, average local ATAC-seq signal intensity across individuals with different lead variant genotypes is indicated by the yellow (minor/minor), orange (minor/major), and red (major/major) lines.

References

    1. Welter D, et al. The NHGRI GWAS Catalog, a curated resource of SNP-trait associations. Nucleic Acids Res. 2014;42:D1001–D1006. doi: 10.1093/nar/gkt1229. - DOI - PMC - PubMed
    1. Gusev A, et al. Partitioning heritability of regulatory and cell-type-specific variants across 11 common diseases. Am. J. Hum. Genet. 2014;95:535–552. doi: 10.1016/j.ajhg.2014.10.004. - DOI - PMC - PubMed
    1. Roadmap Epigenomics C, et al. Integrative analysis of 111 reference human epigenomes. Nature. 2015;518:317–330. doi: 10.1038/nature14248. - DOI - PMC - PubMed
    1. Schaub MA, Boyle AP, Kundaje A, Batzoglou S, Snyder M. Linking disease associations with regulatory information in the human genome. Genome Res. 2012;22:1748–1759. doi: 10.1101/gr.136127.111. - DOI - PMC - PubMed
    1. Pertesi, M. et al. Genetic predisposition for multiple myeloma. Leukemia10.1038/s41375-019-0703-6 (2020). - PubMed

Publication types

MeSH terms