. 2022 Jan 10;13(1):114.
doi: 10.1038/s41467-021-27684-9.

Tartrate-resistant acid phosphatase 5 promotes pulmonary fibrosis by modulating β-catenin signaling

Affiliations

Tartrate-resistant acid phosphatase 5 promotes pulmonary fibrosis by modulating β-catenin signaling

Yinan Hu et al. Nat Commun. .

Abstract

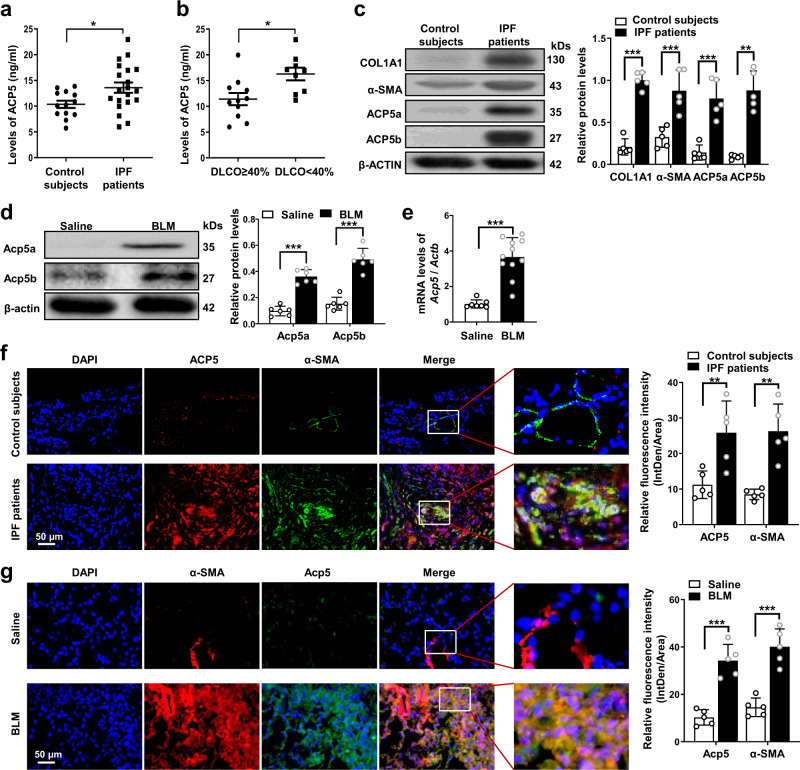
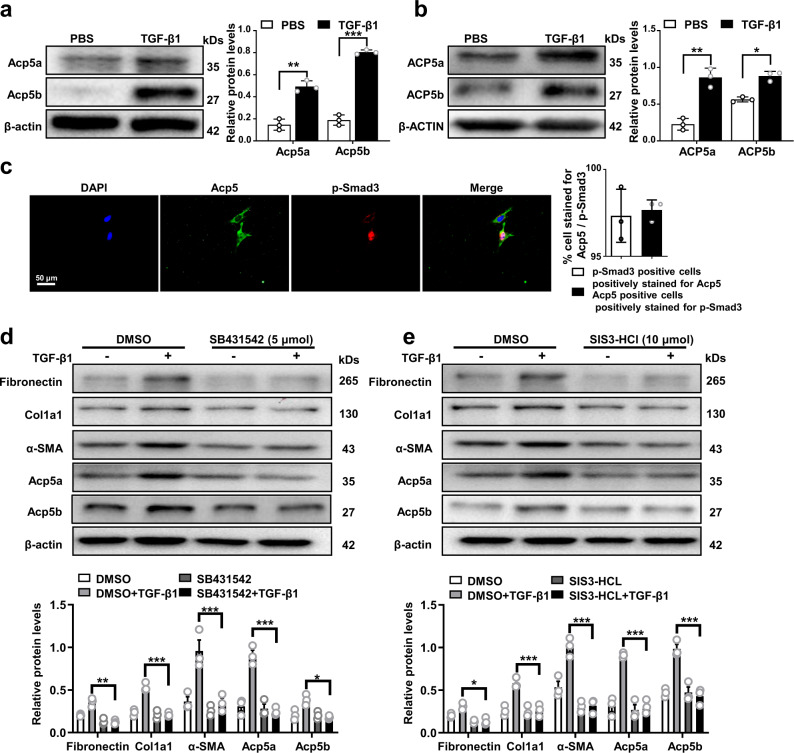
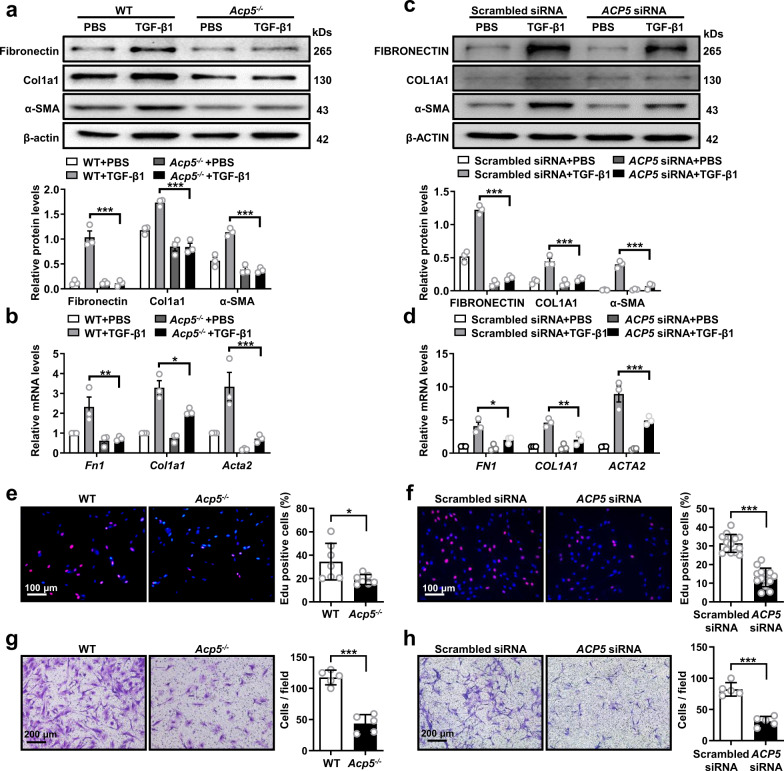
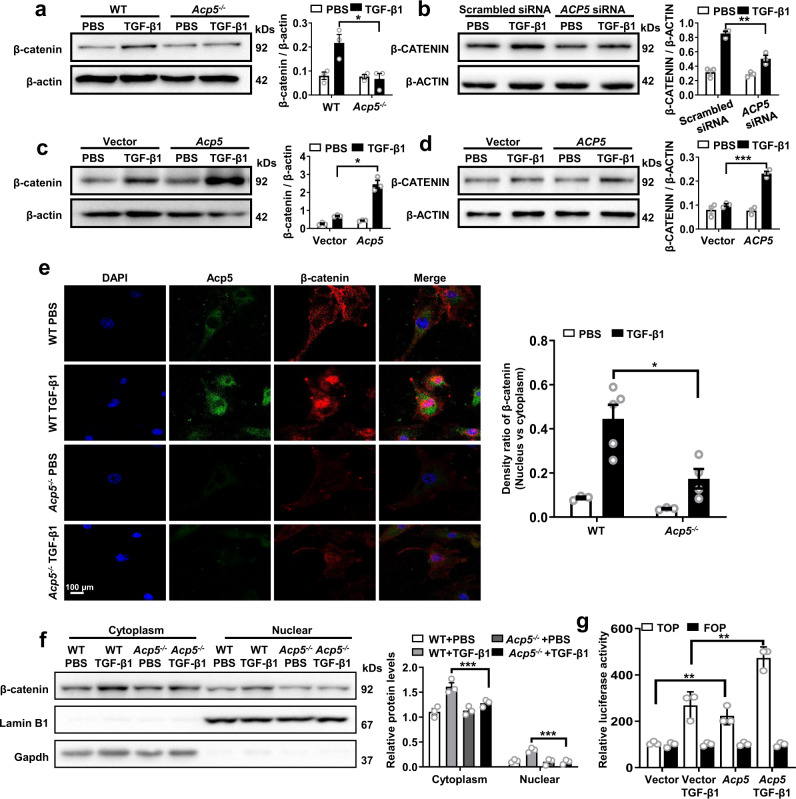
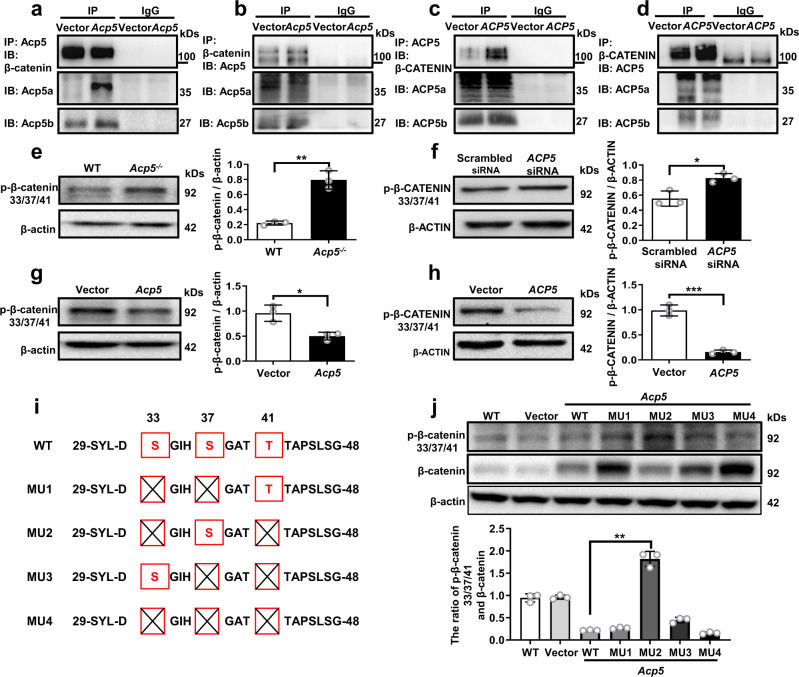
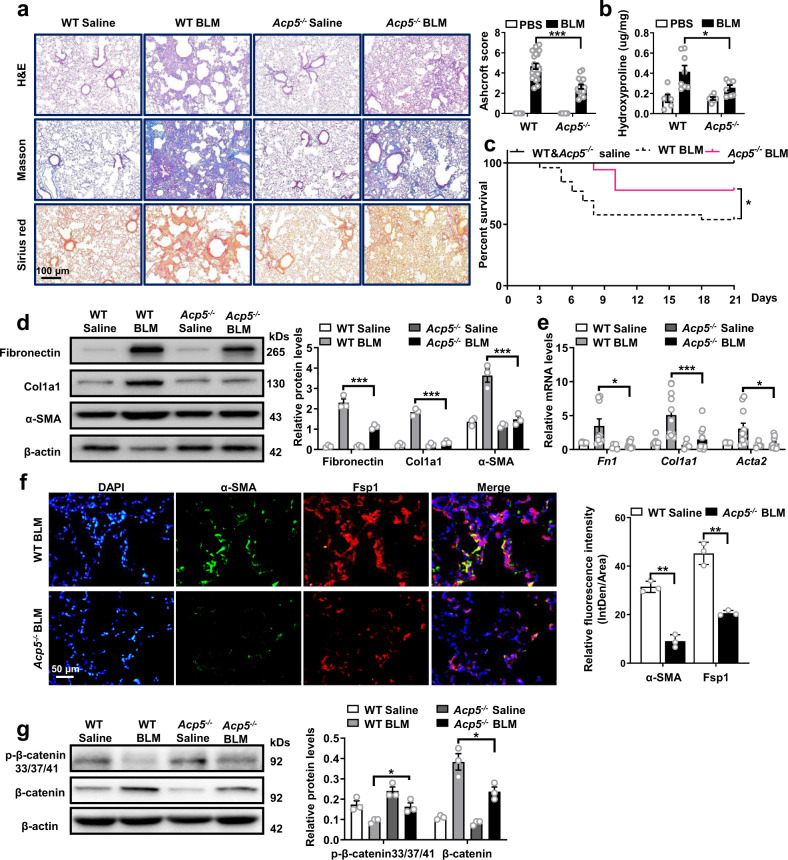
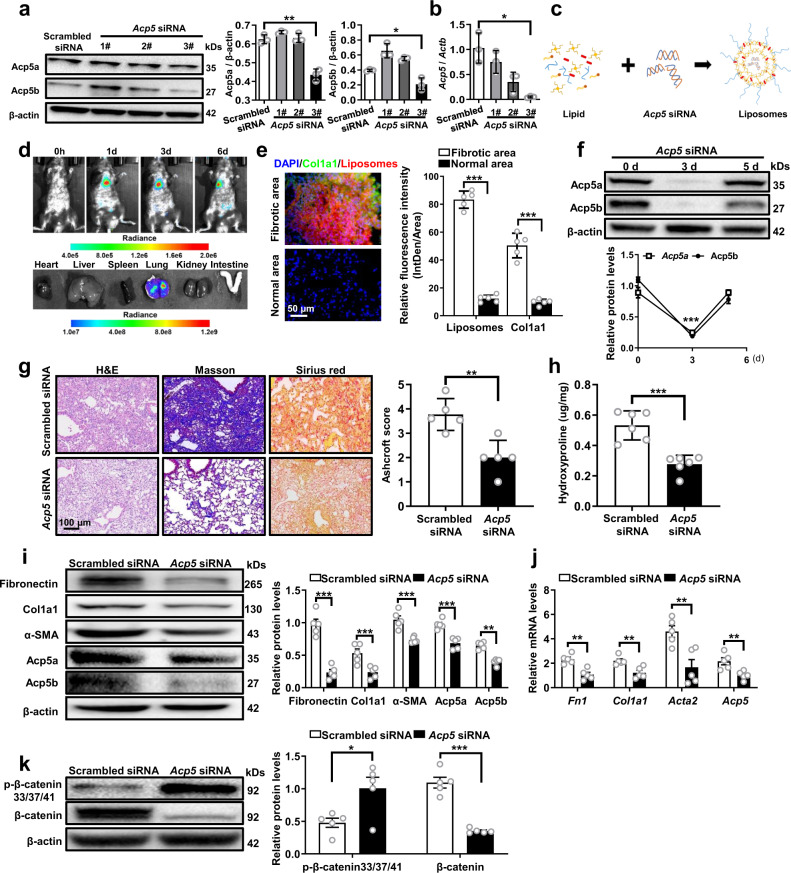
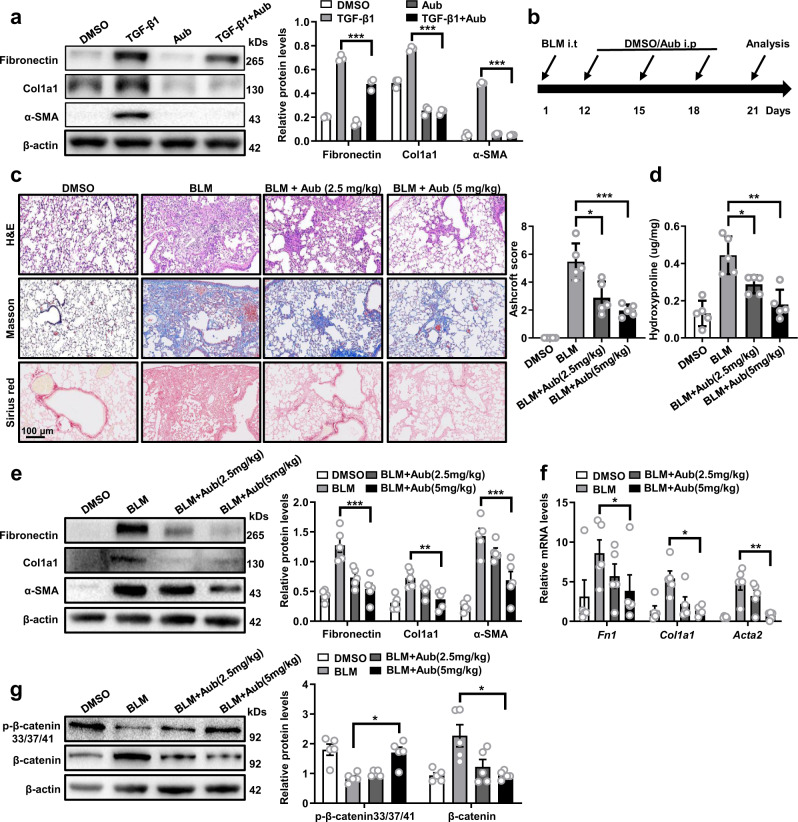
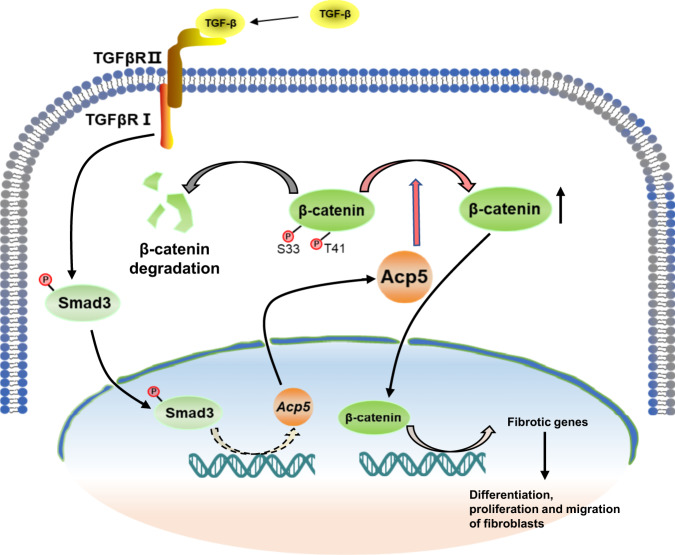
Idiopathic pulmonary fibrosis (IPF) is a fatal interstitial lung disease with limited therapeutic options. Tartrate-resistant acid phosphatase 5 (ACP5) performs a variety of functions. However, its role in IPF remains unclear. Here, we demonstrate that the levels of ACP5 are increased in IPF patient samples and mice with bleomycin (BLM)-induced pulmonary fibrosis. In particular, higher levels of ACP5 are present in the sera of IPF patients with a diffusing capacity of the lungs for carbonmonoxide (DLCO) less than 40% of the predicted value. Additionally, Acp5 deficiency protects mice from BLM-induced lung injury and fibrosis coupled with a significant reduction of fibroblast differentiation and proliferation. Mechanistic studies reveal that Acp5 is upregulated by transforming growth factor-β1 (TGF-β1) in a TGF-β receptor 1 (TGFβR1)/Smad family member 3 (Smad3)-dependent manner, after which Acp5 dephosphorylates p-β-catenin at serine 33 and threonine 41, inhibiting the degradation of β-catenin and subsequently enhancing β-catenin signaling in the nucleus, which promotes the differentiation, proliferation and migration of fibroblast. More importantly, the treatment of mice with Acp5 siRNA-loaded liposomes or Acp5 inhibitor reverses established lung fibrosis. In conclusions, Acp5 is involved in the initiation and progression of pulmonary fibrosis and strategies aimed at silencing or suppressing Acp5 could be considered as potential therapeutic approaches against pulmonary fibrosis.


Conflict of interest statement

The authors declare no competing interests.

Figures

Fig. 1
Fig. 1. Analysis of ACP5 levels in Idiopathic pulmonary fibrosis (IPF) patients and mice with bleomycin (BLM) induction.
a ELISA analysis of ACP5 levels in the serum of patients with IPF (n = 20) and control subjects (n = 13, p = 0.0134). b Analysis of the correlation between ACP5 levels with diffusion capacity carbonmonoxide lung (DLCO)% predicted in IPF patients (n = 20, p = 0.0113). c Western blot analysis of ACP5a (p = 0.002) and ACP5b (p = 0.0015), COL1A1 (p < 0.001) and α-SMA (p = 0.001) expression in the lungs of control subjects (n = 5) and IPF patients (n = 5). d Western blot analysis of Acp5a (p < 0.001) and Acp5b (p < 0.001) expression in the lung homogenate of Saline (n = 6) and BLM-induced (n = 6) mouse model. e RT-PCR analysis of Acp5 expression in the lung homogenate from Saline (n = 6) and BLM-induced (n = 11) mice (p < 0.001). f Representative results for coimmunostaining of ACP5 (p = 0.0095) and α-SMA (a myofibroblast marker, p = 0.0059) in the lung sections from patients with IPF (n = 5) and control subjects (n = 5). g Results for coimmunostaining of Acp5 (p < 0.001) and α-SMA (p < 0.001) in the lung sections from Saline (n = 5) and BLM-induced (n = 5) mice. The nuclei were stained blue by DAPI, and the images were taken under original magnification ×400. The data are represented as the mean ± SEM. Two-sided unpaired Student’s t test with Welch’s correction (a, c, d, f, g) and two-sided Student’s t test (b, c, e, f) were applied. *p < 0.05; **p < 0.01; ***p < 0.001. Source data are provided as a Source Data file.
Fig. 2
Fig. 2. Acp5 is upregulated in fibroblasts in a transforming growth factor β receptor 1 (TGFβR1) / Smad family member 3 (Smad3)-dependent manner.
a Western blot analysis of Acp5a (p = 0.0029) and Acp5b (p = 0.0003) expression in primary mice lung fibroblasts (PMLFs) following TGF-β1 induction. b Western blot analysis of ACP5a (p = 0.0040) and ACP5b (p = 0.0455) expression in primary human lung fibroblasts (PHLFs) following TGF-β1 induction. c Representative results for coimmunostaining of Acp5 and p-Smad3 in PMLFs. The nuclei were stained blue by DAPI, and the images were taken under original magnification ×400. d–e Western blot analysis of Fibronectin (d: p = 0.0096, e: p = 0.0295), Col1a1 (d: p = 0.0003, e: p < 0.0001), α-SMA (d: p < 0.0001, e: p < 0.0001), Acp5a (d: p < 0.0001, e: p < 0.0001) and Acp5b (d: p = 0.02, e: p < 0.0001) expression in PMLFs following SB431542 (d) and SIS3-HCL (e) treatment. The data are represented as the mean ± SEM of three independent experiments and two-side Student’s t-test was administered to analyze the statistical significance of differences between two groups. *p < 0.05; **p < 0.01; ***p < 0.001. Source data are provided as a Source Data file.
Fig. 3
Fig. 3. The impact of ACP5 on the differentiation, proliferation and migration of fibroblasts.
a, b Western blot (a) and RT-PCR (b) analysis of Fibronectin (a: p < 0.0001, b: p = 0.0038), Col1a1 (a: p < 0.0001, b: p = 0.0284) and α-SMA (a: p < 0.0001, b: p < 0.0001) expression in PMLFs from WT or Acp5−/− mice following TGF-β1 treatment. c, d Western blot (c) and RT-PCR (d) analysis of FIBRONECTIN (c: p < 0.0001, d: p = 0.0213), COL1A1 (c: p < 0.0001, d: p = 0.0041) and α-SMA (c: p < 0.0001, d: p < 0.0001) expression in ACP5 siRNA or Scrambled siRNA treated PHLFs following TGF-β1 induction. e, f Representative results for EdU staining in WT or Acp5−/− PMLFs (e, p = 0.0421) and ACP5 siRNA or Scrambled siRNA treated PHLFs (f, p < 0.0001) g, h Representative results for Transwell assay in WT or Acp5−/− mice derived PMLFs (g, p < 0.0001) and ACP5 siRNA or Scrambled siRNA treated PHLFs (h, p < 0.0001). The data are represented as the mean ± SEM of three independent experiments. Two-sided Student’s t test (ad, fh) and two-sided unpaired Student’s t-test with Welch’s correction (e) were applied. *p < 0.05; **p < 0.01; ***p < 0.001. Source data are provided as a Source Data file.
Fig. 4
Fig. 4. Altered Acp5 expression affects the levels of β-catenin.
ad Western blot analysis of the levels of β-catenin in WT or Acp5−/− PMLFs (a, p = 0.0239), ACP5 siRNA or Scrambled siRNA treated PHLFs (b, p = 0.0034), Acp5-plasmid or Vector treated Acp5−/− PMLFs (c, p = 0.0138) and ACP5-plasmid or Vector treated PHLFs (d, p = 0.0003). e Representative results for coimmunostaining of Acp5 and β-catenin in PMLFs from WT and Acp5−/− PMLFs following TGF-β1 induction (p = 0.0127). The nuclei were stained blue by DAPI, and the images were taken under original magnification ×400. f Western blot analysis of the levels of β-catenin in cytoplasm (p < 0.0001) and nuclear (p = 0.0001). g Normalized luciferase activities of TOP-Flash over FOP-Flash relative renilla luciferase units (RLU) in PMLFs (Vector treated versus Acp5-plasmid treated: p = 0.0064, Vector treated with TGF-β1 versus Acp5-plasmid treated with TGF-β1: p = 0.0094). The data are represented as the mean ± SEM of three independent experiments. Two-sided Student’s t-test (ab, dg) and two-sided unpaired Student’s t-test with Welch’s correction (c) were applied. *p < 0.05; **p < 0.01; ***p < 0.001. Source data are provided as a Source Data file.
Fig. 5
Fig. 5. Acp5 dephosphorylates β-catenin at Ser33 and Thr41.
ad Coimmunoprecipitation of Acp5 and β-catenin in PMLFs (a, b) and in PHMLs (c, d). eh Western blot analysis of the levels of p-β-catenin (S33, S37 and T41) in WT and Acp5−/− PMLFs (e, p = 0.0013), ACP5 siRNA and Scrambled siRNA treated PHLFs (f, p = 0.0159), Acp5-plasmid and Vector treated Acp5−/− PMLFs (g, p = 0.0188) and Acp5-plasmid and Vector treated PHLFs (h, p = 0.0003). i The schematic results showing the mutant plasmids (MU1-3) of these three phosphorylated sites. Each of mutant plasmids (MU1-3) of these three phosphorylated sites maintained one normal site and two mutant sites (red boxes), and all phosphorylated sites were deleted in MU4. j Western blot analysis of the levels of β-catenin and p-β-catenin (S33, S37 and T41) in PMLFs following plasmids transduced (p = 0.0036). The data are represented as the mean ± SEM of three independent experiments. Two-sided Student’s t-test (ai) and two-sided unpaired Student’s t-test with Welch’s correction (j) were applied. *p < 0.05; **p < 0.01; ***p < 0.001. Source data are provided as a Source Data file.
Fig. 6
Fig. 6. Comparison of the severity of lung fibrosis between WT and Acp5−/− mice after BLM induction.
a Histological analysis of the severity of lung fibrosis in mice after BLM induction. Left panel: representative images for H&E (top), Masson staining (middle) and Sirius red (bottom). Right panel: A bar graph showed the quantitative mean score of the severity of fibrosis (p < 0.0001). Images were captured at ×200 magnification (WT Saline n = 18, WT BLM n = 22, Acp5−/− Saline n = 12, Acp5−/− BLM n = 16). b Quantification of hydroxyproline contents in WT and Acp5−/− mice (WT Saline n = 6, WT BLM n = 8, Acp5−/− Saline n = 6, Acp5−/− BLM n = 8, p = 0.0413). c The survival ratio in WT and Acp5−/− mice after BLM induction (WT Saline n = 18, WT BLM n = 40, Acp5−/− Saline n = 12, Acp5−/− BLM n = 21, p = 0.0414). d Western blot analysis of Fibronectin (p < 0.0001), Col1a1 (p < 0.0001) and α-SMA (p < 0.0001) expression in the lung homogenate from WT (n = 3) and Acp5−/− (n = 3) mice. e RT-PCR analysis of Fn1 (p = 0.0269), Col1a1 (p = 0.0001) and Acta2 (p = 0.0214) expression in the lung homogenate from WT (n = 10) and Acp5−/− (n = 11) mice. f Coimmunostaining of Fsp1 (p = 0.0025) and α-SMA (p = 0.0017) in the lung sections from WT (n = 3) and Acp5−/− (n = 3) mice. The nuclei were stained blue by DAPI, and the images were taken under original magnification ×400. g Western blot analysis of the levels of β-catenin (p = 0.0350) and p-β-catenin (S33, S37 and T41, p = 0.0238) in WT (n = 3) and Acp5−/− (n = 3) mice after BLM challenge. The data are represented as the mean ± SEM. Two-sided Student’s t-test (a, cg) and two-sided unpaired Student’s t-test with Welch’s correction (b, e) were applied. *p < 0.05; **p < 0.01; ***p < 0.001. Source data are provided as a Source Data file.
Fig. 7
Fig. 7. Administration of Acp5 siRNA-loaded liposomes protected mice from BLM-induced lung injury and fibrosis.
a, b Western blot (a, Acp5a: p = 0.0011, Acp5b: p = 0.0205) and RT-PCR (b, p = 0.0300) analysis of the interfering efficiency of Acp5 siRNAs in PMLFs (n = 3 for each group). c Schematic diagram for preparation of liposomes carrying Acp5 siRNA. d The biodistribution of the liposomes in pulmonary fibrosis model mice (n = 6). e Representative images of immunofluorescence for the biodistribution of liposomes (Red, p < 0.0001) and Col1a1 (Green, p = 0.0003) in lungs from BLM-induced mice (n = 6). The nuclei were stained blue by DAPI, and the images were taken under original magnification ×400. f Temporal Acp5 expression changes in lungs from transfected mice (n = 5, p < 0.0001). g Histological analysis of the severity of lung fibrosis in mice after BLM induction (Scrambled siRNA liposomes group n = 5, Acp5 siRNA liposomes group n = 5, p = 0.0034). Images were captured at ×200 magnification. h Quantification of hydroxyproline contents in Scrambled or Acp5 siRNA-loaded liposomes treated mice (n = 5) after BLM injection (p = 0.0002). ij: Western blot (i) and RT-PCR (j) analysis of Fibronectin (i: p < 0.0001, j: p = 0.0012), Col1a1 (i: p = 0.0003, j: p = 0.0057), α-SMA (i: p = 0.0001, j: p = 0.0061), Acp5a (i: p = 0.0004), Acp5b (i: p = 0.0023) and Acp5 (p = 0.0083) expression in the lung homogenate from Scrambled or Acp5 siRNA-loaded liposomes treated mice (n = 5). k Western blot analysis of the levels of β-catenin (p = 0.0007) and p-β-catenin (S33, S37 and T41, p = 0.0202) in Scrambled or Acp5 siRNA-loaded liposomes treated mice (n = 5). The data are represented as the mean ± SEM. Two-sided Student’s t test (a, ek) and two-sided unpaired Student’s t-test with Welch’s correction (b, e, k) were applied. *p < 0.05; **p < 0.01; ***p < 0.001. Source data are provided as a Source Data file.
Fig. 8
Fig. 8. Treatment with AubipyOMe (Aub) reversed the established pulmonary fibrosis.
a Western blot analysis of Fibronectin (p < 0.0001), Col1a1 (p < 0.0001) and α-SMA (p < 0.0001) in AubipyOMe treated PMLFs after TGF-β1 stimulation, Dimethyl Sulfoxide (DMSO) treated as control group. b Schematic diagram for BLM-induced model of pulmonary fibrosis and the AubipyOMe-delivery method (i.t: Intratracheal instillation, i.p: intraperitonea). c Histological analysis of the severity of lung fibrosis in mice after BLM induction. Left panel: representative images for H&E (top), Masson staining (middle) and Sirius red (bottom). Right panel: A bar graph showed the quantitative mean score of the severity of fibrosis. Images were captured at ×200 magnification. (BLM versus BLM with 2.5 mg/kg AubipyOMe: p = 0.0110, BLM versus BLM with 5.0 mg/kg AubipyOMe: p = 0.0005) d Quantification of hydroxyproline contents. (BLM versus BLM with 2.5 mg/kg AubipyOMe: p = 0.0147, BLM versus BLM with 5.0 mg/kg AubipyOMe: p = 0.0018) e-f Western blot (e) and RT-PCR (f) analysis of Fibronectin (e: p < 0.0001, f: p = 0.0146), Col1a1 (e: p = 0.0066, f: p = 0.0101), and α-SMA (e: p < 0.0001, f: p = 0.0083) expression. g Western blot analysis of the levels of β-catenin (p = 0.02241) and p-β-catenin (S33, S37 and T41, p = 0.0213). Each bar represents the mean ± SEM of 5 mice analyzed. Two-sided Student’s t test (ag) and two-sided unpaired Student’s t-test with Welch’s correction (f, g) were applied. *p < 0.05; **p < 0.01; ***p < 0.001. Source data are provided as a Source Data file.
Fig. 9
Fig. 9. Schematic illustration of the mechanisms of Acp5 in fibroblasts.
Acp5 is upregulated by TGF-β1 in a TGFβR1/Smad3 depend manner, and then Acp5 specially binds to p-β-catenin and dephosphorylate the sites of Ser33 and Thr41, by which it resists the degradation of β-catenin and enhanced β-catenin signaling in the nuclear to promote the differentiation, proliferation and migration of fibroblasts.

References

    1. Richeldi L, Collard HR, Jones MG. Idiopathic pulmonary fibrosis. Lancet. 2017;389:1941–1952. - PubMed
    1. Kolb M, et al. Nintedanib plus Sildenafil in Patients with Idiopathic Pulmonary Fibrosis. N. Engl. J. Med. 2018;379:1722–1731. - PubMed
    1. Duitman, J., van den Ende, T. & Spek, C. A. Immune Checkpoints as Promising Targets for the Treatment of Idiopathic Pulmonary Fibrosis? J. Clin. Med. 8, 1547 (2019). - PMC - PubMed
    1. Chambers RC, Mercer PF. Mechanisms of alveolar epithelial injury, repair, and fibrosis. Ann. Am. Thorac. Soc. 2015;12:S16–S20. - PMC - PubMed
    1. Zhang L, et al. Macrophages: friend or foe in idiopathic pulmonary fibrosis? Respir. Res. 2018;19:170. - PMC - PubMed

Publication types

MeSH terms