. 2022 Jan 10;13(1):21.
doi: 10.1038/s41467-021-27717-3.

Age-dependent pathogenic characteristics of SARS-CoV-2 infection in ferrets

Affiliations

Age-dependent pathogenic characteristics of SARS-CoV-2 infection in ferrets

Young-Il Kim et al. Nat Commun. .

Abstract

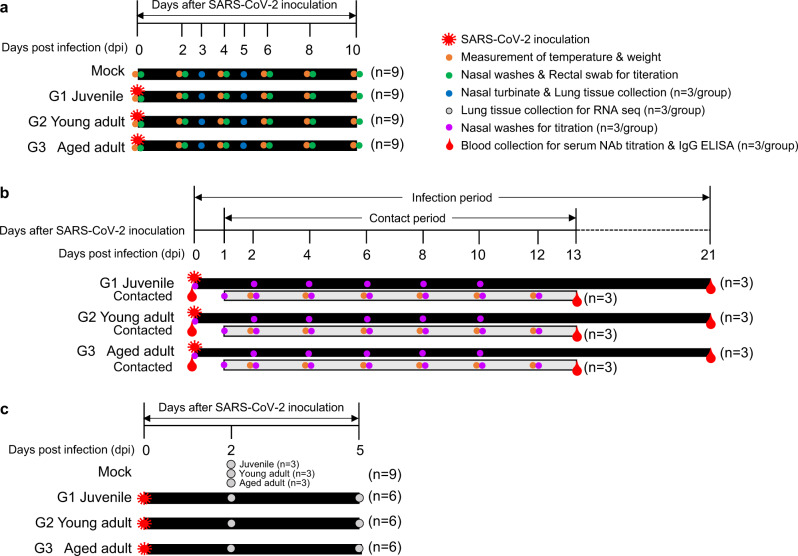
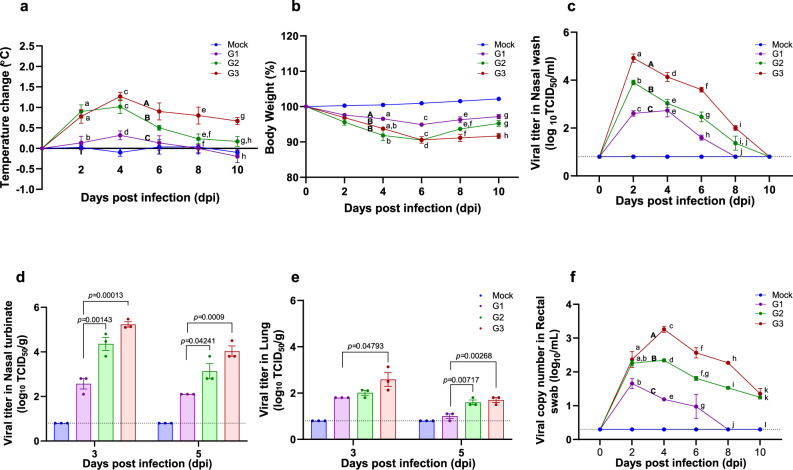
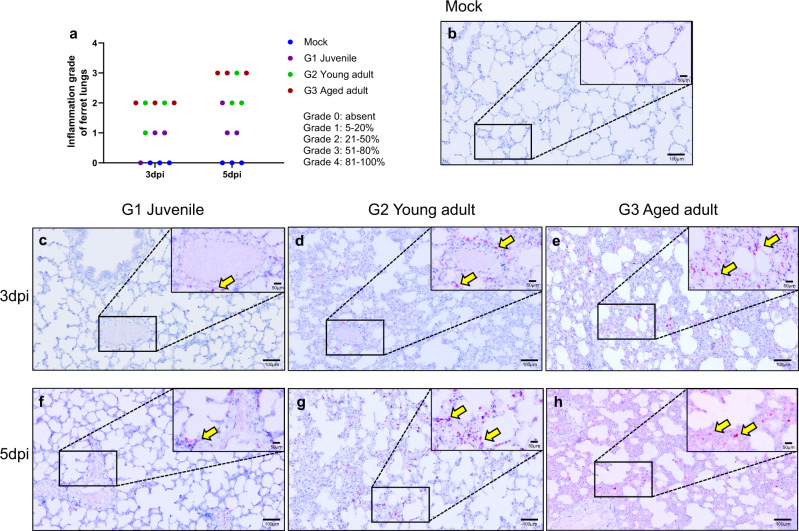
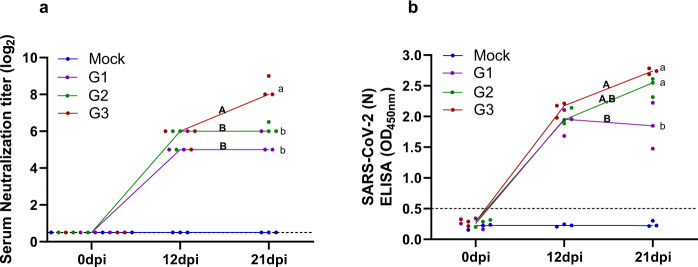
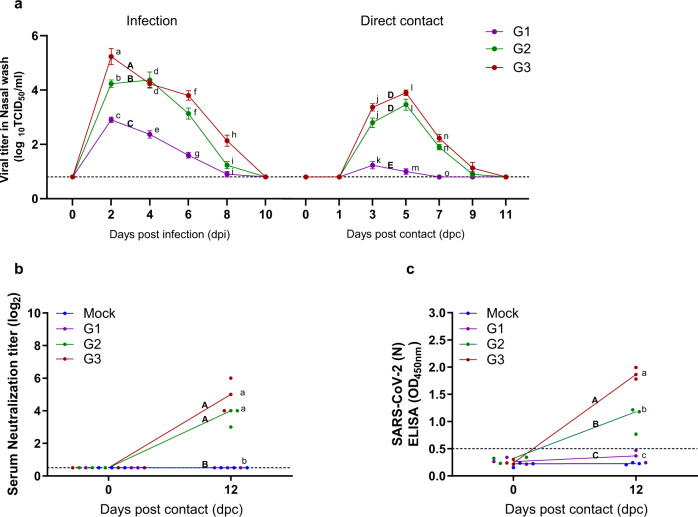
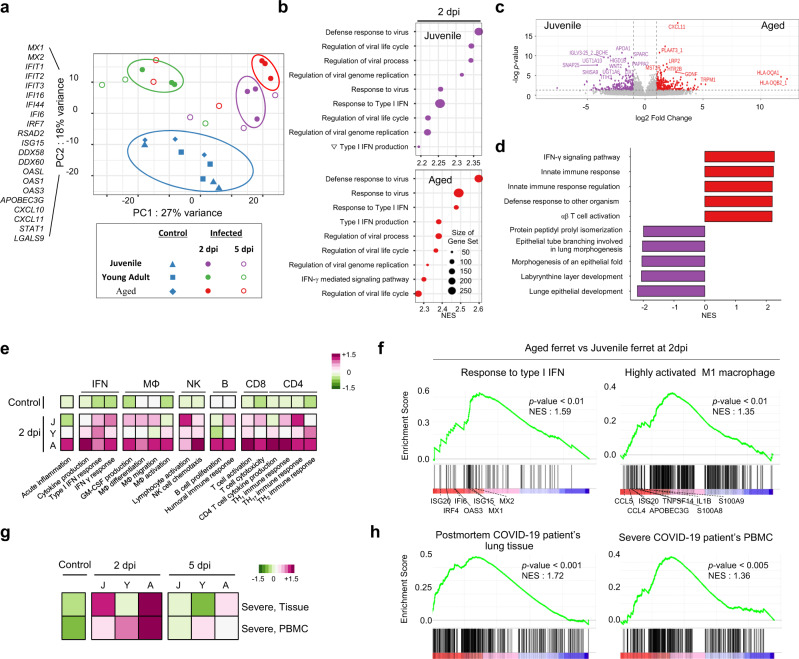
While the seroprevalence of SARS-CoV-2 in healthy people does not differ significantly among age groups, those aged 65 years or older exhibit strikingly higher COVID-19 mortality compared to younger individuals. To further understand differing COVID-19 manifestations in patients of different ages, three age groups of ferrets are infected with SARS-CoV-2. Although SARS-CoV-2 is isolated from all ferrets regardless of age, aged ferrets (≥3 years old) show higher viral loads, longer nasal virus shedding, and more severe lung inflammatory cell infiltration, and clinical symptoms compared to juvenile (≤6 months) and young adult (1-2 years) groups. Furthermore, direct contact ferrets co-housed with the virus-infected aged group shed more virus than direct-contact ferrets co-housed with virus-infected juvenile or young adult ferrets. Transcriptome analysis of aged ferret lungs reveals strong enrichment of gene sets related to type I interferon, activated T cells, and M1 macrophage responses, mimicking the gene expression profile of severe COVID-19 patients. Thus, SARS-CoV-2-infected aged ferrets highly recapitulate COVID-19 patients with severe symptoms and are useful for understanding age-associated infection, transmission, and pathogenesis of SARS-CoV-2.


Conflict of interest statement

The authors declare no competing interests.

Figures

Fig. 1
Fig. 1. Schematic diagrams illustrating ferret study design.
Experimental layout of age-dependent pathogenesis of SARS-CoV-2 in ferret animal model. a Timetable showing time points of virus inoculation, observation and monitoring of clinical manifestation and sample collection in infected ferrets by age groups. Orange circle denotes for time points of temperature and weight measurement, green circle for nasal washes and rectal swab sample collection, and blue circle indicates nasal turbinate and lung tissue harvest for viral titration. b Timetable for ferret-to-ferret transmission study and blood sample collection for serum neutralizing and IgG antibody titration: at 24 h post-infection of the infected ferret groups, 12–24 month-old naive ferrets (n = 3/group) were introduced in direct contact with infected ferrets and was co-housed with each group of infected ferrets in the same cage up to 12 days. Several time points are indicated for monitoring and sample collection. Orange circle denotes time point for temperature and body weight measurement, while purple circle indicates points for collection of nasal washes for viral titration. Red water drop shape indicates euthanasia after whole blood collection. c Timetable for RNA-seq analysis: groups of ferrets (n = 6/group) were SARS-CoV-2 inoculated at 0 dpi with exception to the mock infection group. PBS-treated ferrets (n = 9) were intranasally inoculated with phosphate-buffered saline (PBS) for the mock-infection group. Ferrets of the same ages as the test groups (n = 9 (Juvenile = 3, young adult = 3, aged = 3)) were then euthanized at 2 dpi, and lungs were harvested for RNA-seq analysis. SARS-CoV-2 infected ferrets by age (n = 3/group) were euthanized at 2 dpi and 5 dpi respectively, and lungs were harvested for RNA-seq analysis.
Fig. 2
Fig. 2. Pathogenicity of SARS-CoV-2 infection among different ages of ferrets.
Groups of ferrets [under 6 months (G1), one to two years old (G2), and more than three years old (G3); n = 9 per group] were inoculated with 105.8 TCID50 of NMC-nCoV02 strain by the intranasal route. All groups were observed for morbidity and mortality for 10 days. The temperature change (a) and weight loss (b) were monitored. To compare virus growth in respiratory tracts, nasal washes (c) were collected at 0, 2, 4, 6, 8, and 10 dpi. Nasal turbinate (d) and lung (e) tissues were collected to recover infectious virus from infected ferrets (n = 3) at 3 and 5 dpi. To compare virus growth in gastrointestinal tracts, rectal swabs (f) were collected at 0, 2, 4, 6, 8, and 10 dpi. Infectious viral titers in nasal washes and tissue specimens (c, d and e) were measured in Vero Cells, and viral RNA copy numbers in rectal swabs were quantitated using real-time PCR (f). Data are presented as mean values ± SEM. Groups with the same letter are of the same subgroup in the post-hoc analysis. Lower case letters indicate significant differences at each time point (P values are a vs b: 0.00398 or 0.02009, c vs d: 0.00335 or 0.00011, e vs f: 0.038 and g vs h: 0.0033 (a), a vs b: 0.00476, c vs d: 0.0045 or 0.0047, e vs f: 0.00807 and g vs h: 0.00207 or 0.02917 (b), a vs b: <0.0001, a vs c: <0.0001, b vs c: <0.0001, d vs e: 0.00017 or 0.00247, f vs g: 0.0011, f vs h: <0.0001, g vs h: 0.0067 and i vs j: 0.0038 (c), a vs b: 0.015, c vs d: <0.0001, c vs e: <0.0001, d vs e: <0.0001, f vs g: 0.00266, h vs i: <0.0001, h vs j: <0.0001, i vs j: <0.0001 and k vs l: 0.00016 or <0.0001 (f)), while upper case letters indicate significant differences of area under the curve as change over the entire period (P values are A vs B: < 0.0001, A vs C: < 0.0001 and B vs C: < 0.0001 (a), A vs B: < 0.0001 (b), A vs B: < 0.0001, A vs C: < 0.0001 and B vs C: < 0.0001 (c), A vs B: < 0.0001, A vs C: < 0.0001 and B vs C: < 0.0001 (f)). The area under the curve was calculated using Kruskal–Wallis with Bonferroni as a post-hoc analysis. Source data are provided as a Source Data file.
Fig. 3
Fig. 3. RNAscope in situ hybridization in the lung of SARS-CoV-2 infected ferrets.
To detect the SARS-CoV-2 RNA (Spike gene) in lung tissues, RNAscope in situ hybridization was performed using a Spike-specific probe and visualized using RNAscope 2.5 HD Reagent Kit RED. The degree of inflammation in lung tissues was scored as Grade 0–4 based on the estimated percentage of the lung tissue slides affected by lesions (n = 6/group) (a). SARS-CoV-2 spike RNA-positive cells (Yellow arrows) in lung tissues of mock infected (b), juvenile ferrets (≤6 months, G1 group) (c and f), young adult (1 ≤ age ≤2 years, G2 group) (d and g), and aged ferrets (3-year ≤ ages) (e and h). Lung sections of different age groups at 3 dpi (n = 3/group) (c, d, and e) and at 5 dpi (n = 3/group) (f, g, and h). Magnification is 100x and scale bar represents 100 μm. Insert indicates the magnified (200x) of SARS-CoV-2-positive and scale bar represents 50 μm.
Fig. 4
Fig. 4. Serum neutralizing antibody (NAb) and IgG antibody titers in different ages of ferrets.
The NAb titers against SARS-CoV-2 NMC-nCoV02 (100 TCID50) among different age groups was measured in Vero cells with serially diluted ferret sera collected at 0, 12, and 21 dpi (a). The IgG titers among different age groups in serially diluted sera collected at 0, 12, and 21 dpi (b). Groups with the same letter are of the same subgroup in the post-hoc analysis. Lower case letters indicate significant differences at each time point (P values are a vs b: 0.00017 or 0.00168 (a), a vs b: 0.03 or 0.0044 (b)), while upper case letters indicate significant differences of area under the curve as change over the entire period (P values are A vs B: 0.0012 or 0.0233 (a), A vs B: 0.03 (b)). The area under the curve was calculated using Kruskal–Wallis with Bonferroni as a post-hoc analysis. Data were analyzed in GraphPad Prism 9.1.2. Data are presented as mean ± SEM (n = 3). The limit of detection for NAb titers and OD450 nm value is 0.5, indicated by the dotted line. Source data are provided as a Source Data file.
Fig. 5
Fig. 5. Transmission properties of SARS-CoV-2 in ferrets of different ages upon co-housing naïve ferrets.
Naïve ferrets (n = 3/group) were exposed to direct contact (DC) with each group of infected ferrets of different ages (n = 3/group) starting 24 h after the primary infection, followed by measurement of their viral titers from nasal washes on day 1, 3, 5, 7, 9, and 11 post contact (a). Serum neutralizing antibody titers in contact groups at 12 dpc (b). IgG titers in contact groups at 12 dpc (c). Data are presented as mean values ± SEM. Groups with the same letter are of the same subgroup in the post-hoc analysis. Lower case letters indicate significant differences at each time point (P values are a vs b: 0.00897, a vs c: 0.00046, b vs c: 0.03398, d vs e: 0.0013 or 0.0019, f vs g: 0.00175 or 0.00024, h vs i: 0.0036 or 0.0171, j vs k: 0.00088 or 0.00015, l vs m: <0.0001 and n vs o- 0.00058 or 0.00013 (a), a vs b: 0.0009 or <0.0001 (b), a vs b: 0.0031, a vs c: <0.0001 and b vs c: 0.0053 (c)), while upper case letters indicate significant differences of area under the curve as change over the entire period (P values are A vs B: 0.00844, A vs C: < 0.0001, B vs C: 0.00014 and D vs E: 0.0001 or <0.0001 (a), A vs B: 0.0009 or <0.0001 (b), A vs B: 0.0031, A vs C: < 0.0001 and B vs C: 0.0053 (c)). The area under the curve was calculated using Kruskal–Wallis with Bonferroni as a post-hoc analysis. Data were analyzed in GraphPad Prism 9.1.2. Source data are provided as a Source Data file.
Fig. 6
Fig. 6. Transcriptional profile of immune-related genes in the lung of SARS-CoV-2-infected ferrets.
a The overall variation of transcriptional profiles in the lung of SARS-CoV-2-infected (n = 3/group) and age-matched uninfected (total n = 9) ferrets using principal component analysis (PCA). b The ‘Common’ gene sets were composed of genes differentially upregulated in more than two groups, while ‘Juvenile-specific’, ‘Young adult-specific’ and ‘Aged-specific’ gene sets were composed of genes uniquely upregulated in each group. Representative immune-related genes were listed next to the heatmap. Plots with normalized enrichment score (NES) from enrichment analysis of representative Gene Ontology (GO) biological pathway in juvenile and aged ferrets at 2 dpi, compared to age-matched control ferrets. c Volcano plots showing DEGs between juvenile and aged ferrets at 2 dpi. d Bar plots with NES from enrichment analysis of GO biological pathway in juvenile and aged ferrets at 2 dpi. e Heatmap of gene set variation analysis (GSVA) with immune-related GO biological pathway. J Juvenile, Y Young adult, A Aged. f Gene set enrichment analysis (GSEA) of gene sets related to type I IFN response and highly activated M1 macrophage between juvenile and aged ferrets at 2 dpi. The Y axis represents the enrichment score (ES), which reflects the degree to which a gene set is overrepresented at the top or bottom of a ranked list of genes, and the individual bar represents where the individual gene of each gene set is located in the ranked list of genes, corresponding to the projection of the gene set on the red-to-blue gradient, with red representing higher expression and blue representing lower expression (f and h). The p value of GSEA is the probability under the null distribution calculated by the one-sided permutation test (f: p = 0.0062, 0.0051 and h: p < 0.0001, 0.0025). GSVA and GSEA with indicated gene sets from severe COVID-19 patients between young adult and aged ferrets at 2 dpi. Control is the mean value (n = 9) of juvenile, young adult, and aged control ferrets. Heatmap colors from green to magenta represent low to high enrichment, respectively. While changes in gene expression are conveyed using color gradation (green, light green, pink, and magenta), and unchanged expression is represented by white (e and g). Source data are provided as a Source Data file.

Update of

Similar articles

Cited by

References

    1. Zhu N, et al. A novel coronavirus from patients with pneumonia in China, 2019. N. Engl. J. Med. 2020;382:727–733. - PMC - PubMed
    1. Organization, W. H. WHO Director-General’s opening remarks at the media briefing on COVID-19-11 March 2020 (2020).
    1. Ksiazek TG, et al. A novel coronavirus associated with severe acute respiratory syndrome. N. Engl. J. Med. 2003;348:1953–1966. - PubMed
    1. Zaki AM, van Boheemen S, Bestebroer TM, Osterhaus AD, Fouchier RA. Isolation of a novel coronavirus from a man with pneumonia in Saudi Arabia. N. Engl. J. Med. 2012;367:1814–1820. - PubMed
    1. ECDC. COVID-19 situation update worldwide, as of 25 November 2020. (2020).

Publication types

MeSH terms