. 2022 Jan 10;13(1):135.
doi: 10.1038/s41467-021-27702-w.

Reactive astrocytes acquire neuroprotective as well as deleterious signatures in response to Tau and Aß pathology

Affiliations

Reactive astrocytes acquire neuroprotective as well as deleterious signatures in response to Tau and Aß pathology

Zoeb Jiwaji et al. Nat Commun. .

Abstract

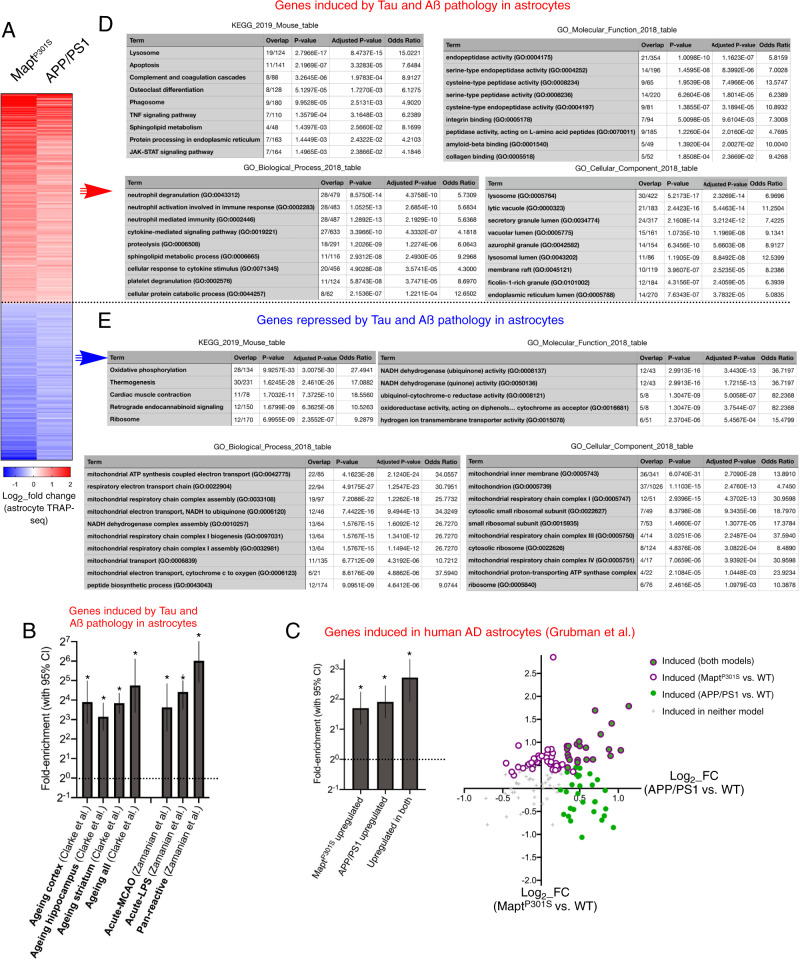
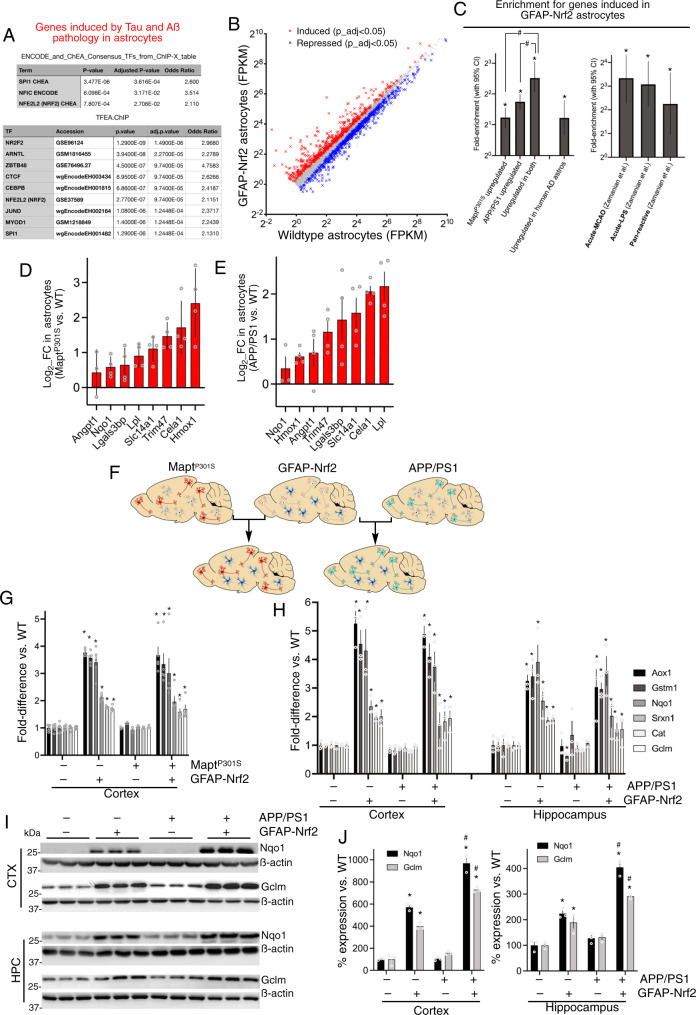
Alzheimer's disease (AD) alters astrocytes, but the effect of Aß and Tau pathology is poorly understood. TRAP-seq translatome analysis of astrocytes in APP/PS1 ß-amyloidopathy and MAPTP301S tauopathy mice revealed that only Aß influenced expression of AD risk genes, but both pathologies precociously induced age-dependent changes, and had distinct but overlapping signatures found in human post-mortem AD astrocytes. Both Aß and Tau pathology induced an astrocyte signature involving repression of bioenergetic and translation machinery, and induction of inflammation pathways plus protein degradation/proteostasis genes, the latter enriched in targets of inflammatory mediator Spi1 and stress-activated cytoprotective Nrf2. Astrocyte-specific Nrf2 expression induced a reactive phenotype which recapitulated elements of this proteostasis signature, reduced Aß deposition and phospho-tau accumulation in their respective models, and rescued brain-wide transcriptional deregulation, cellular pathology, neurodegeneration and behavioural/cognitive deficits. Thus, Aß and Tau induce overlapping astrocyte profiles associated with both deleterious and adaptive-protective signals, the latter of which can slow patho-progression.


Conflict of interest statement

The authors declare no competing interests.

Figures

Fig. 1
Fig. 1. Changes to the astrocyte translatome due to tau and amyloid pathology.
A Schematic illustrating the crossing of MAPTP301S with the Aldh1l1_eGFP-RPL10a mouse. Astrocyte TRAP-seq performed on MAPTP301S vs. WT mice (both carrying the Aldh1l1_eGFP-RPL10a allele) at 3 months (B) and 5 months (C) in the spinal cord. Genes significantly induced (red) and repressed (blue) are highlighted (expression cut-off 1FPKM, p values are adjusted for multiple testing by the Benjamini–Hochberg procedure to give a false discovery rate of 5% (p_adj < 0.05)) here and in all RNA-seq analyses; n = 4 mice per genotype. Genes in grey are not significantly changed. See also Supplementary Data 1 and 2. Note that all tests throughout the manuscript are 2-sided. D Sample-by-sample heat map of genes induced (red) or repressed (blue) >1.5-fold at 5 months (p_adj < 0.05). E Log2-fold change of the genes induced > 2-fold in MAPTP301S at late stage (C) when examined at the early stage (B). t = 11.28, df = 206, p < 1E−15 (Ratio paired t-test of FPKM (WT) vs FPKM (MAPTP301S)). F Schematic illustrating the crossing of APP/PS1 mouse with the Aldh1l1_eGFP-RPL10a mouse. Astrocyte TRAP-seq performed on APP/PS1 vs. WT mice at 6 months (G) and 12 months (H) in the cortex. Genes significantly induced (red) and repressed (blue) are highlighted (expression cut-off 1FPKM, p_adj < 0.05); n = 4 mice per genotype. See Supplementary Data 3 and 4. I Sample-by-sample heat map of genes induced (red) or repressed (blue) >1.5 fold (p_adj<0.05) at 12 months. J Log2-fold change of the genes induced >2-fold in APP/PS1 at late stage (H) when examined at the early stage (G). t = 14.68, df = 100, p < 1E−15 (Ratio paired t-test of FPKM (WT) vs FPKM (APP/PS1)).
Fig. 2
Fig. 2. Comparison of astrocytes in tau and amyloid pathology with acutely induced reactive profiles, ageing astrocytes, and AD risk genes.
A Example images of phospho-tau and NeuN staining of spinal cord sections at the indicated ages and genotypes, illustrating progressive accumulation of phospho-tau and neurodegeneration as previously reported. Scale bar: 100 µm. B (Left) Genes induced >1.5 fold at 5 months in the MAPTP301S mouse (expression cut-off 1FPKM, Benjamini–Hochberg p_adj<0.05) were taken and enrichment analysis performed on the indicated gene sets (see main text for details). Fold enrichment is shown, and 95% confidence interval (CI) of the fold enrichment depicted by the error bar. *p values (left-to-right, here and throughout the manuscript): 5.3E−07, 4.2E−22, 8.3E−42 1.7E−06, 2.6E−12, 5.6E−14, 1.2E−19 (two-sided Fisher’s exact test). B (right) Genes induced >1.5 fold at 5 months in the MAPTP301S mouse (expression cut-off 1FPKM, Benjamini–Hochberg p_adj < 0.05) were taken and enrichment analysis performed on human genes of different p value cut-offs for association with late-onset AD. P values: 0.082. 0.9. 0.29, 0.075, 0.90. C Example images of amyloid plaques (ThioS) and neurons (Neurotrace) staining of cortical sections at the indicated ages of the APP/PS1 mouse, illustrating progressive accumulation of plaques and lack of neurodegeneration as previously reported. Scale bar: 300 µm (main picture); 20 µm (inset). D (left) Genes induced >1.5 fold at 12 months in the APP/PS1 mouse (expression cut-off 1FPKM, p_adj < 0.05) were taken and enrichment analysis performed exactly as in B  (left), with fold enrichment is shown, and 95% CI depicted by error bar. *p values: 4.1E−06, 6.0E−06, 3.5E−15, 2.0E−05, 0.0006, 3.0E−08, 3.1E−09 (two-sided Fisher’s exact test). D (right). Enrichment analysis of genes induced >1.5 fold at 12 months in the APP/PS1 mouse for human genes of different p value cut-offs for association with late-onset AD. *p values: 0.011, 0.028, 0.017, 0.020; 0.63 (ns) (two-sided Fisher’s exact test).
Fig. 3
Fig. 3. Tau and amyloid pathology trigger a core set of gene expression changes in astrocytes.
A A heat map of genes induced (red) and repressed (blue) in both MAPTP301S and APP/PS1 mice. B Genes induced in astrocytes in both MAPTP301S and APP/PS1 mice (p_adj < 0.05 in both sample sets) were subjected to enrichment analysis against the indicated gene sets. *3.3E−07, 4.6E−12, 1.9E−34, 6.4E−07, 2.0E−05, 3.1E−13, 2.4E−19 (two-sided Fisher’s exact test). Fold enrichment and 95% CI shown. C (Left) Enrichment analysis of genes induced in human AD astrocytes for which a 1:1 ortholog exists (and >10 FPKM cut-off) for genes induced in MAPTP301S astrocytes (Fig. 1C), APP/PS1 astrocytes (Fig. 1H), or those induced in both models (A). Fold enrichment and 95% CI shown, *p = 9.4E−05, 4.1E−11, 4.0E−08 (two-sided Fisher’s exact test). (Right) For genes induced in human AD astrocytes for which a 1:1 ortholog exists and that are expressed >10 FPKM in MAPTP301S and APP/PS1 astrocytes, the Log(2) fold change in each gene is shown for both models (y-axis: MAPTP301S vs. WT; x-axis: APP/PS1 vs. WT). For each gene, in indication of whether it is significantly (p < 0.05) induced in either, both, or neither models is indicated. Ontological analysis of genes induced (D) or repressed (E) in astrocytes in both MAPTP301S and APP/PS1 mice. For KEGG pathway analysis, disease pathways were omitted (to enable a focus on biological pathways) and the number of genes required was ≥5. For KEGG and GO ontology analysis the top ten pathways are shown, unless fewer than ten achieved an adjusted p value cut-off of 0.05.
Fig. 4
Fig. 4. Activating Nrf2 in models of tauopathy and ß-amyloidopathy.
A Enrichment analysis of genes induced in MAPTP301S and APP/PS1 mice for transcription factor (TF) targets performed in Enrichr (upper) and TFEA.ChiP (lower). B RNA-seq analysis of astrocytes sorted from GFAP-Nrf2 mice, vs. WT (n = 5). Genes induced (red) and repressed (blue) are highlighted (>1FPKM, Benjamini–Hochberg-adjusted p value (p_adj) <0.05). C (Left). Enrichment of genes induced in GFAP-Nrf2 astrocytes for genes induced in MAPTP301S astrocytes (Fig. 1C), APP/PS1 astrocytes (Fig. 1H), and in both (Fig. 3A), and for genes induced in human AD astrocytes. *p values: 4.23E−11, 4.1E−21, 8.48E−15, 0.0001 (Fisher’s exact test). #p values: 0.0008, 0.013 (normal approximation to difference in log odds ratios). (Right) Enrichment of genes induced in GFAP-Nrf2 astrocytes for gene sets in Supplementary Fig. 2A–C. *p values: 8.7E−07, 4.0E−05, 0.007 (Fisher’s exact test). qPCR analysis of the indicated genes in MAPTP301S and APP/PS1 astrocyte translatome. Two-way ANOVA for genotype effect: F (1,53) = 23.29, p = 1.2E−05 (D); F (1,55) = 46.13, p = 8.3E−09 (E) (n = 4). F Illustrating our crossing strategy. G Expression of selected Nrf2 target genes in the cortex (from RNA-seq). *p_adj: 1.7E−178, 2.5E−119, 9.4E−45, 2.3E−64, 3.9E−59, 4.1E−54, 8.6671E−61, 2.52E−22, 1.2E−14, 2.6E−15, 7.3E−11, 1.2E−11. H Analysis repeated on hippocampal tissue. *p_adj: 4.3E−31, 3.9E−27, 2.3E−12, 1.9E−07, 8.3E−07, 0.0018, 1.6E−33, 5.7E−45, 4.1E−14, 1.6E−06, 8.9E−10, 6.1E−10; adjusted p values (hippocampus): 3.8E−11, 8.2E−14, 1.0E−06, 3.2E−08, 0.0012, 1.03E−05, 0.049, 7.5E−09, 1.6E−11, 2.9E−08, 1.6E−09, 0.049, 0.007 (n = 3). I, J Western analysis of cortical and hippocampal Nqo1 and Gclm. Two-way ANOVA for cortical Gclm: F (1, 8) = 98.68, p = 8.9E−06 (APP/PS1 effect); F (1, 8) = 493.2; p = 1.79E−08 (GFAP-Nrf2 effect); two-way ANOVA for cortical Nqo1: F (1, 8) = 69.4, p = 3.3E−05 (APP/PS1 effect); F (1, 8) = 773.2 p = 3.0E−09 (GFAP-Nrf2 effect). Two-way ANOVA for hippocampal Gclm: F (1, 8) = 26.67, p = 0.0009 (APP/PS1 effect); F (1, 8) = 91.36, p = 1.2E−05 (GFAP-Nrf2 effect); 2-way ANOVA for hippocampal Nqo1: F (1, 8) = 59.51, p = 5.7E−05 (APP/PS1 effect); F (1, 8) = 219.1, p = 4.3E−07 (GFAP-Nrf2 effect), n = 3 mice. *p values for GFAP-Nrf2 effect: 1.4E−06, 9.8E−06, 3.7E−08, 3.8E−04, 0.0025, 1.0E−06, 4.9E−08 (Bonferroni’s post-hoc test). #p values for APP/PS1 effect: 5.3E−06, 4.4E−06, 2.6E−05, 0.0011.
Fig. 5
Fig. 5. Astrocytic Nrf2 reduces phospho-tau accumulation and neurodegeneration.
A Schematic illustrating the crossing of MAPTP301S and GFAP-Nrf2 mice. B, C NeuN staining of upper cortical layers of mice at early-stage disease. Mean ± SEM shown. F (2, 21) = 28.83, p = 9.5E−7 (1-way ANOVA); * Post-hoc (Bonferroni) p values: 3.8E−07, 0.0028. N = 6 WT, 9 MAPTP301S and 9 MAPTP301S_X_GFAP-Nrf2 mice. Example pictures shown in (C); scale bar 20 µm. D, E Cortical slices were subject to AT8 immunofluorescent staining, and positive cells counted. Mean ± SEM shown from n = 10 MAPTP301S and n = 7 MAPTP301S_X_GFAP-Nrf2 mice. Where more than one slice was analysed per mouse, and average was taken to provide a single data point per mouse. Main genotype effect: F (1, 60) = 26.54, p = 3.02E−6 (two-way ANOVA). Post-hoc (Bonferroni) p values: 0.010, 0.0017. D Shows example pictures, scale bar 100 µm.
Fig. 6
Fig. 6. Astrocytic Nrf2 slows transcriptional perturbation and physical deterioration of the MAPTP301S mouse.
A RNA-seq analysis of the early-stage neocortex (MAPTP301S vs WT). Genes induced (red) and repressed (blue) are highlighted (>1FPKM, Benjamini–Hochberg-adjusted p value (p_adj)<0.05); n = 4 animals per genotype. B RNA-seq analysis of early-stage neocortex (MAPTP301S_X_GFAP-Nrf2 vs. GFAP-Nrf2). Genes induced (red) and repressed (blue) from A  are highlighted; n = 4 animals per genotype. C, D A comparison of the fold change in gene expression caused by MAPTP301S expression in an otherwise WT background (i.e. MAPTP301S vs. WT) compared to the fold change in gene expression caused by MAPTP301S expression against a GFAP-Nrf2 background (i.e. MAPTP301S vs. MAPTP301S_X_GFAP-Nrf2). Genes induced (C) or repressed (D) (i.e., genes highlighted in B) are shown. C Note how GFAP-Nrf2 represses the induction of MAPTP301S -induced genes and inhibits the repression of MAPTP301S -repressed genes. t = 11.12, df = 398, p = 1.7E−25 (C); t = 11.89, df = 458, p = 1.2E−28 (D), paired t-test. E Horizontal bar performance of mice of the indicated genotypes. Mean ± SEM shown (n = 39 WT, 53 MAPTP301S, 17 MAPTP301S_X_GFAP-Nrf2 mice studied at 19 and 20 weeks; 32 WT, 35 MAPTP301S, 17 MAPTP301S_X_GFAP-Nrf2 at 21 weeks). Two-way ANOVA reveals a main genotype effect (F (2, 83) = 23.13, p = 1.04E−8). *Bonferroni’s post-hoc test (left to right): p = 0.0338, 0.00028, 2.93E−11.
Fig. 7
Fig. 7. Astrocytic Nrf2 reduces Aß pathology.
A Schematic illustrating the crossing of APP/PS1 and GFAP-Nrf2 mice. BD Brains were fixed in 4% of paraformaldehyde and embedded in paraffin. The brains were cut into 10 μm coronal sections. Antigen retrieval was performed using either formic acid or sodium citrate buffer prior to immunohistochemical staining with 6E10 antibody and processed by VECTASTAIN® Elite® ABC kit. (B) shows an example picture at low magnification, with (C) and (D) focusing on the cortex and hippocampus (CA1), respectively. Arrowheads indicate 6E10 staining in plaques and neurons of APP/PS1 and APP/PS1_X_GFAP-Nrf2 mice. Quantification of total plaque number (left), average diameter (middle) and percent area covered (right) in the cortex (E) and hippocampus (F). Mean ± SEM shown here and throughout this figure. *p = 0.0003, 0.0033 (E); 0.0015, 0.0047 (F), unpaired two-sided t-test (n = 4 per mice per genotype). G, H The level of human Aß42 (E) and Aß40 (F) in Triton-X, SDS, and urea fractions in cortex and hippocampus was quantified by sandwich ELISA. Two-way ANOVA (main genotype effect) for Aβ42: F (1, 18) = 6127, p < 2.9E−24 (cortex); F (1, 18) = 2357, p < 1.5E−20 (hippocampus). *p values for (G): 7.1E−09, 6.8E−09, 9.7E−17, 0.003, 4.2E−12 (Bonferroni post-hoc test). Two-way ANOVA (main genotype effect) for Aβ40: F (1, 18) = 161.2, p = 4.9E−17 (cortex); F (1, 18) = 161.2, p = 2.0E−10 (hippocampus). *p values for (H): 1.2E−09, 1.4E−15, 2.1E−25, 1.9E−07, 1.5E−06, 1.20E−22 (Bonferroni post-hoc test). N = 4 animals per genotype. I Western analysis of whole cortical extracts for levels of full-length APP, using the 22C11 antibody. One-way ANOVA F (3, 8) = 99.92, p = 1.1E−06 followed by Bonferroni’s post-hoc test (n = 3 mice per genotype). *p < 5.6E−05, 3.3E−06, compared to WT. J RNA-seq reads from both cortex and hippocampus spanning the KM/NL Swedish locus across all four genotypes were scored as WT or mutant, and the % calculated (n = 3 mice per genotype).
Fig. 8
Fig. 8. Astrocytic Nrf2 does not alter APP processing but boosts autophagy.
A Western analysis of BACE1 expression. F (1,8) = 0.99, p = 0.35 (APP/PS1 effect-cortex); F (1,8)=0.38, p = 0.55 (GFAP-Nrf2 effect-cortex); F (1,8) = 2.24, p = 0.17 (APP/PS1 effect-hippocampus); F (1,8) = 0.43, p = 0.53 (GFAP-Nrf2 effect- hippocampus); Mean ± SEM shown here and throughout this figure. B Western analysis of 99 and 83 amino acid C-terminal fragments of APP (antibody C1/6.1) in the cortex (left) and hippocampus (right). Cortex: two-way ANOVA F (3, 16) = 53.98, p = 12.4E−08 (main genotype effect). #p = 2.1E−07, 3.6E−06, 1.7E−05, 3.8E−05 (Bonferroni’s post-hoc test, n = 3); ns p values: 0.14, >0.99. Hippocampus: two-way ANOVA F (3, 16) = 77.88, p = 9.2E−10 (main genotype effect). #p = 9.2E−06, 9.8E−04, 8.6E−06, 8.3E−05 (vs. WT, Bonferroni’s post-hoc test, n = 3); ns p values: 0.46, >0.99. C Analysis of p62 in biochemical fractions. For each fraction a two-way ANOVA was performed, showing a main effect of the APP/PS1 genotype: (Triton: F (1, 8) = 346.3, p = 9.8E−07; SDS: F (1, 8) =109.4, p = 3.1E−08; urea: F (1, 8) = 45.1, p = 0.0002), and interaction of GFAP-Nrf2 and APP/PS1 status (Triton: F (1, 8) = 31.5, p = 0.0005; SDS: F (1, 8) =13.2, p = 0.0066; urea: F (1, 8) = 12.55, p = 0.0076). #p = 2.7E−07, 3.2E−05, 1.7E−05, 0.0026, 0.0002 (effect of APP/PS1, Bonferroni’s post-hoc test). *p = 0.020, 0.0002, 4.2E−06 (effect of GFAP-Nrf2, Bonferroni’s post-hoc test). N = 3 animals/genotype. D Immunofluorescence staining of cortical sections for Iba1 (red) and amyloid (green, 6E10 antibody). Arrows indicate Iba1 immunofluorescent cells; arrowheads show 6E10 staining in plaques and neurons. Scale bar: 10 μm. E, F Western analysis of Iba1 expression. Two-way ANOVA for Iba1: F (1, 8) = 7.1, p = 0.029 (APP/PS1 effect); F (1, 8) = 23.2, p = 0.0013 (GFAP-Nrf2 effect). *p values: 0.014, 0.0018 (Bonferroni’s post-hoc test, n = 3). G Immunofluorescence staining of cortical sections for Gfap (red) and amyloid (green, 6E10 antibody). Arrows indicate Gfap-positive cells; arrowheads show 6E10 staining in plaques and neurons. Scale bar: 10 μm. H Western analysis of Gfap expression; quantitation in Fig. 8F. Two-way ANOVA for Gfap: F (1, 8) = 23.5, p = 0.0013 (APP/PS1 effect); F (1, 8) = 25.7, p = 0.0010 (GFAP-Nrf2 effect). *p values: 0.014, 0.0006 (Bonferroni’s post-hoc test, n = 3).
Fig. 9
Fig. 9. Astrocytic Nrf2 reduces Aß-induced transcriptional perturbation and cognitive deficits.
A RNA-seq analysis of the hippocampus (APP/PS1 vs WT). Genes induced (red) and repressed (blue) are highlighted (p_adj<0.05; n = 4). B RNA-seq analysis of early-stage hippocampus (APP/PS1_X_GFAP-Nrf2 vs. GFAP-Nrf2). Genes induced (red) and repressed (blue) from A  are highlighted; n = 4. C For genes in A  induced (upper) and repressed (lower), the effect of GFAP-Nrf2 is shown (i.e. APP/PS1_X_GFAP-Nrf2 vs. APP/PS1). t = 38.57, df = 682, *<1E−15 (upper); t = 87.95, df = 1455, *p < 1E−15 (lower), ratio paired t test (n = 4). Log2-fold change (APP/PS1 vs. WT) compared to log2 fold change (APP/PS1 vs. APP/PS1_X_GFAP-Nrf2) for genes induced (D) or repressed (E) (see Fig. 9A). t = 28.51, df = 993, *p < 1E−15 (D); t = 77.08, df = 1464, *p < 1E−15. F Difference in expression (GFAP-Nrf2 vs. WT) of genes induced (red) or repressed (blue) in the APP/PS1 mouse (i.e. genes from A). G RNA-seq analysis of the hippocampus (APP/PS1 vs APP/PS1_X_GFAP-Nrf2, n = 4). H GO and KEGG pathways present (p_adj < 0.05) in enrichment analysis of genes downregulated in astrocytes by Aß (APP/PS1 vs. WT, A) that were also upregulated by astrocytic Nrf2 in the APP/PS1 mouse (GFAP-Nrf2_X_APP/PS1 vs. APP/PS1, G), with pathways grouped under themes (Supplementary Data 12). I Fear conditioning test (see Methods). Data are presented as percent freezing during cue testing in 1 min bins starting 60 s after being placed in the chamber (mean ± SEM): WT(n = 18); GFAP-Nrf2 (n = 13); APP/PS1 (n = 13); APP/PS1_X_GFAP-Nrf2 (n = 11) mice. Average % freezing across bins 4–6 was calculated for a one-way ANOVA (main genotype effect): (F (3, 51) = 6.06, p = 0.0013). P values: WT vs GFAP-Nrf2, p > 0.99; GFAP-Nrf2 vs. APP/PS1_X_GFAP-Nrf2, p > 0.99; WT vs APP/PS1, *p = 0.0022; APP/PS1 vs APP/PS1_X_GFAP-Nrf2, *p = 0.040 (Bonferroni’s post-hoc test).

References

    1. Selkoe DJ, Hardy J. The amyloid hypothesis of Alzheimer’s disease at 25 years. EMBO Mol. Med. 2016;8:595–608. - PMC - PubMed
    1. De Strooper B, Karran E. The cellular phase of Alzheimer’s disease. Cell. 2016;164:603–615. - PubMed
    1. Belanger M, Allaman I, Magistretti PJ. Brain energy metabolism: focus on astrocyte-neuron metabolic cooperation. Cell Metab. 2011;14:724–738. - PubMed
    1. Burda JE, Sofroniew MV. Reactive gliosis and the multicellular response to CNS damage and disease. Neuron. 2014;81:229–248. - PMC - PubMed
    1. Mathys H, et al. Single-cell transcriptomic analysis of Alzheimer’s disease. Nature. 2019;570:332–337. - PMC - PubMed

Publication types

MeSH terms