. 2022 Jan 10;13(1):107.
doi: 10.1038/s41467-021-27732-4.

Grainyhead 1 acts as a drug-inducible conserved transcriptional regulator linked to insulin signaling and lifespan

Affiliations

Grainyhead 1 acts as a drug-inducible conserved transcriptional regulator linked to insulin signaling and lifespan

Giovanna Grigolon et al. Nat Commun. .

Abstract

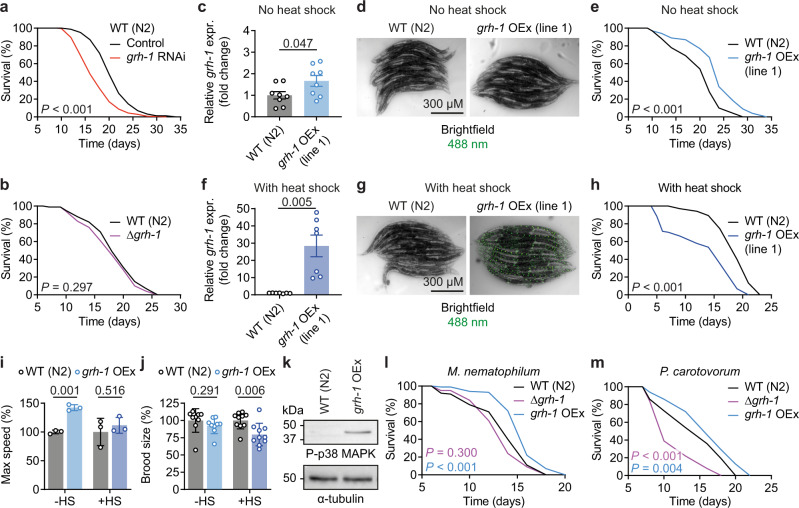
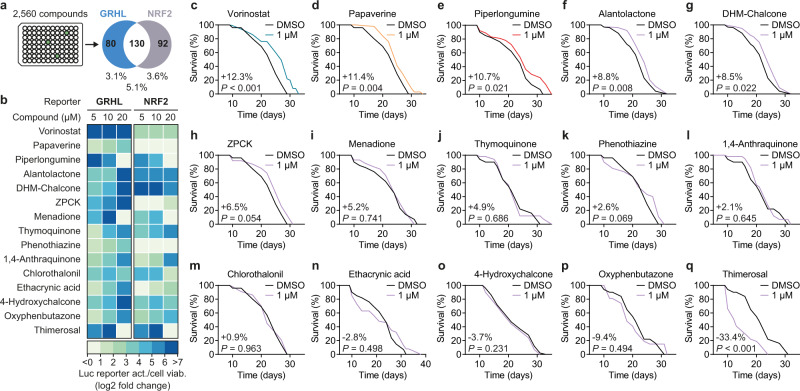
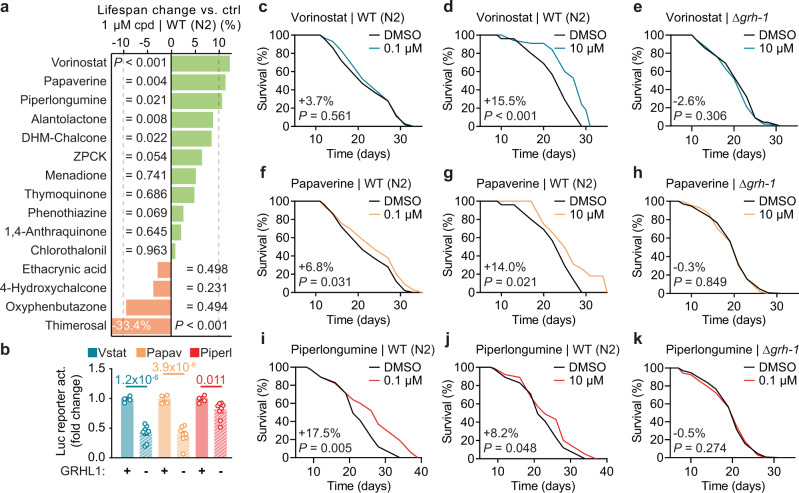
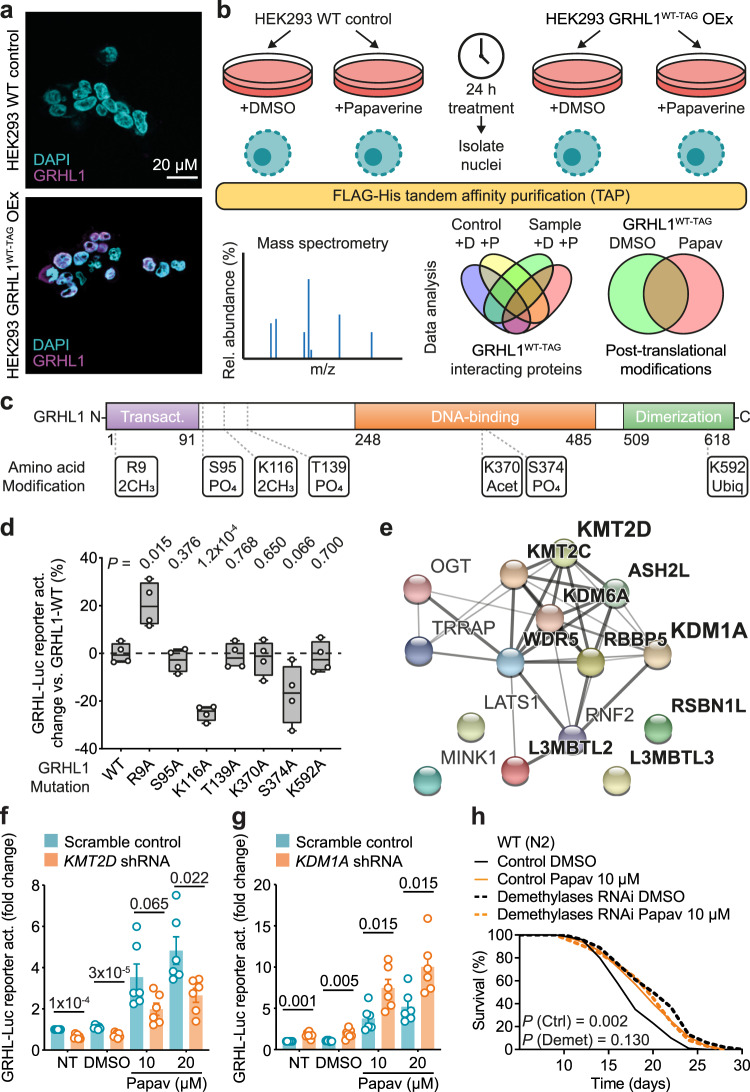
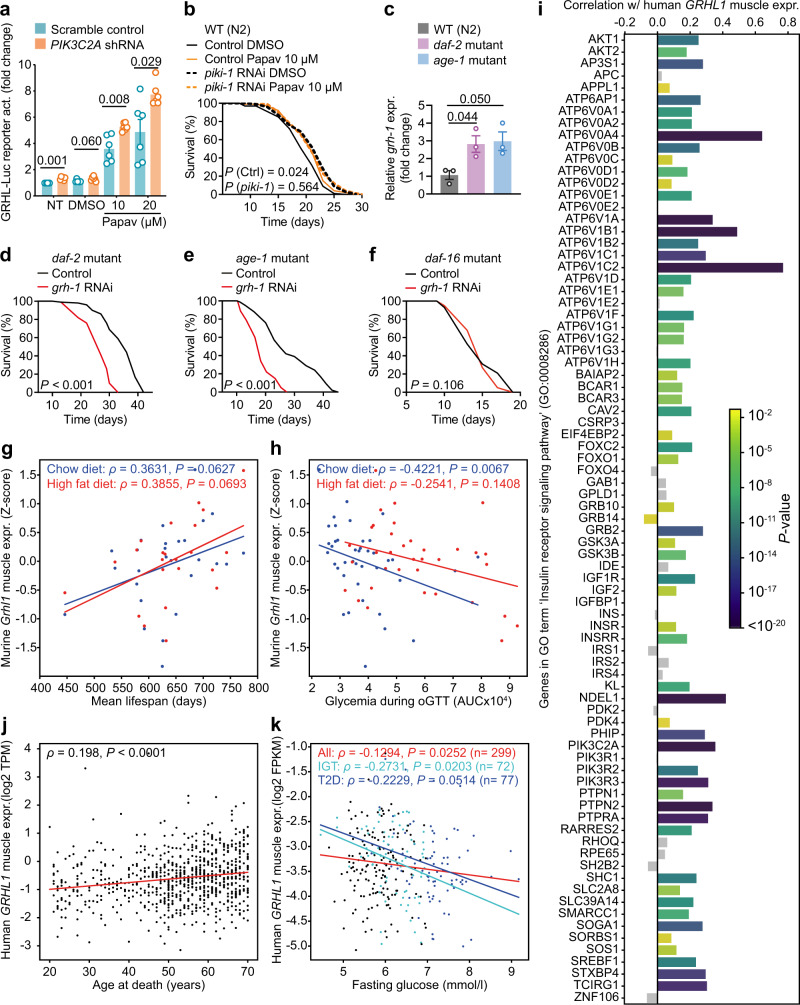
Aging is impacted by interventions across species, often converging on metabolic pathways. Transcription factors regulate longevity yet approaches for their pharmacological modulation to exert geroprotection remain sparse. We show that increased expression of the transcription factor Grainyhead 1 (GRH-1) promotes lifespan and pathogen resistance in Caenorhabditis elegans. A compound screen identifies FDA-approved drugs able to activate human GRHL1 and promote nematodal GRH-1-dependent longevity. GRHL1 activity is regulated by post-translational lysine methylation and the phosphoinositide (PI) 3-kinase C2A. Consistently, nematodal longevity following impairment of the PI 3-kinase or insulin/IGF-1 receptor requires grh-1. In BXD mice, Grhl1 expression is positively correlated with lifespan and insulin sensitivity. In humans, GRHL1 expression positively correlates with insulin receptor signaling and also with lifespan. Fasting blood glucose levels, including in individuals with type 2 diabetes, are negatively correlated with GRHL1 expression. Thereby, GRH-1/GRHL1 is identified as a pharmacologically malleable transcription factor impacting insulin signaling and lifespan.


Conflict of interest statement

The authors declare no competing interests.

Figures

Fig. 1
Fig. 1. GRH-1 is a longevity-promoting transcription factor.
a Lifespan assay of wild-type (WT) N2 nematodes on post-developmental grh-1 RNAi compared to control vector L4440. b Lifespan assay on OP50 bacteria using a grh-1 deletion strain (null mutant VC2072) vs. WT (N2). ce WT (N2) vs. grh-1 OEx line 1 (without heat shock) RT-qPCR of grh-1 with n = 8 for both (c), microscopy images to detect GRH-1::GFP (d), and lifespan on OP50 bacteria (e). fh Same experiments as in (c–e) but in each case using heat shocked grh-1 OEx line 1 vs. respective WT (N2) control (RT-qPCR with n = 7 for both). i, j Motility (i) and fertility (j) assays of WT (N2) vs. grh-1 OEx sans (−HS) or with (+HS) heat shock (motility assay with n = 3 for all; fertility assay with n = 9 for −HS and n = 10 for +HS). k Western blot of phospho-p38 MAPK in WT (N2) and grh-1 OEx with α-tubulin as loading control. l, m Lifespan assay of WT (N2) vs. Δgrh-1 and grh-1 OEx on pathogenic M. nematophilum (l) or P. carotovorum bacteria (m). Data in bar graphs are mean ± SEM, with sample sizes as stated and individual data points representing biological replicates. P-values were determined with two-tailed unequal variances t-tests of the indicated comparisons of unpaired control vs. treatment groups. P-values of C. elegans lifespan assays were determined by log-rank test. See Supplementary Data 1 for detailed lifespan assay statistics, Supplementary Fig. 1a, d for microscopy images corresponding to (d and g), and Supplementary Fig. 2f for full western blot images corresponding to (k). Source data are provided as a Source data file.
Fig. 2
Fig. 2. Human GRHL1-activating compounds and their impact on nematodal lifespan.
a Schematic Venn diagram of hits activating a human GRHL and/or NRF2 luciferase reporter with fold change ≥2 at 10 µM in the primary screening. Indicated are total number of hits and hits as percentage of full library (2560 compounds). See Supplementary Data 4. b Heat map depicting log2 fold change reporter activation in a three-point dose–response assay (5, 10, and 20 µM) of the top 15 GRHL hit compounds on the reporters as in (a), normalized to cell viability (n = 2–3 per condition). cq Lifespan assays, all using WT (N2) nematodes treated with the respective individual compound at a concentration of 1 µM in plate and vs. DMSO control. Lifespan graphs contain percentage change of mean lifespan compound vs. DMSO control and P-values as determined by log-rank test. See Supplementary Data 1 for detailed lifespan assay statistics. Source data are provided as a Source data file.
Fig. 3
Fig. 3. GRH-1 dependency of nematodal lifespan-extension elicited by selected GRHL1-activating compounds.
a Overview of impact of the respective compound (cpd) on lifespan of wild-type (WT) N2 nematodes at 1 µM in plate, as percentage change of mean lifespan vs. control treatment with DMSO (ctrl). Also see Fig. 2c–q. b Activation of GRHL reporter by the top 3 lifespan-extending compounds from (a) (Vstat = vorinostat, Papav = papaverine, Piperl = piperlongumine) at 5–10 µM in the presence (wild-type reporter with n = 4) or absence (two independent deletion reporters with n = 8 combined) of GRHL1. c, d Lifespan assays of vorinostat at 0.1 (c) or 10 µM (d) in plate, using WT (N2) nematodes and vs. DMSO control. e Lifespan assay of vorinostat at 10 µM in plate, using Δgrh-1 and vs. DMSO control. f, g Similar to (c), (d), using papaverine. h Similar to (e), using papaverine at 10 µM in plate. i, j Similar to (c), (d), using piperlongumine. k Similar to (e), using piperlongumine at 0.1 µM in plate. Data in bar graphs are mean ± SEM, with sample sizes as stated and individual data points representing biological replicates. P-values were determined with two-tailed unequal variances t-tests of the indicated comparisons of unpaired control vs. treatment groups. Lifespan graphs contain percentage change of mean lifespan compound vs. DMSO control and P-values as determined by log-rank test. See Supplementary Data 1 for detailed lifespan assay statistics. Source data are provided as a Source data file.
Fig. 4
Fig. 4. GRH-1/GRHL1 are regulated by lysine methylation.
a Microscopy images of a HEK293 wild-type (WT) and the GRHL1WT-TAG-overexpressing cell line as DAPI staining and GRHL1 immunofluorescence overlay. See Supplementary Fig. 3h. b Experimental design of GRHL1WT-TAG tandem-affinity purification (TAP) from isolated nuclei and subsequent mass spectrometry. c Post-translational modifications (PTMs) of human GRHL1 identified only after treatment with papaverine. Position, amino acid, and type of PTM as indicated (2CH3 = dimethylation, PO4 = phosphorylation, Acet = acetylation, Ubiq = ubiquitylation). See Supplementary Table 1 and Supplementary Data 6. d Impact of mutating individual GRHL1 amino acids on GRHL reporter activation. Depicted is percentage change vs. activation with the GRHL1 WT control with n = 4 for all. Box plot center lines indicate the median, bounds of boxes indicate the 25th to 75th percentiles, and whiskers indicate minima and maxima. e Protein–protein interaction network of GRHL1 interactors classified as impacting PTMs. Edges represent known protein–protein interactions, with darker color indicating stronger data support. Proteins in bold are linked to K-methylation. Visualized with the help of STRING (https://string-db.org). See Supplementary Fig. 3j and Supplementary Data 5. f, g Activation of the GRHL reporter without (scramble control) or with concomitant knockdown of KMT2D (f) or KDM1A (g) by shRNA and indicated treatments (NT = no treatment, DMSO = vehicle control, Papav = papaverine at 10 or 20 µM). KMT2D and KDM1A scramble vs. shRNA with n = 7 for NT and DMSO and n = 6 for Papav. h Lifespan assay of WT (N2) nematodes on post-developmental lsd-1 + spr-5 demethylases RNAi compared to control vector L4440, and both conditions additionally treated with 10 µM papaverine or DMSO control. Data in bar graphs are mean ± SEM, with sample sizes as stated and individual data points representing biological replicates. P-values were determined with two-tailed unequal variances t-tests of the indicated comparisons of unpaired control vs. treatment groups. P-values of C. elegans lifespan assays were determined by log-rank test. See Supplementary Data 1 for detailed lifespan assay statistics. Source data are provided as a Source data file.
Fig. 5
Fig. 5. Nematodal and mammalian Grainyhead TFs are linked to aging and insulin signaling.
a Activation of the GRHL reporter without (scramble control) or with concomitant knockdown of PIK3C2A by shRNA and indicated treatments (NT = no treatment, DMSO = vehicle control, Papav = papaverine at 10 or 20 µM; n = 6 for all). b Lifespan assay of wild-type (WT) N2 nematodes on post-developmental piki-1 RNAi compared to control vector L4440. Both conditions additionally treated with 10 µM papaverine or DMSO control. c RT-qPCR of grh-1, in WT (N2) vs. a daf-2 or age-1 mutant strain (n = 3 for all). df Lifespan assays with a daf-2 (d), age-1 (e), or daf-16 (f) mutant strain on post-developmental grh-1 RNAi compared to control vector L4440. g Spearman’s rho correlation between Grhl1 expression in muscle (Z-score normalized) and mean lifespan of chow and high-fat diet-fed mice from the BXD mouse genetic reference population. h Similar as in (g), depicting the correlation of Grhl1 expression in muscle with area under the curve (AUC) glycemia during oral glucose tolerance test (oGTT). i Pearson’s r correlation coefficients between GRHL1 and genes in GO term ‘Insulin receptor signaling pathway’ (GO: 0008286) in human muscle samples, derived from the GTEx database. Gray bars represent non-significant correlations (P-value > 0.05). j Spearman’s rank rho correlation between GRHL1 expression in human skeletal muscle and age at natural death from the GTEx v8 dataset (n = 621). k Spearman’s rank rho correlation between GRHL1 expression in human skeletal muscle and fasting blood glucose in the entire FUSION cohort (All) or in individuals with impaired glucose tolerance (IGT) or type 2 diabetes (T2D). Color of dots indicates IGT individuals (light blue), T2D individuals (blue), and individuals belonging to neither group (black). Data in bar graphs are mean ± SEM, with sample sizes as stated and individual data points representing biological replicates. P-values were determined with two-tailed unequal variances t-tests of the indicated comparisons of unpaired control vs. treatment groups. P-values of C. elegans lifespan assays were determined by log-rank test. See Supplementary Data 1 for detailed lifespan assay statistics. Source data are provided as a Source data file.

Similar articles

Cited by

References

    1. McCay CM. Retarded growth lifespan, ultimate body size, and age changes in the albino rat after feeding diets restricted in calories. J. Nutr. 1937;18:1–13. - PubMed
    1. Klass MR. A method for the isolation of longevity mutants in the nematode Caenorhabditis elegans and initial results. Mech. Ageing Dev. 1983;22:279–286. - PubMed
    1. Barardo D, et al. The DrugAge database of aging-related drugs. Aging Cell. 2017;16:594–597. - PMC - PubMed
    1. Finkel T. The metabolic regulation of aging. Nat. Med. 2015;21:1416–1423. - PubMed
    1. Kubben N, Misteli T. Shared molecular and cellular mechanisms of premature ageing and ageing-associated diseases. Nat. Rev. Mol. Cell Biol. 2017;18:595–609. - PMC - PubMed

Publication types

MeSH terms