. 2022 Jan 10;13(1):53.
doi: 10.1038/s41467-021-27722-6.

Proximity labeling identifies a repertoire of site-specific R-loop modulators

Affiliations

Proximity labeling identifies a repertoire of site-specific R-loop modulators

Qingqing Yan et al. Nat Commun. .

Abstract

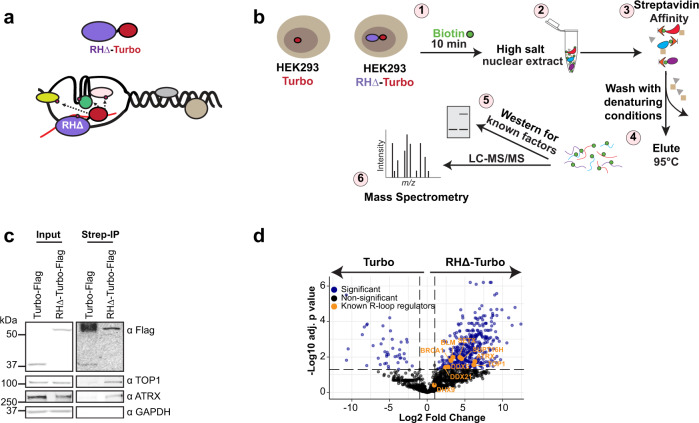
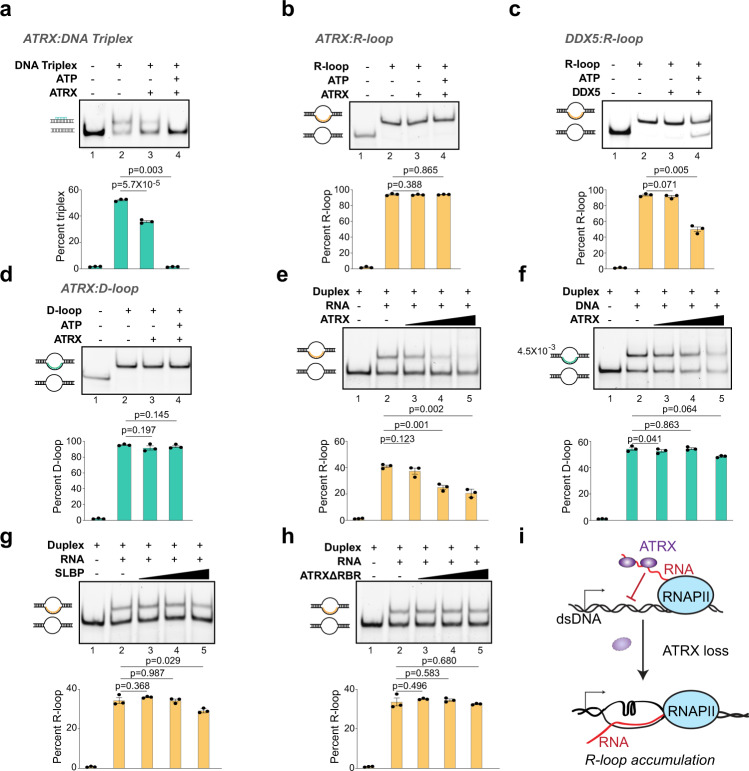
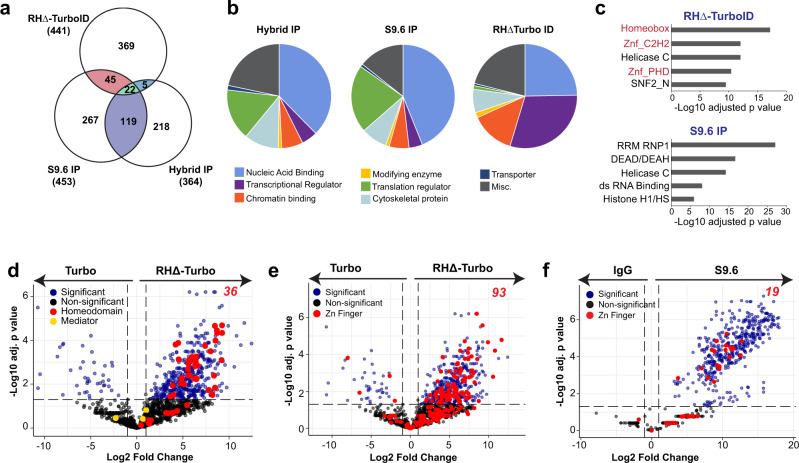
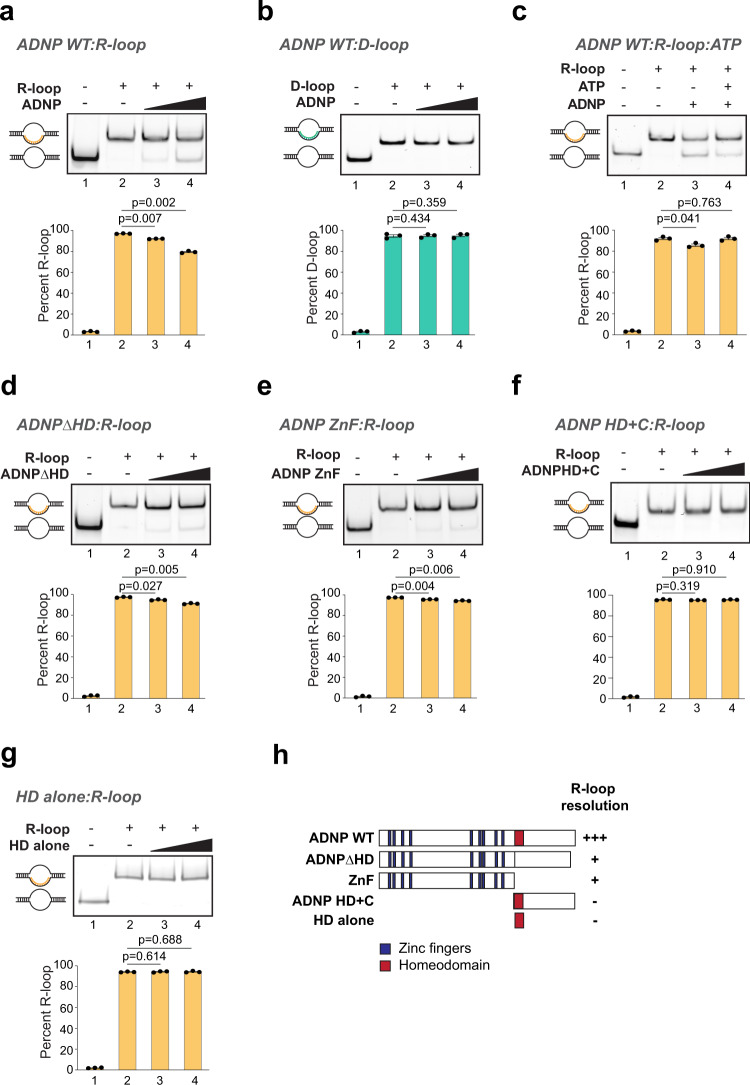
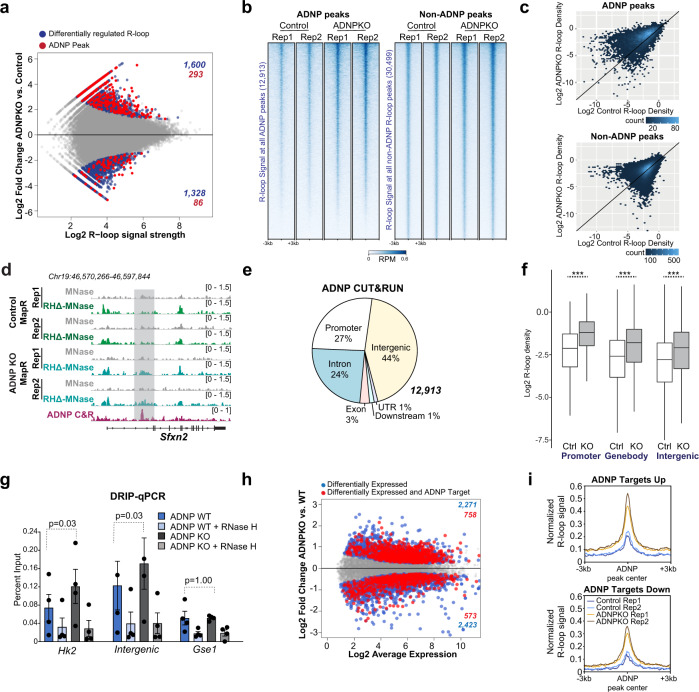
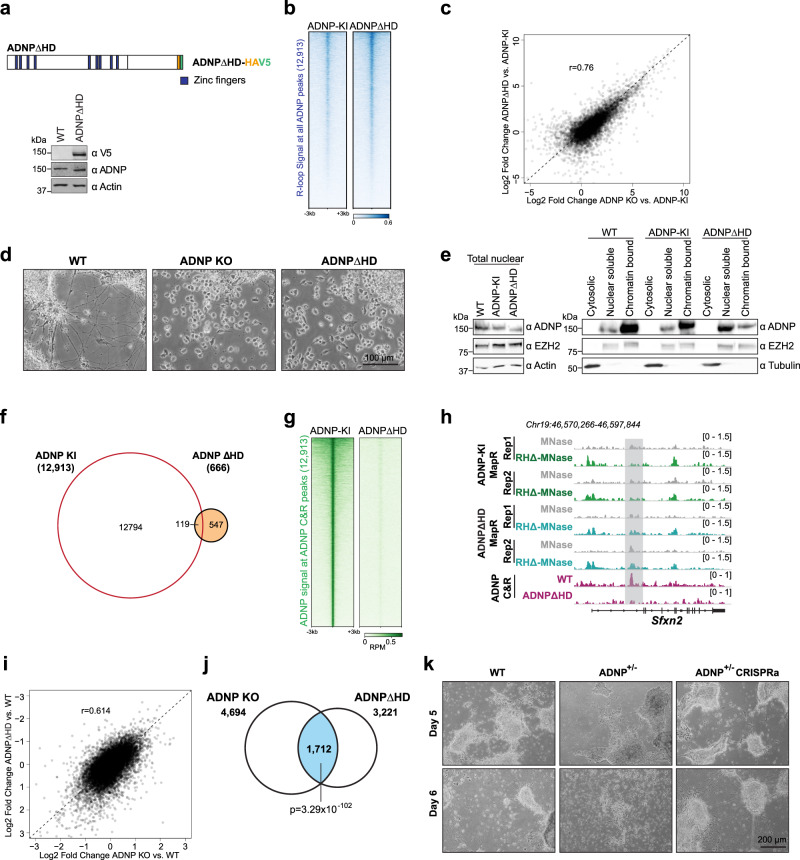
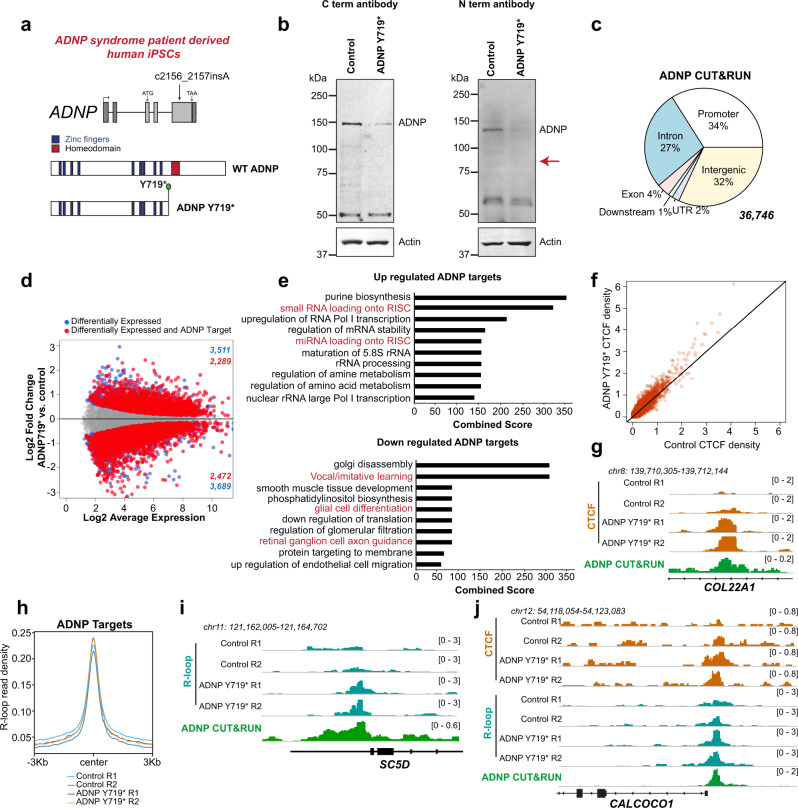
R-loops are three-stranded nucleic acid structures that accumulate on chromatin in neurological diseases and cancers and contribute to genome instability. Using a proximity-dependent labeling system, we identified distinct classes of proteins that regulate R-loops in vivo through different mechanisms. We show that ATRX suppresses R-loops by interacting with RNAs and preventing R-loop formation. Our proteomics screen also discovered an unexpected enrichment for proteins containing zinc fingers and homeodomains. One of the most consistently enriched proteins was activity-dependent neuroprotective protein (ADNP), which is frequently mutated in ASD and causal in ADNP syndrome. We find that ADNP resolves R-loops in vitro and that it is necessary to suppress R-loops in vivo at its genomic targets. Furthermore, deletion of the ADNP homeodomain severely diminishes R-loop resolution activity in vitro, results in R-loop accumulation at ADNP targets, and compromises neuronal differentiation. Notably, patient-derived human induced pluripotent stem cells that contain an ADNP syndrome-causing mutation exhibit R-loop and CTCF accumulation at ADNP targets. Our findings point to a specific role for ADNP-mediated R-loop resolution in physiological and pathological neuronal function and, more broadly, to a role for zinc finger and homeodomain proteins in R-loop regulation, with important implications for developmental disorders and cancers.


Conflict of interest statement

The authors declare no competing interests.

Figures

Fig. 1
Fig. 1. TurboID identifies the RNase H proximal proteome.
a Schematic showing RHΔ-Turbo localizing to R-loops and biotinylating proximal proteins. b Schematic of TurboID. Stable HEK293 cell lines expressing RHΔ-Turbo or Turbo alone were pulsed with biotin for 10 min (1). High salt nuclear extract was prepared (2), and biotinylated proteins isolated by streptavidin affinity purification (3). Beads were washed with denaturing conditions to minimize non-specific interactions and bound biotinylated proteins were eluted (4), tested for the presence of known R-loop regulators by western blot (5), and subjected to mass spectrometry (6). c Western blot for TOP1, ATRX, and GAPDH in HEK293 Turbo and RHΔ-Turbo input (left) and in streptavidin pull-downs (right). Antibodies are indicated on the right. Turbo and RHΔ-Turbo are detected with anti-Flag antibody. d Volcano plot showing log2 fold changes in protein intensities on the x-axis and −log10 adjusted p-values (Student’s two-sided t-test with Benjamini–Hochberg adjustment for multiple comparisons) on the y-axis. Significantly enriched proteins (blue, p < 0.05) and non-significant in black. Known R-loop regulators (orange) are labeled. Source data underlying (c) are provided as a Source data file.
Fig. 2
Fig. 2. ATRX RNA binding activity inhibits R-loop formation.
a DNA strand displacement assay with full-length ATRX (25 nM) and 1 nM DNA triplex substrates with or without ATP as indicated. Positions of duplex and DNA triplex are shown. For all subsequent panels in this figure, quantification of 3 independent experiments is shown as mean values ± SEM. p, two-sided Student’s t-test. b R-loop resolution assay with full-length ATRX (25 nM) and 1 nM R-loop substrates with or without ATP as indicated. Positions of duplex and R-loops are shown. c R-loop resolution assay with 25 nM DDX5 and 1 nM R-loop substrates without or with ATP as indicated. d D-loop resolution assay with full-length ATRX (25 nM) and 1 nM D-loop substrates with or without ATP as indicated. Positions of duplex and D-loops are shown. e R-loop formation assay with 1.25 nM DNA duplex, 3.75 nM RNA and increasing concentrations of full-length ATRX (5, 25, 125 nM). f D-loop formation assay 1.25 nM DNA duplex, 3.75 nM ssDNA and increasing concentrations of full-length ATRX (5, 25, 125 nM). g R-loop formation assay with 1.25 nM DNA duplex, 3.75 nM RNA, and increasing concentrations of full-length SLBP (5, 25, 125 nM). h R-loop formation assay with 1.25 nM DNA duplex, 3.75 nM RNA, and increasing concentrations of ATRXΔRBR (5, 25, 125 nM). i Model: ATRX interacts with repeat containing RNAs through its RNA binding region and prevents their incorporation into R-loops. ATRX deletion allows RNAs to hybridize to their complementary DNA, resulting in R-loop stabilization and accumulation. Source data underlying (ah) are provided as a Source data file.
Fig. 3
Fig. 3. Homeodomain and zinc finger proteins are enriched at R-loops.
a Venn diagram showing overlap between enriched proteins in RHΔ-TurboID, S9.6 IP, and DNA:RNA hybrid IP. Total number of significantly enriched proteins (adjusted p value < 0.05), and the numbers shared between the three methods are indicated. b Distribution of R-loop interactors from RHΔ-TurboID, S9.6 IP, and DNA:RNA hybrid IP based on molecular functions. c Top 5 most significantly enriched domains in RHΔ-TurboID and S9.6 IP. Adjusted p-values calculated by Enrichr using hypergeometric test with Benjamini–Hochberg adjustment for multiple comparisons. d Volcano plot showing log2 fold changes in protein intensities on the x-axis and −log10 adjusted p-values (Student’s two-sided t-test with Benjamini–Hochberg adjustment for multiple comparisons) on the y-axis in RHΔ-TurboID. Significantly enriched proteins in blue (p < 0.05) and non-significant in black. Homeodomain proteins are highlighted in red; components of the Mediator complex are highlighted in yellow. e Volcano plot showing log2 fold changes in protein intensities on the x-axis and −log10 adjusted p-values (Student’s two-sided t-test with Benjamini–Hochberg adjustment for multiple comparisons) on the y-axis in RHΔ-TurboID. Significantly enriched proteins (blue, p < 0.05) and non-significant in black. Zinc finger containing proteins are highlighted in red. f Volcano plot showing log2 fold changes in protein intensities on the x-axis and −log10 adjusted p-values (Student’s two-sided t-test with Benjamini–Hochberg adjustment for multiple comparisons) on the y-axis in S9.6 IP. Significantly enriched proteins (blue, p < 0.05) and non-significant in black. Zinc finger containing proteins are highlighted in red.
Fig. 4
Fig. 4. ADNP resolves R-loop structures in vitro.
a R-loop resolution assay with 40 nM and 200 nM ADNP WT and 1 nM R-loop substrates. Positions of duplex and R-loops are shown. For all resolution assays, quantification of 3 independent experiments is shown as mean values ± SEM. Two-sided Student’s t test p-values are shown. b D-loop resolution assay with 40 nM and 200 nM ADNP WT and 1 nM D-loop substrates. Positions of duplex and D-loops are shown. c R-loop resolution assay with 200 nM ADNP WT and 1 nM R-loop substrates without or with ATP as indicated. d R-loop resolution assay with 40 nM and 200 nM ADNPΔHD and 1 nM R-loop substrates. e R-loop resolution assay with 40 nM and 200 nM ADNP ZnF and 1 nM R-loop substrates. f R-loop resolution assay with 40 nM and 200 nM ADNP homeodomain and C terminus and 1 nM R-loop substrates. g R-loop resolution assay with 40 nM and 200 nM ADNP homeodomain alone and 1 nM R-loop substrates. h Summary of R-loop resolution activities of full-length ADNP WT, ADNPΔHD, ADNP ZnF, ADNP HD + C, and the homeodomain alone. Source data underlying (ag) are provided as a Source data file.
Fig. 5
Fig. 5. ADNP suppresses R-loops at its binding sites in vivo.
a MA plot of MapR signal in 61,652 R-loop peaks between Control (ADNP-KI) and ADNP KO mESCs. Blue dots indicate 2928 significant differential R-loop sites (FDR < = 0.05, DiffBind; 1600 up and 1328 down in KO). Significant differential R-loops that overlap an ADNP CUT&RUN peak (293 up, 86 down) are colored in red. b Heatmap of normalized MapR signal across 6-kb windows centered on ADNP peak locations (left) or control R-loop peaks that do not overlap ADNP peaks (right). Rows are sorted in decreasing order by mean signal across all samples. I Hexagonal-binned scatterplot of mean normalized MapR signal in control and ADNP KO mESCs across the regions shown in (b). d Genome browser view of the Sfxn2 gene showing MapR signal (RPM) in control and ADNP KO mESCs and ADNP CUT&RUN signal (RPM) in control mESCI. e Pie chart displaying distribution of 12,913 ADNP peaks across genomic features. f Boxplot displaying log2 normalized R-loop read densities in control and ADNP KO mESCs across ADNP peaks, grouped by genomic feature. ***p < 2.2 × 10−16 (Welch’s two-sided t-test; n = 3432 promoter peaks, 3653 gene body peaks, or 5828 intergenic peaks). Box, 25th percentile – median – 75th percentile. Whiskers extend to 1.5x interquartile range; outliers not displayed. g DRIP-qPCR results using the S9.6 antibody in WT and ADNP KO mESCs at an Hk2 gene region, an intergenic region, and a Gse1 gene control region. Bar chart, mean ± SEM; individual values shown as Dots. p, Welch’s two-sided t-test (n = 4 biologically independent samples). h MA plot of RNA-Seq expression for 16,195 genes between WT and ADNP KO mESCs. Blue dots indicate differentially expressed genes (adjusted p-value <=0.05; p-values computed by edgeR with Benjamini–Hochberg adjustment for multiple comparisons). Red dots indicate differentially expressed genes with an ADNP CUT&RUN peak within 3 kb of the gene body. i Signal plot of normalized control and ADNP KO MapR signal over ADNP peaks associated with ADNP target genes that are upregulated (1219 peaks) or downregulated (1040 peaks) in ADNP KO mESCs relative to WT. Source data underlying (g) are provided as a Source data file.
Fig. 6
Fig. 6. ADNP homeodomain deletion results in protein mislocalization and R-loop accumulation.
a Schematic of HA and V5 epitope-tagged ADNPΔHD (top). Zinc fingers are in blue. Western blot for V5 tag and ADNP in parental WT and ADNPΔHD mESCs (bottom). Actin serves as loading control. Antibodies indicated on the right. b Heatmap of normalized MapR signal in ADNP-KI and ADNPΔHD mESCs across 6-kb windows centered on ADNP CUT&RUN peaks. Rows are sorted in decreasing order by mean signal across all samples. c Scatterplot of log2 fold changes in R-loop read density between control and ADNP KO mESCs and log2 fold changes between ADNP-KI and ADNPΔHD mESCs across 12,913 ADNP peaks. Pearson correlation, 0.76. d Representative images of WT, ADNP KO, and ADNPΔHD cells on day 5 of differentiation. e Western blot for ADNP, EZH2, Actin, and Tubulin in WT, ADNP-KI, and ADNPΔHD mESCs total nuclear extract (left), and upon fractionation into cytosolic, nuclear soluble and chromatin-bound fractions (right). Antibodies are indicated on the right. f Venn diagram showing overlap between 12,913 ADNP CUT&RUN peaks and 666 ADNP CUT&RUN peaks called in ADNP-KI and ADNPΔHD, respectively. g Heatmap of ADNP CUT&RUN signal (RPM) in ADNP-KI and ADNPΔHD mESCs across 6-kb windows centered on 12,913 ADNP peaks. Rows are sorted in decreasing order by mean signal across all samples. h Genome browser view of the Sfxn2 gene showing MapR signal (RPM) in ADNP-KI and ADNPΔHD mESCs and ADNP CUT&RUN signal (RPM) in ADNP-KI and ADNPΔHD mESCs. i Scatterplot of log2 fold changes in RNA-Seq expression between WT and ADNP KO mESCs and log2 fold changes between WT and ADNPΔHD mESCs for 11,973 expressed genes. Pearson correlation, 0.614. j Venn diagram showing overlap between 4694 genes differentially expressed in ADNP KO and 3221 genes differentially expressed in ADNPΔHD. p-value of overlap = 3.29 × 10−102, hypergeometric test. k Representative images of WT, ADNP+/−, and ADNP+/− CRISPRa cells on days 5 and 6 of neuronal differentiation. Source data underlying a, d, e, k are provided as a Source data file.
Fig. 7
Fig. 7. Patient-derived ADNP Y719* hiPSCs display R-loop accumulation and CTCF increase at ADNP targets.
a Schematic of the human ADNP gene showing exons and location of ADNP mutation relative to the cDNA sequence (top). Zinc fingers (blue) and homeodomain (red) are present in WT ADNP protein, while ADNP Y719* lacks the homeodomain (bottom). b Western blot for ADNP and Actin in control and ADNP Y719* hiPSCs. ADNP was detected using both C- and N-terminus recognizing ADNP antibodies as indicated. c Pie chart displaying distribution of 36,746 hiPSC ADNP peaks across genomic features. d MA plot of RNA-Seq expression for 13,057 genes between control and ADNP Y719* hiPSCs. Blue dots indicate differentially expressed genes (adjusted p-value <=0.05; p-values computed by edgeR with Benjamini–Hochberg adjustment for multiple comparisons). Red dots indicate differentially expressed genes with an ADNP CUT&RUN peak within 3 kb of the gene body. e Top 10 most significantly enriched processes (obtained from Enrichr) in differentially expressed ADNP targets (red dots in d) that are up- or downregulated in ADNP Y719*. Neurologically relevant processes are shown in red. f Scatterplot of CTCF signal (RPM) in control and ADNP Y719* hiPSCs across 36,746 ADNP CUT&RUN peaks called in control hiPSCs. g Genome browser view of the COL22A1 gene showing CTCF CUT&RUN signal (RPM) in control and ADNP Y719* hiPSCs and ADNP CUT&RUN signal (RPM) in control hiPSCs. h Signal plot of normalized MapR signal in control and ADNP Y719* hiPSCs over 36,746 ADNP CUT&RUN peaks called in control hiPSCs. i Genome browser view of the SC5D gene showing MapR signal (RPM) in control and ADNP Y719* hiPSCs and ADNP CUT&RUN signal (RPM) in control. j Genome browser view of the CALCOCO1 gene showing CTCF CUT&RUN and MapR signal (RPM) in control and ADNP Y719* hiPSCs and ADNP CUT&RUN signal (RPM) in control. Source data underlying (b) are provided as a Source data file.

References

    1. Garcia-Muse T, Aguilera A. R loops: from physiological to pathological roles. Cell. 2019;179:604–618. - PubMed
    1. Crossley MP, Bocek M, Cimprich KA. R-loops as cellular regulators and genomic threats. Mol. Cell. 2019;73:398–411. - PMC - PubMed
    1. Groh M, Gromak N. Out of balance: R-loops in human disease. PLoS Genet. 2014;10:e1004630. - PMC - PubMed
    1. Thomas M, White RL, Davis RW. Hybridization of RNA to double-stranded DNA: formation of R-loops. Proc. Natl Acad. Sci. USA. 1976;73:2294–2298. - PMC - PubMed
    1. Ginno PA, Lott PL, Christensen HC, Korf I, Chedin F. R-loop formation is a distinctive characteristic of unmethylated human CpG island promoters. Mol. Cell. 2012;45:814–825. - PMC - PubMed

Publication types

MeSH terms